Downloaded 14 times


![Project: Development of Hydrological Design Aids (Surface Water) under HP-II
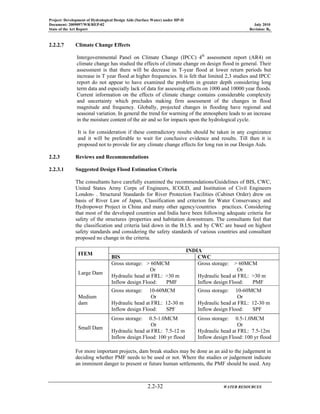
Document: 2009097/WR/REP-02 July 2010
State of the Art Report Revision: R0
2.1-11 WATER RESOURCES
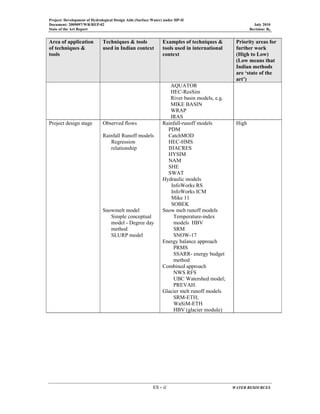
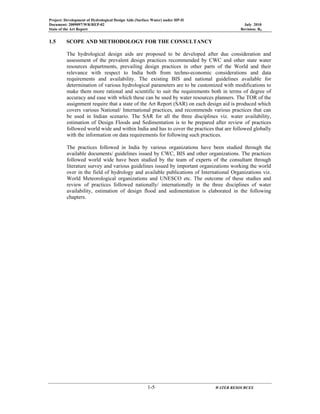
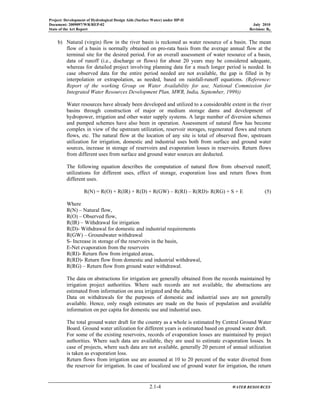
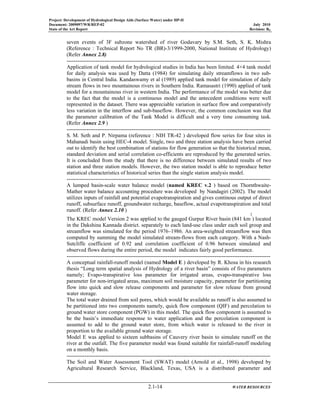
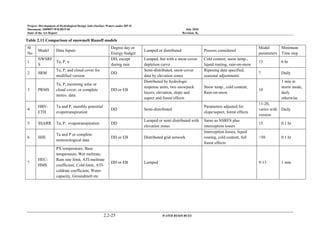
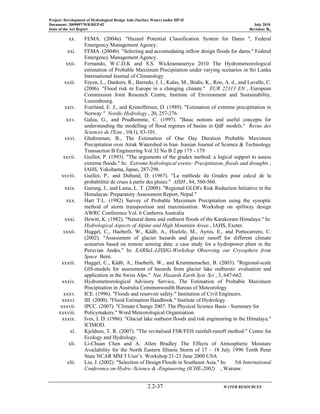
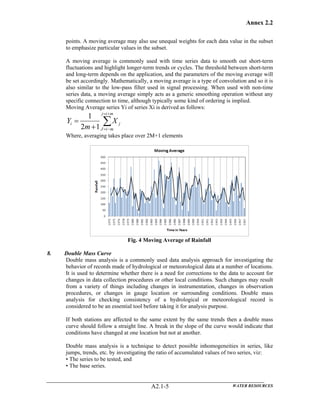
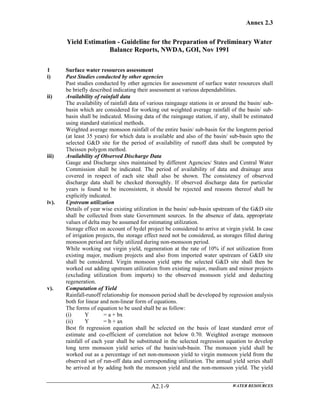
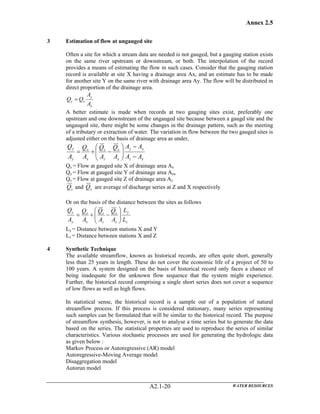
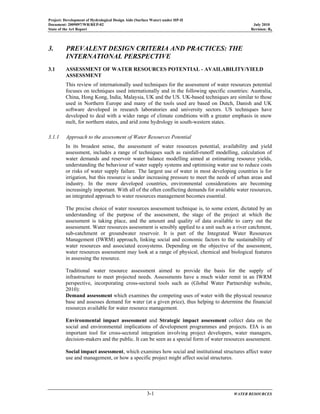
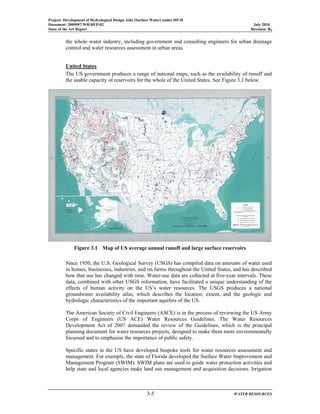
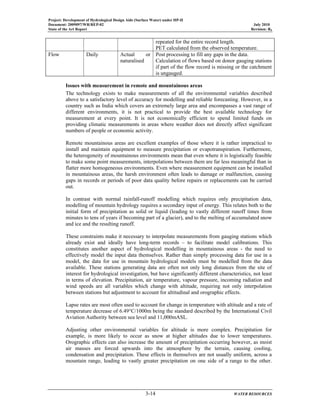
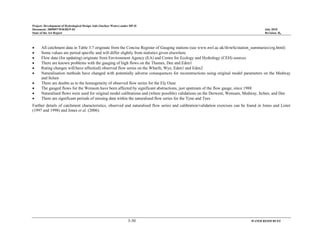
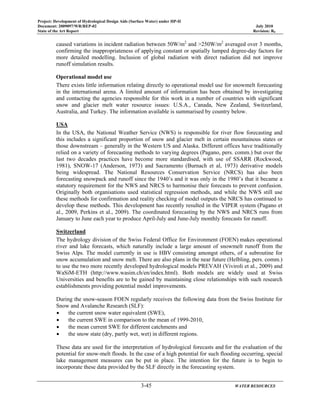
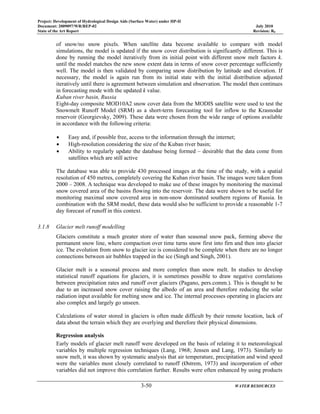
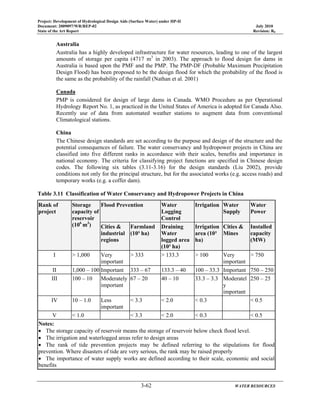
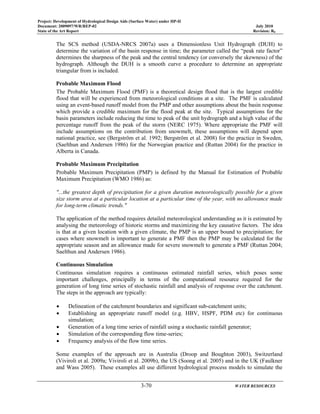
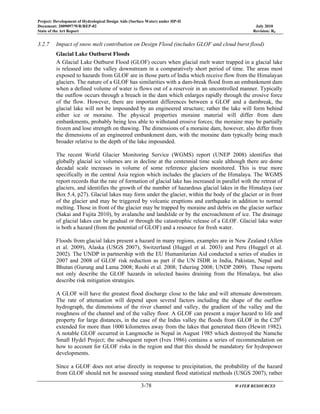
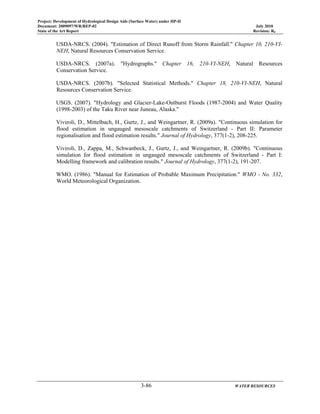
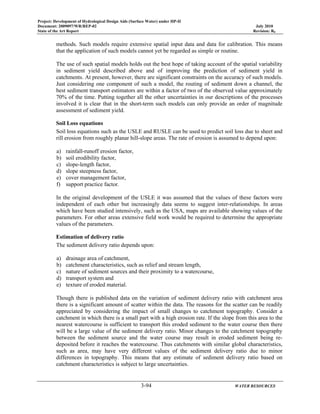
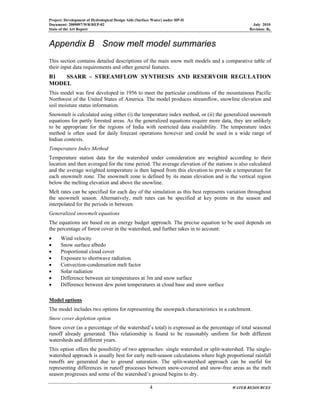
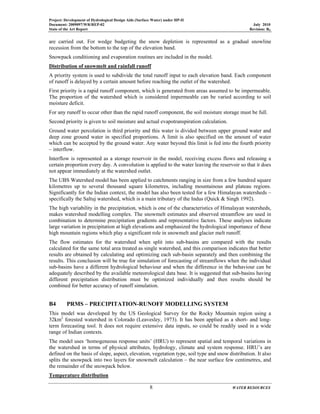
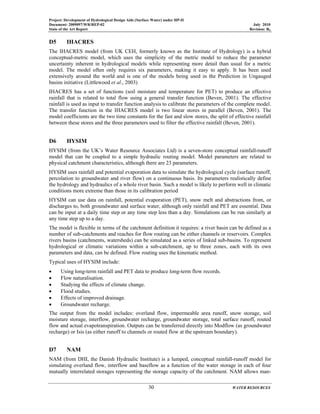
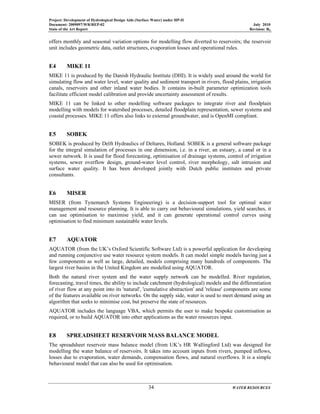
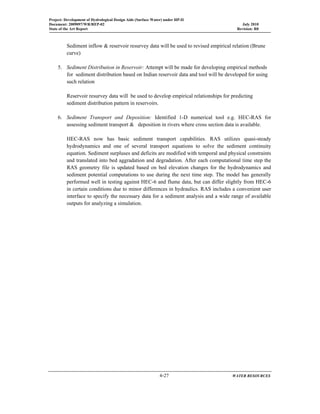
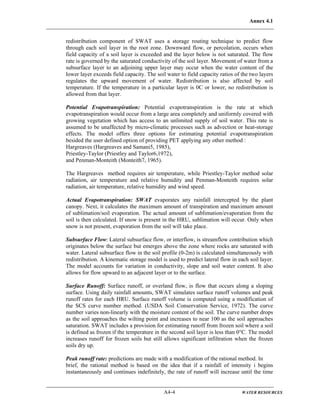
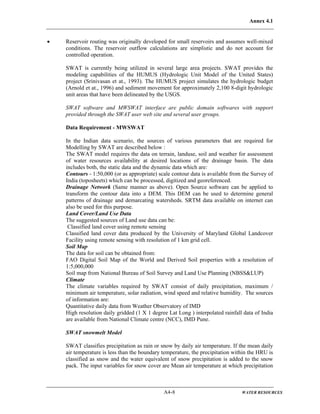
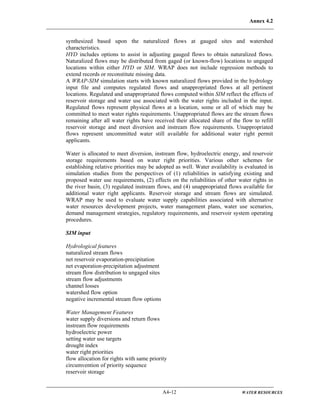
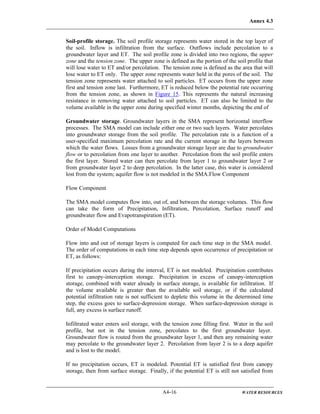
A Rational relationship was developed by Narsimaiya et. Al. (!991) to derive rainfall –runoff
relationship for Subernarekha river basin taking into account antecedent rainfall effect, land
use, elevation and catchment slope.
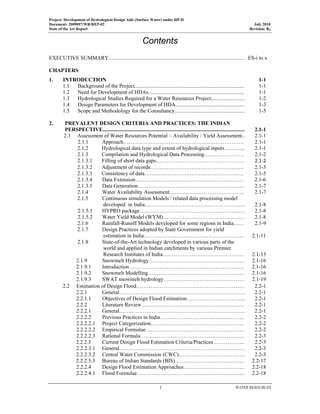
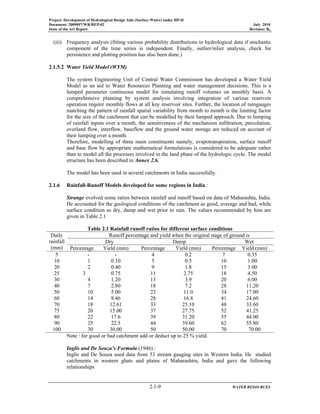
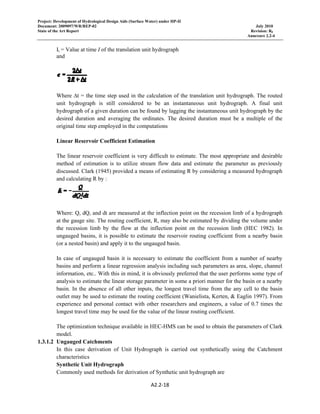
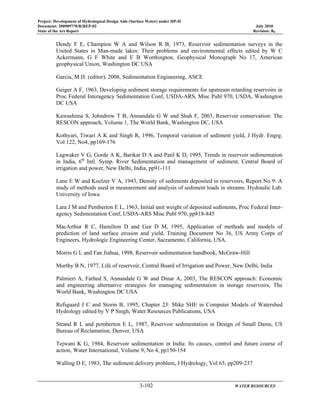
Kothyari (1995) used data from 31 non-snow fed catchments in India with areas less than
1,515 km2 in the Indian states of Uttar Pradesh, Madhya Pradesh, Bihar, Rajasthan, West
Bengal and Tamil Nadu – to develop a simple method for the estimation of monthly runoff
for the monsoon months of June to October in the following form:
{ }[ ] )()(/)1()1(1)(1)()( 1)(
IPIPIPIKIKIKIR IN
−−−+= −
(19)
where: R(I) = monthly runoff during the Ith month, P(I) = monthly areal rainfall during the Ith
month, K(I) and n(I) are parameters for the Ith month with K(I)<1.0 and n(I)>1.0. The values
of the exponent n(I) were found to vary significantly in Damodar (Bihar), Barakar (Bihar),
Mayurakshi (West Bengal), Chambal (Madhya Pradesh), Lower Bhawani (Tamil Nadu) and
Ram Ganga River (Uttar Pradesh) during any one month and the coefficient K was found to
be related to T, FA and A according to equation given below as it represents the loss from the
total rainfall.
K = 260.9 T-2.02
FA
-0.05
A0.05
where: T is temperature in o
C, A is the catchment area in km2
and FA is the percentage of
forest area. The values computed by the model were then compared with the corresponding
observed values of runoff. This comparison revealed that the proposed method produces
results with an error less than 25% for 90% of the data points. However, an error of less than
50% resulted for the arid catchments from the Chambal Basin (Madhya Pradesh).
References
Inglis, C. C and De souza, “ A critical study of runoff and floods of catchment of the Bombay
Presidency with a short note on loss from lakes by evaporation”, Bombay PWD Technical
paper No. 30 (1930).
Dhir, R. D., P.R. Ahuja and K. C. Majumdar, “ A study on the success of reservoir based on
actual and estimated runoff”, Paper presented at the Research Session of Central Board of
Irrigation and Power, India (1958).
Narasimaiya, M. K. , Upadhyay A, “Computer Applicartion in Hydrology for Runoff
Determination – A Rational Method”, National Seminar on use of Computers in Hydrology &
Water Resources, CWC, 1991.
Jha R., Smakhtin V., “A review of methods for H/ydrological estimation at ungauged sites in
India”, IWMI Working Paper 130
UPIRI (Uttar Pradesh Irrigation Research Institute). 1960. Rainfall-runoff studies for a few
Himalayan and Bundelkhand catchments of Uttar Pradesh TM 30-RR (HY-31).
Inglis, C. C. and de Souza (1946). Meanders and their bearing in river training. Maritime
Paper No. 7, Institution of Civil Engineers, London.
Khosla, A. E. 1949. Analysis and utilization of data for the appraisal of water resources, The
Central Board of Irrigation and Power Journal.
Kothyari, U. C. 1995. Estimation of Monthly Runoff from Small Catchments in India.
Journal of Hydrological Sciences 40: 533-541.](https://image.slidesharecdn.com/sar-150729075444-lva1-app6891/85/Central-Water-Commission-Ministry-Of-Water-Resources-Govt-of-India-35-320.jpg)


![Annex 2.5
WATER RESOURCESA2.1-15
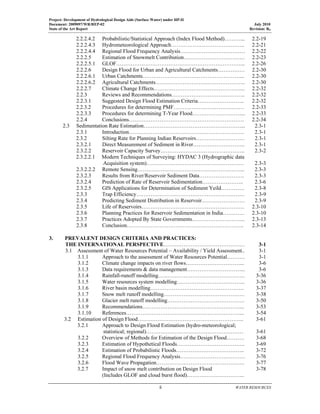
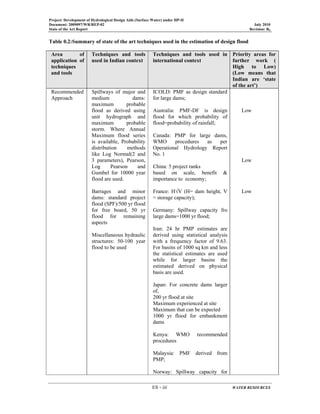
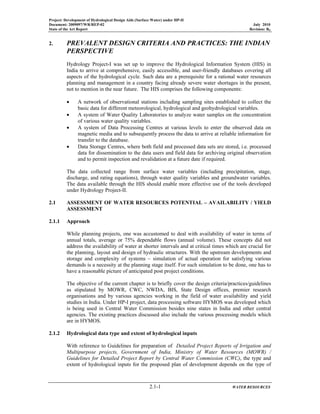
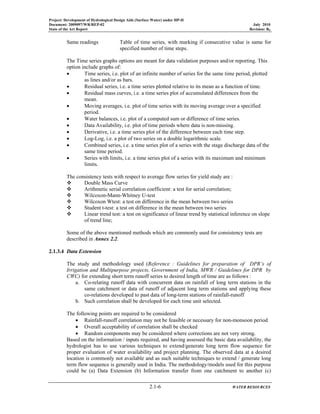
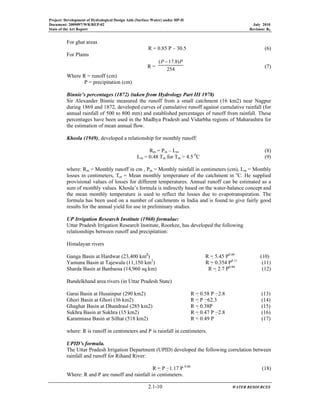
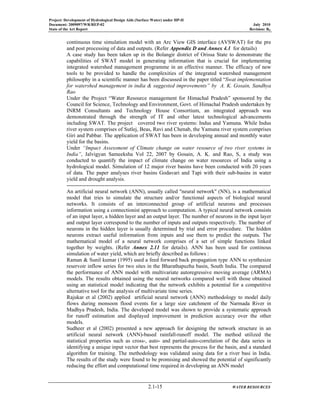
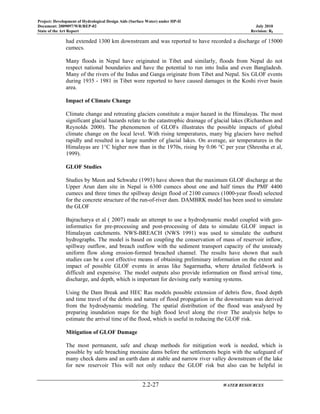
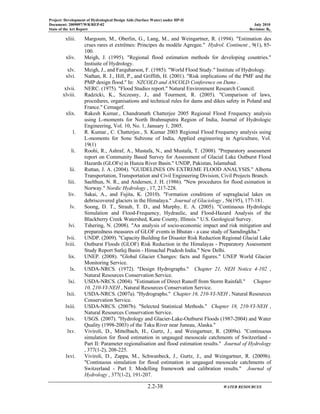
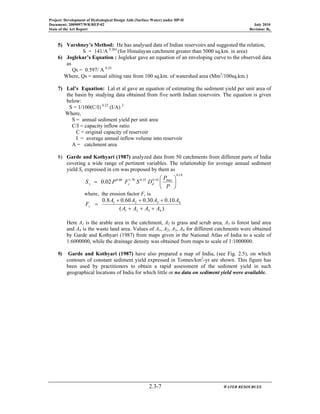
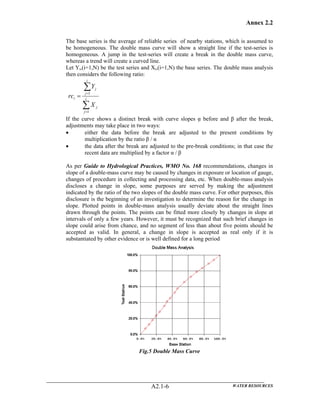
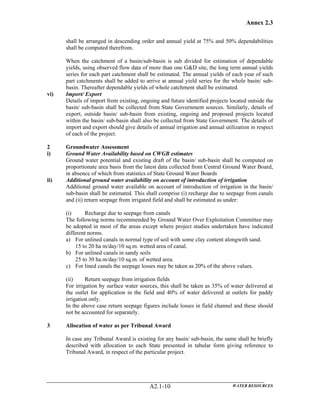
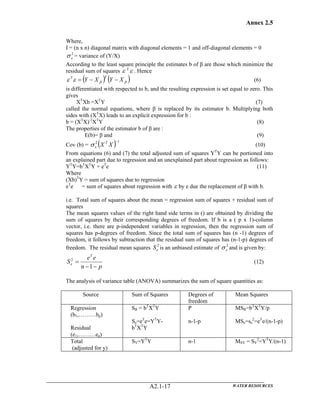
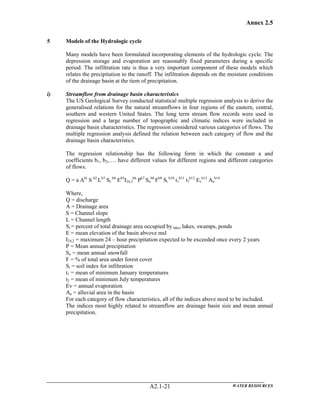
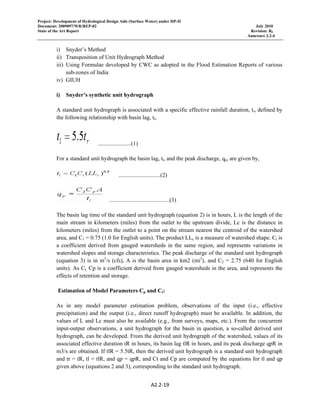
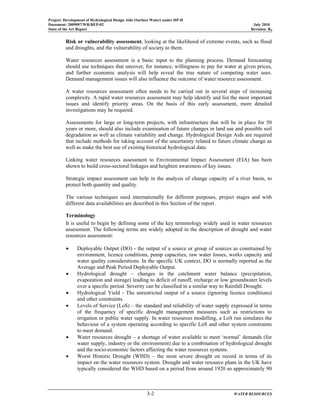
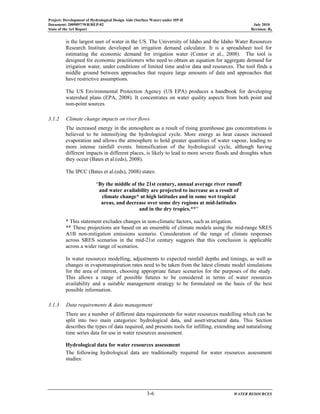
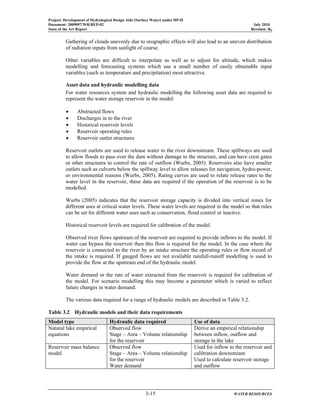
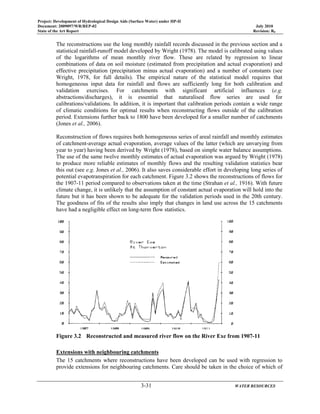
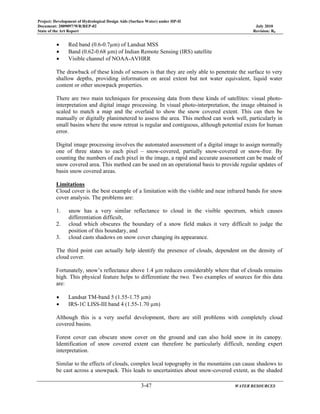
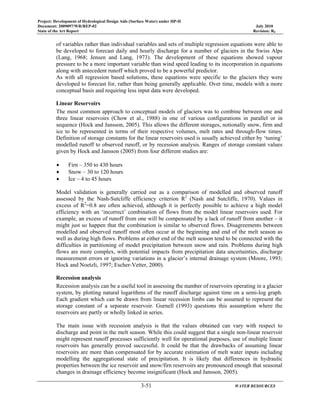
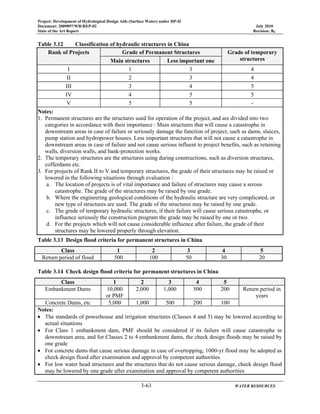
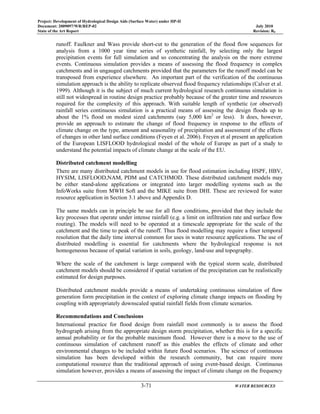
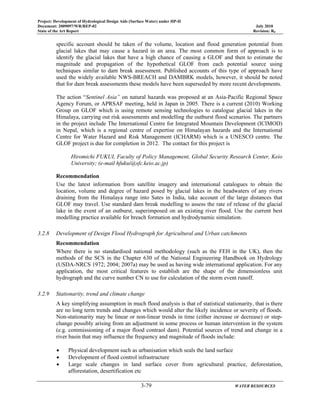
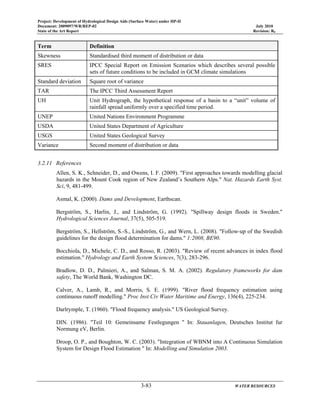
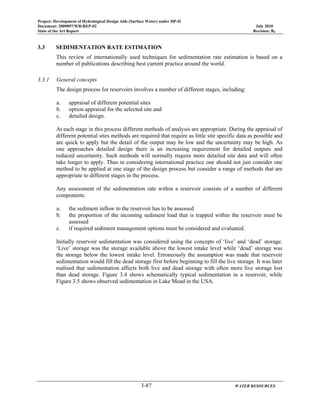
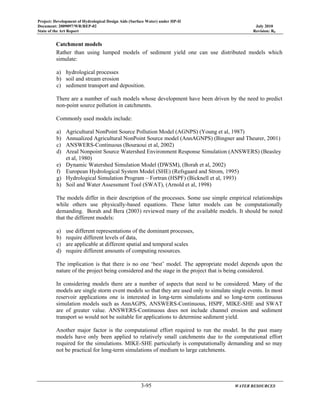
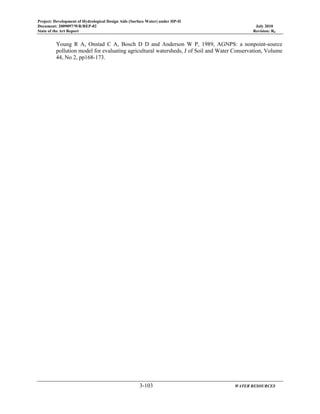
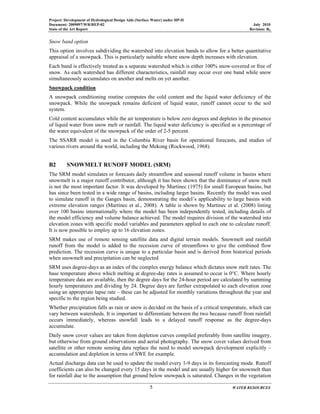
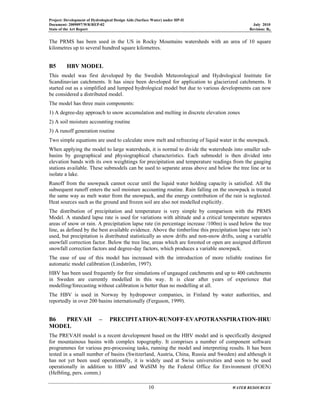
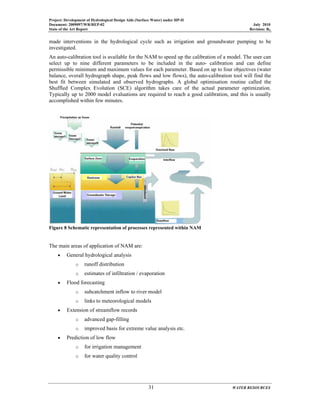
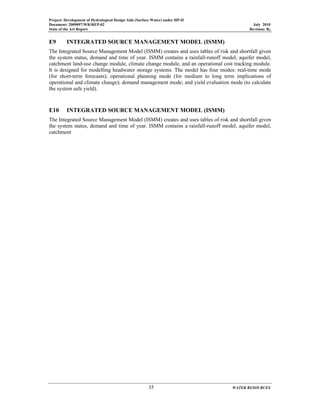
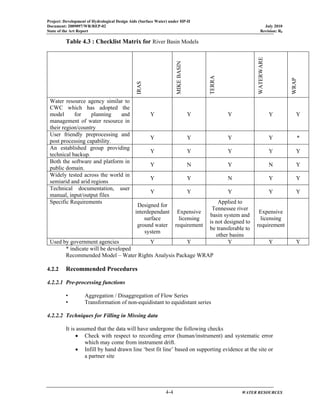
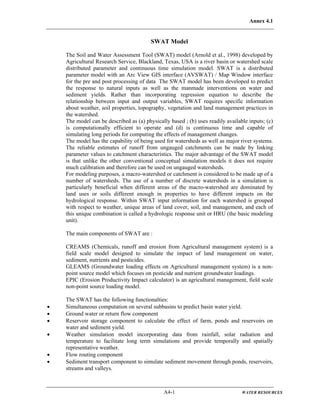
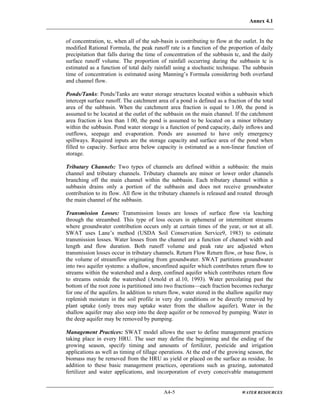
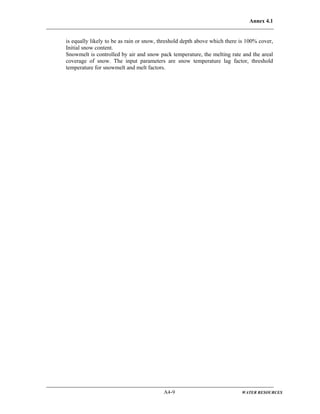
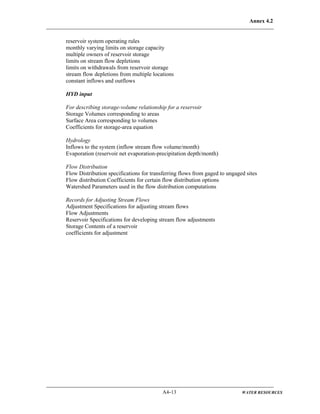
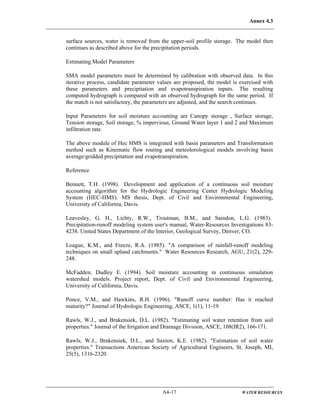
The actual observations on Y do not perfectly match with the regression equation and a
residual ε is observed,
Y = α + βX + ε
The regression line will be established such that E[ Y – Ŷ ] = E [ ε ] = 0 i.e. that it
produces unbiased results and further that the variance of the residual σε
2
is minimum.
The following steps for developing regression model are :
Estimation of regression coefficients
Measure for the goodness of fit
Confidence limits for the regression coefficients
Confidence limits for the regression equations
Confidence limits for the predicted values
Application of regression to rainfall-runoff analysis
a) Estimation of regression coefficients
The estimators for the regression coefficients α and β, denoted by a and b respectively are
determined by minimising Σε2
Denoting the observations on X and Y by x i and y i this
implies, that for:
to be minimum, the first derivatives of M with respect to a and b be set equal to zero:
From this it follows for a and b:
b) Measure for Goodness of fit
The error variance can be given by :
σε
2
=σY
2
(1 - r2
)
The closer r2
is to 1, the smaller the error variance will be and the better the regression
equation is in making predictions of Y given X. Therefore r2
is an appropriate measure
for the quality of regression fit to the observations, and is called the coefficient of
determination.
c) Confidence limits for the regression coefficients
Based on the sampling distributions of the regression parameters, the following estimates
and confidence limits hold :
A (100-α) percent confidence interval for b is found from the following confidence limits
:
222
)()ˆ( iiiii bxayyyM −−∑=−∑=∑= ε
0)(2 =−−∑−=
∂
∂
ii bxay
a
M
0)(2 =−−∑−=
∂
∂
iii bxayx
b
M
xbyaand
S
S
xxxx
yyxx
b
XX
XY
n
i
ii
n
i
ii
−==
−−
−−
=
∑
∑
=
=
:
))((
))((
1
1
XX
n
S
tbCL
1
ˆ2/1,2 εα σ−−± ±=](https://image.slidesharecdn.com/sar-150729075444-lva1-app6891/85/Central-Water-Commission-Ministry-Of-Water-Resources-Govt-of-India-114-320.jpg)
![Annex 2.5
WATER RESOURCESA2.1-16
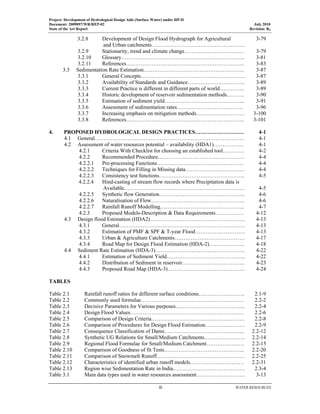
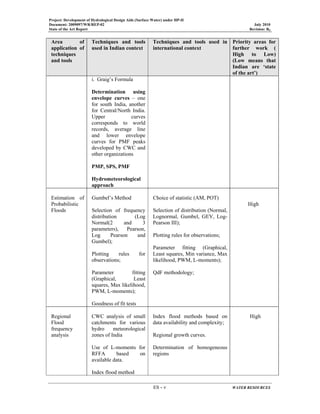
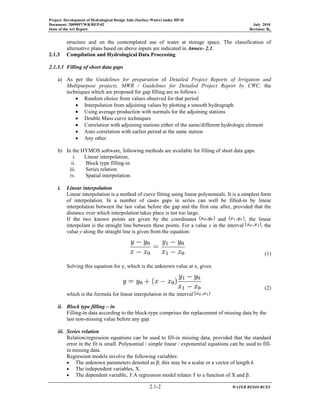
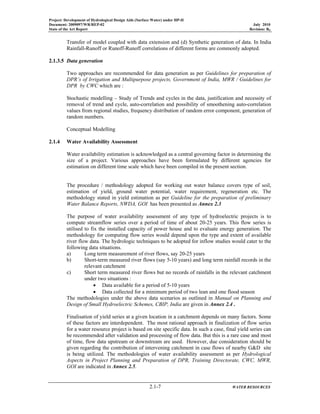
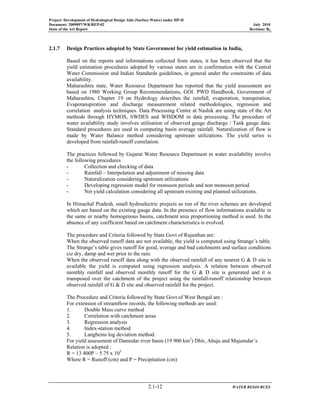
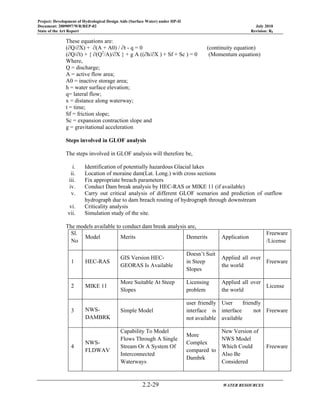
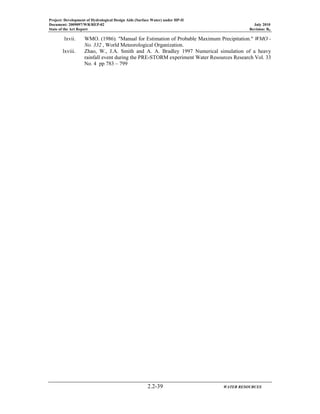
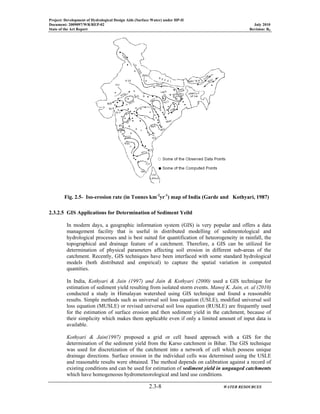
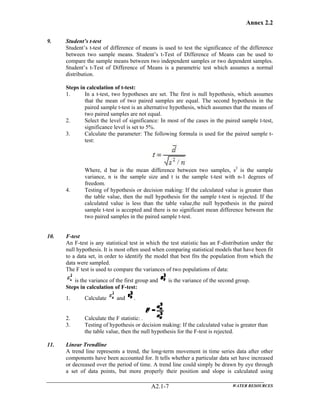
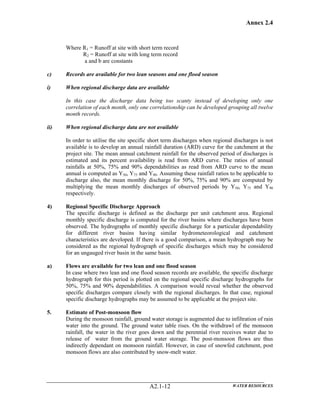
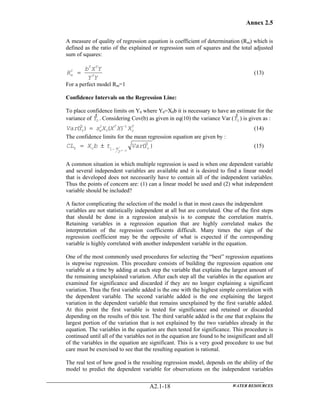
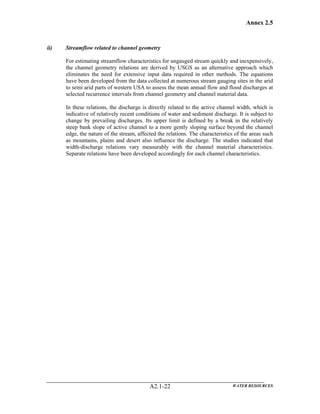
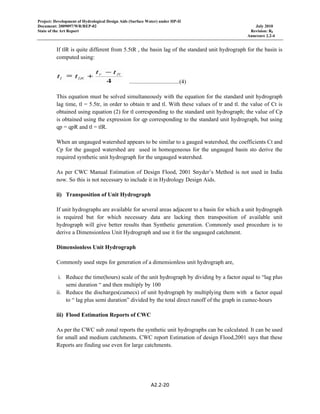
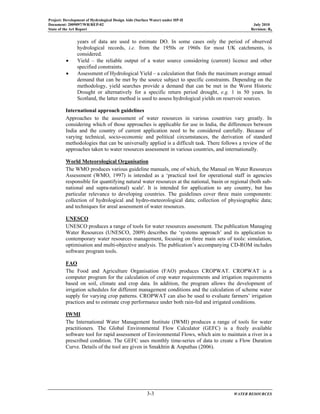
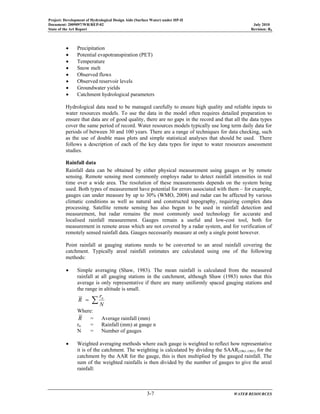
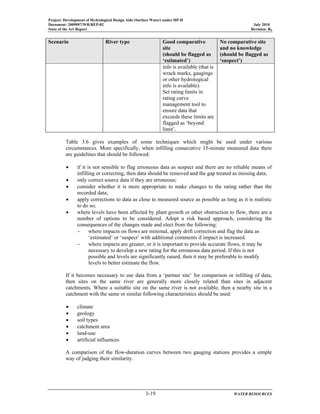
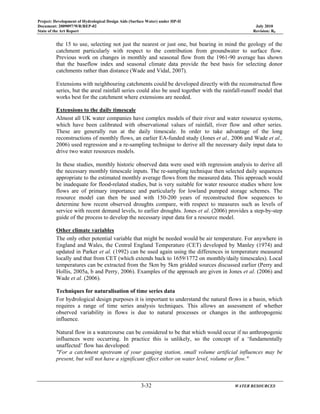
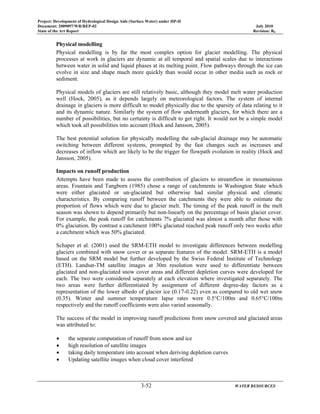
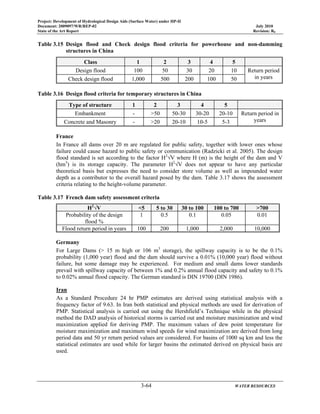
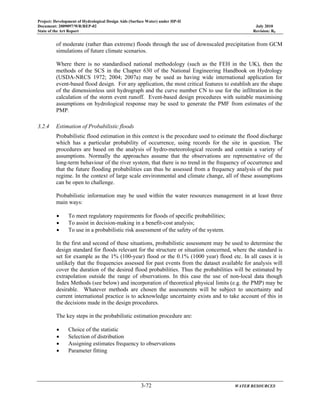
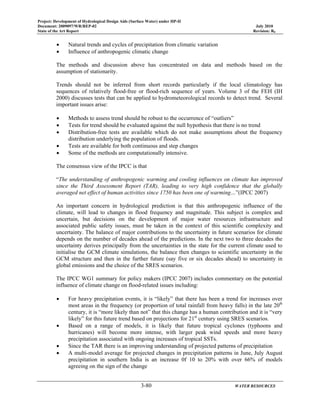
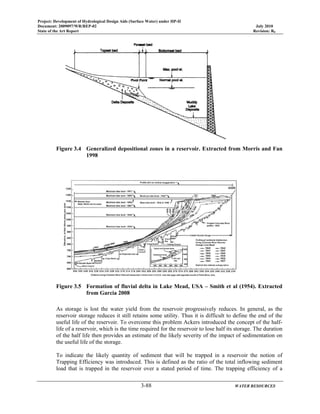
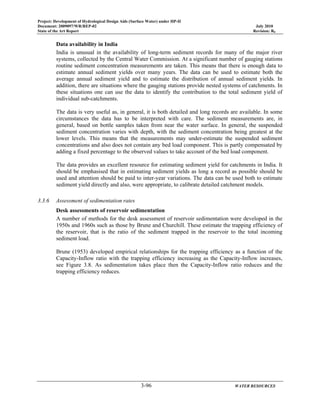
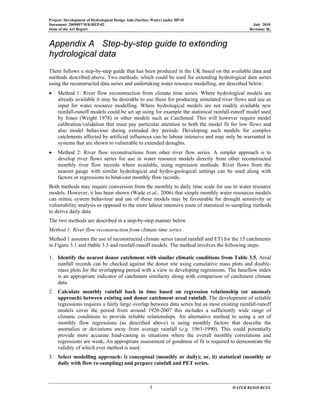
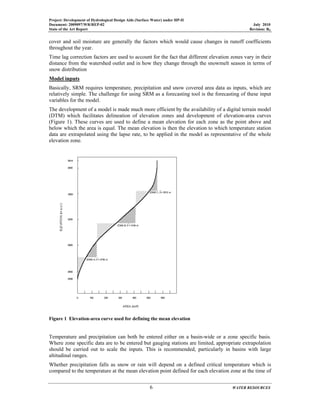
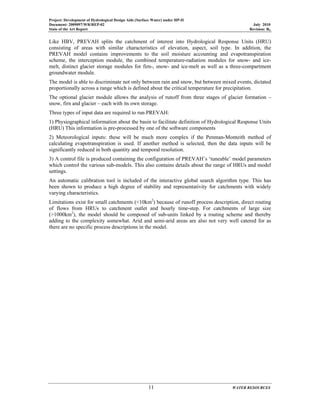
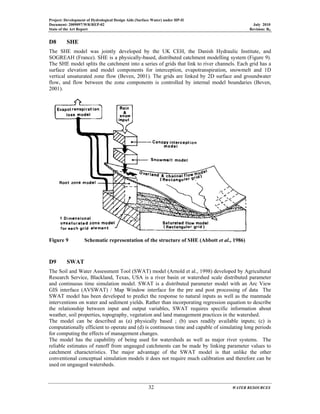
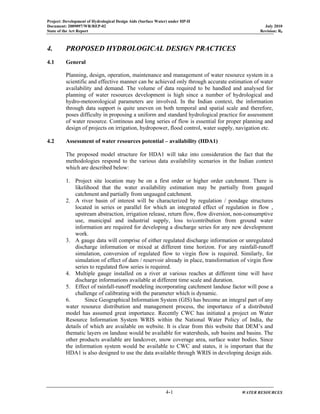
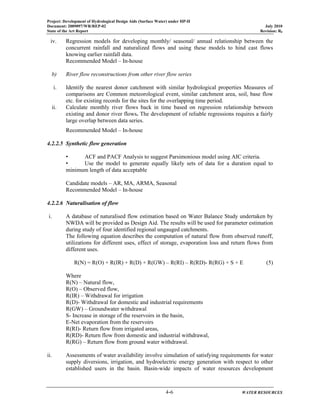
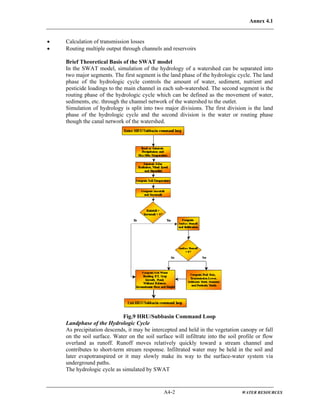
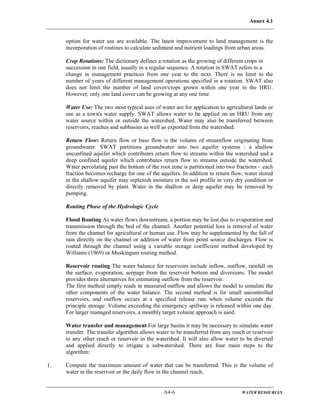
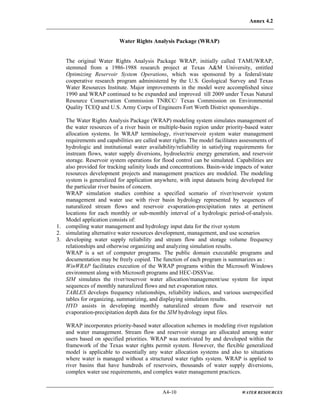
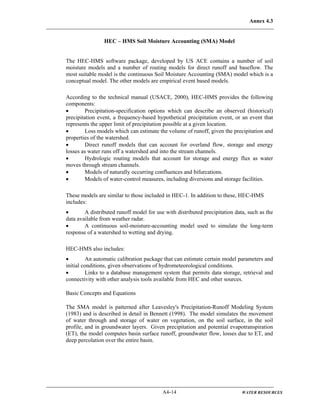
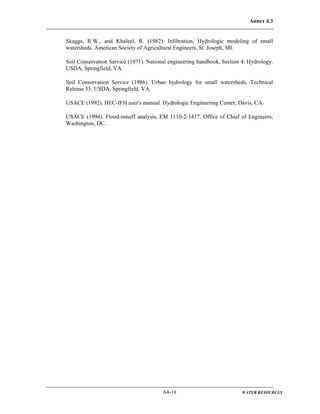
A (100-α) percent confidence interval for a is found from the following confidence limits
:
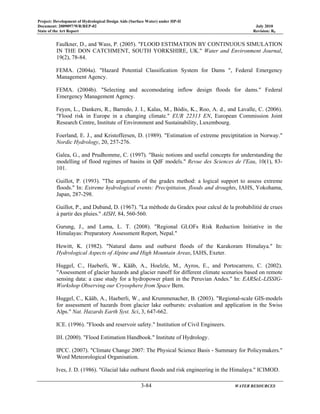
d) Confidence limits for the regression equation
A (100-α) percent confidence interval for the mean response to some input value x0 of X
is given by:
Note that the farther away x0 is away from its mean, the wider the confidence interval will
be.
e) Prediction
A (100-α) percent confidence interval for a predicted value Y when X is x0, follows that
It is observed that the confidence limits will be substantially wider than those for the
mean regression line.
f) Extrapolation
Extrapolation of a regression equation beyond the range of X to obtain a value of Y not
recommended due to the following reasons :
confidence intervals become large as X increases
Relation Y = f(X) may be non-linear for full range of X and only approximately linear for
the range of X investigated.
iii) Multiple linear Regression
Sometimes, a dependant variable is modelled as a function of several other quantities. For
example, monthly runoff is likely to be dependant on the rainfall on the same month and
in the previous months. The regression equation would be :
R(t) = α + β1 P(t) + β2 P(t-1) +… (1)
A general linear model is of the form
Y = β 1X1 + β 2X2 +…….. β pXp + ε (2)
Where Y is a dependant variable, X1 , X2 , …Xp are independent variables and β1, β 2
,….. β p are unknown parameters.
Multiple linear regression involves solving n equations for the p unknown parameters.
The n equations are given as:
Y = Xβ+ε (3)
Where,
Y = (n x 1) – data column vector of the centred dependent variable (yi-y)
X = (n x p) – data matrix of the centred independent variables (xi1-x1),…….,(xip-xp)
β = (p x 1) - column vector, containing the regression coefficients
ε = (n x 1) – column vector of residuals
The residuals are conditioned by :
E[e]=0 and (4)
Cov(e)= I2
εσ (5)
XX
n
S
xx
n
tbxaCL
2
0
2/1,20
)(1
ˆ
−
+±+= −−± εα σ
XX
n
S
xx
n
taCL
2
0
2/1,2
)(1
ˆ
−
+±= −−± εα σ
XX
n
S
xx
n
tbxaCL
2
0
2/1,20
)(1
1ˆ
−
++±+= −−± εα σ](https://image.slidesharecdn.com/sar-150729075444-lva1-app6891/85/Central-Water-Commission-Ministry-Of-Water-Resources-Govt-of-India-115-320.jpg)
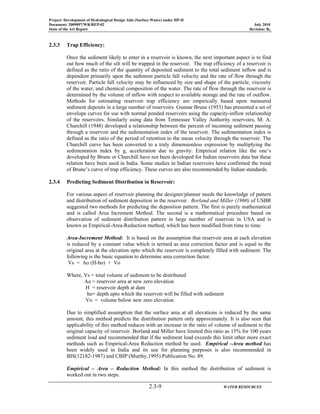
![Annex 2.9
WATER RESOURCESA2.1-30
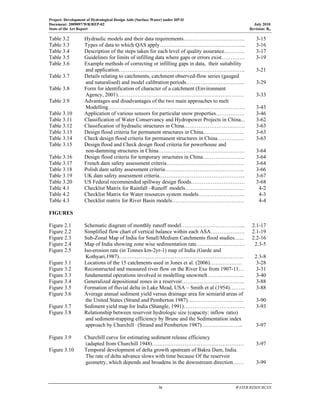
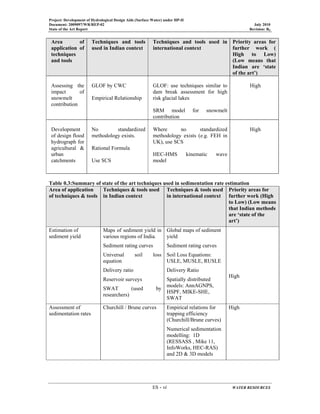
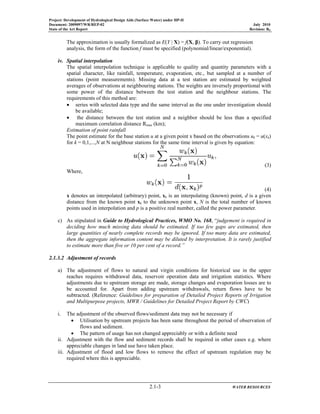
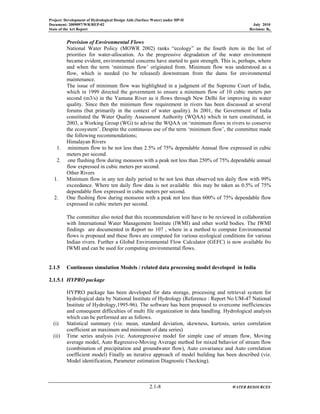
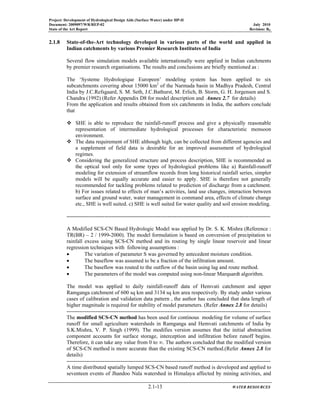
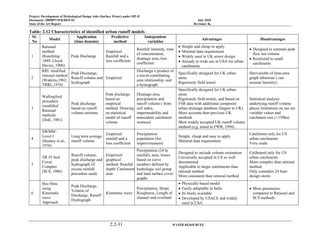
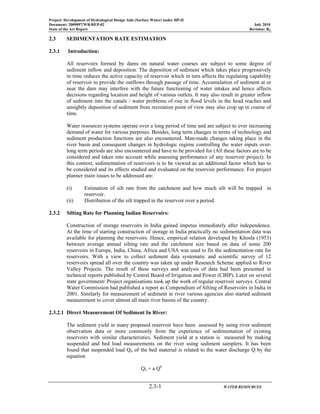
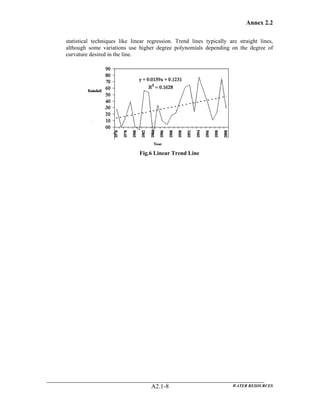
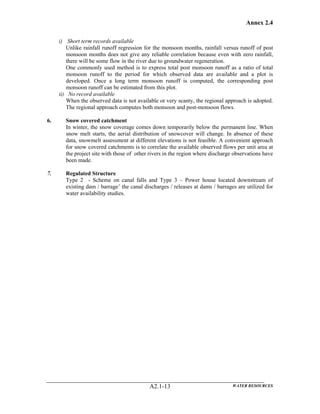
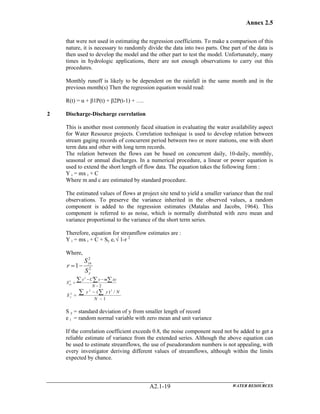
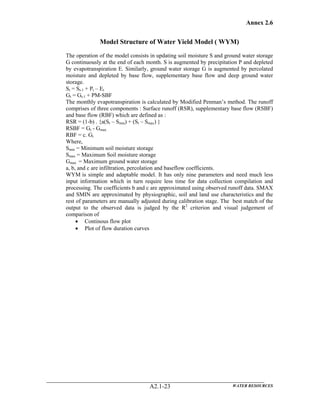
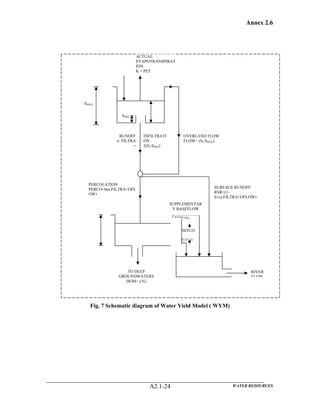
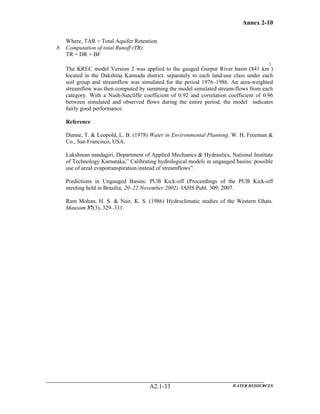
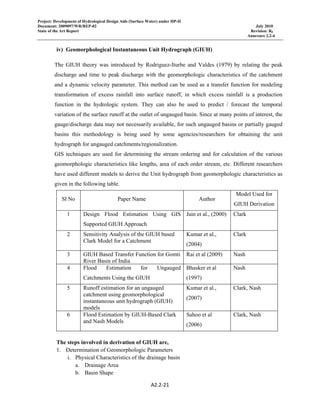
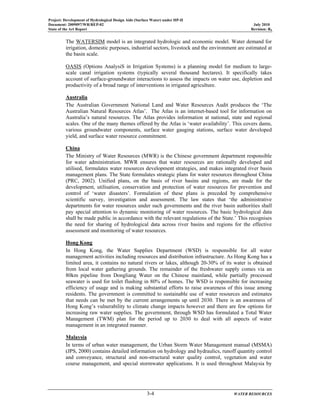
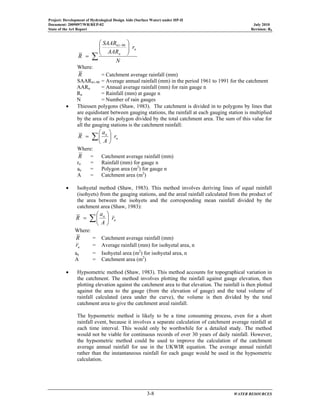
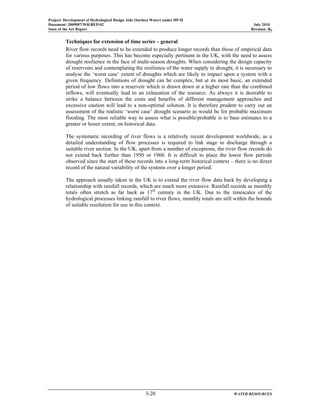
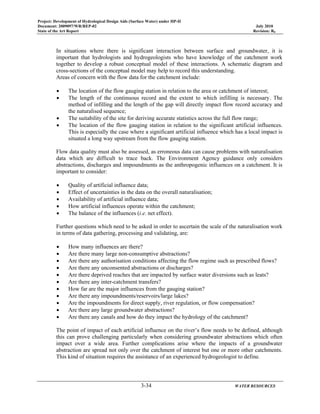
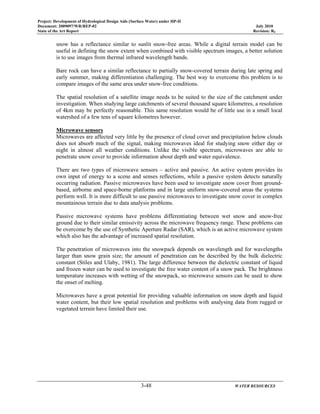
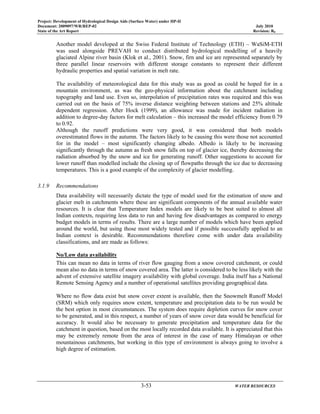
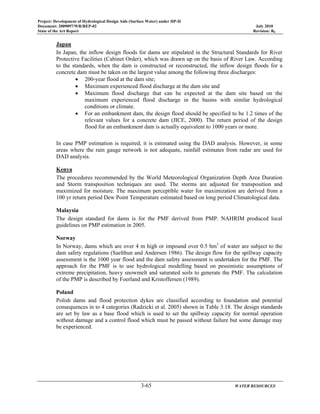
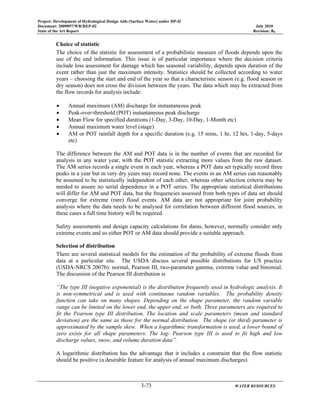
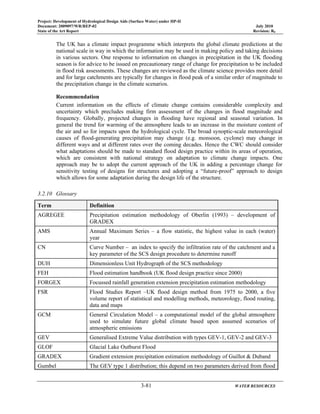
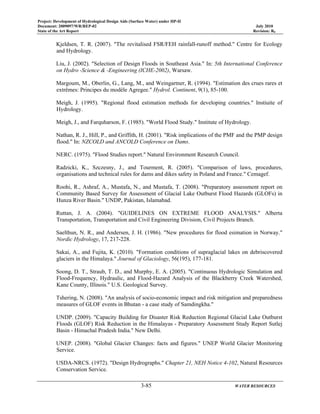
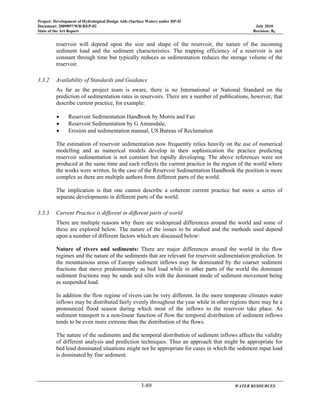
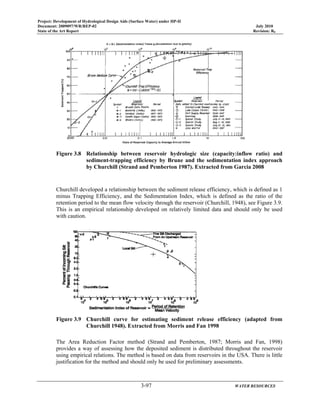
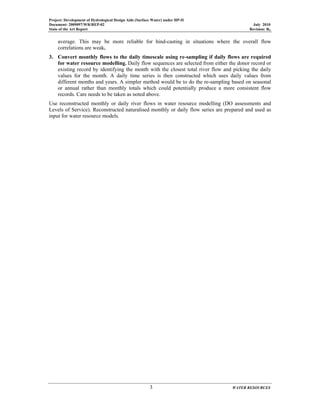
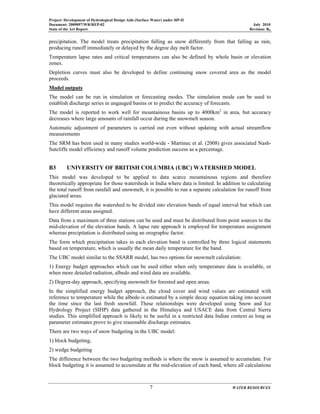
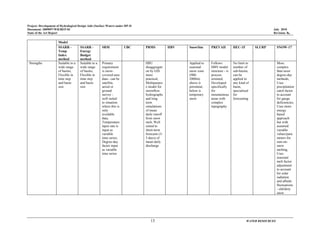
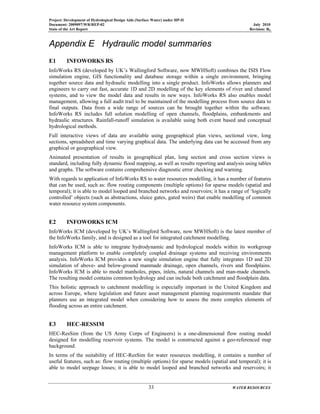
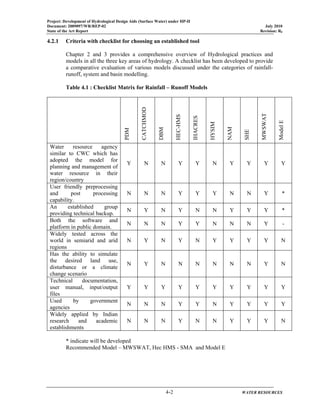
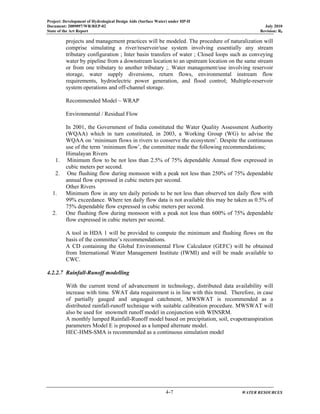
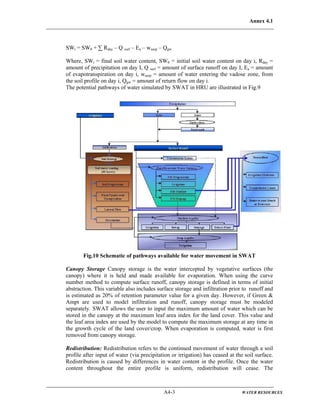
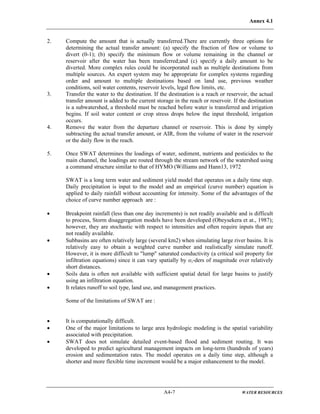
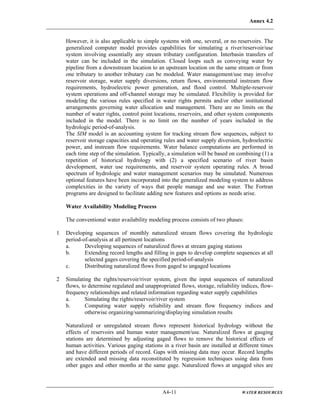
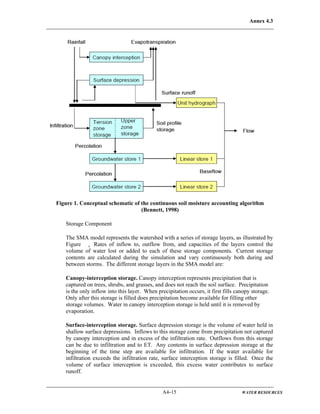
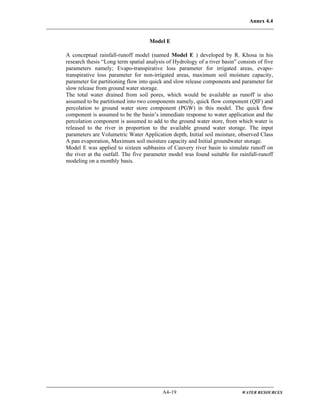
cases, most of the discharge is surface runoff from the top tank and there is little or no
runoff from the second tank. If heavy precipitation occurs over a longer period, the water
in the top tank will run off quickly and then, the output from the second tank will
decrease slowly, forming the typical downward slope of the hydro graph following a
large discharge. However, 4×4 tank model has been developed for non-humid basins by
dividing them into four zones depending on soil moisture content. Tank model for daily
runoff analysis can also be used with snowmelt component.
The tank model can represent many types of hydrograph because of its non-linear
structure caused by setting the side outlets somewhat above the bottom of each tank
(except for the lowest tank). The concept of initial loss of precipitation is not necessary,
because its effect is included in the nonlinear structure of the tank model.
ii) Initial Tank Model Parameters:
Decreasing ratio α is calculated as 1/TC, where TC is a rough estimation of time
constant of runoff, made from recession slope of the flow hydrographs. From the value of
α , the discharge coefficients and initial losses are calculated for top tank, second tank
and third tank using following equations:
A0 = A1 = A2 = …. = α /2 [A0, A1, A2 are discharge coefficients]
B0 = B1 = α /10 [B0, B1 are discharge coefficients]
C0 = C1 = α /50 [C0, C1 are discharge coefficients]
The values of initial losses are selected from the following ranges.
HA1 = 0 ~ 15 (mm), HA2 = 15 ~ 40 (mm)
HA3 = 40 ~ 60 (mm), HB = 5 ~ 15 (mm)
HC = 5 ~ 15 (mm)
Where HA1, HA2 are heads (threshold levels) of two side outlets of top tank and are
measures of initial losses. Similarly, HB and HC are heads (threshold levels) of side
outlets of second and third tanks respectively.
iii) Calibration of Tank Model Parameters:
The only difficult problem is the calibration of the model, partly because of its nonlinear
structure and partly because its structure is very difficult for input/output analysis. In this
report, calibration of the parameter has been performed by trial and error. However,
Sugawara (1979) developed autocalibration technique to resolve this problem.
iv). Snow melt component of Tank Model:
In winter, snow begins to deposit on high elevation area and then spreads to lower areas.
In spring, the snow deposit begins to melt first in low elevation areas and then moves up
the elevation range of the basin. Therefore, it is necessary to divide the basin into
elevation zones in order to calculate snow deposit and melt. The number of zones need
not be too large; usually, it is sufficient to divide the basin into a few zones with equal
elevation interval. Snow deposit and melt are governed by air temperature, and so the rate
of temperature decrease with elevation is one of the most important factors in the snow
model.
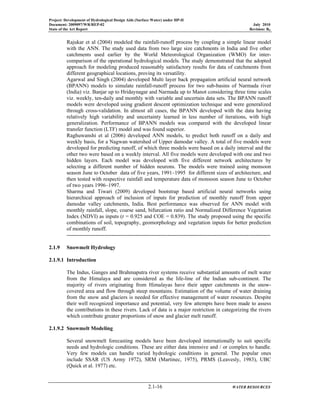
v). Tank Model for non-humid/arid condition (Indian scenario):
As discussed above, 4×4 tank model has been developed for non-humid basins.
Following additional points have been considered for this case.
(i) different values of primary and secondary soil moisture may be considered for each
zone depending on the situation.
(ii) Aerial ratio of zone S1:S2:S3:S4 is an important parameter in this model. These
ratios can be determined from drainage area, topography, landuse and soil structure of the
basin.](https://image.slidesharecdn.com/sar-150729075444-lva1-app6891/85/Central-Water-Commission-Ministry-Of-Water-Resources-Govt-of-India-129-320.jpg)
![Annex 2-10
WATER RESOURCESA2.1-32
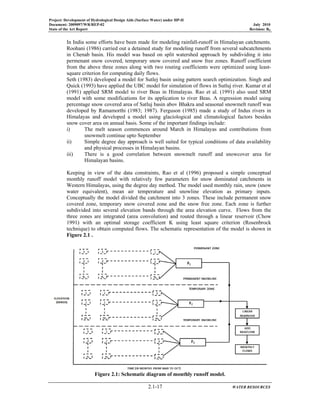
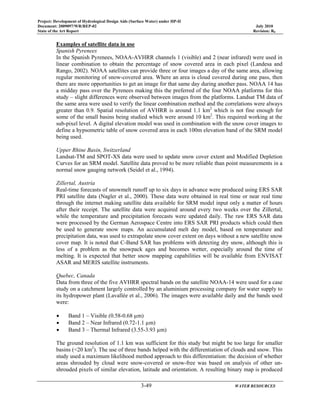
Lumped Basin scale Water Balance Model
A lumped basin-scale water balance model (named KREC v.2 ) based on Thornthwaite-
Mather water balance accounting procedure (Dunne & Leopold, 1978) was developed by
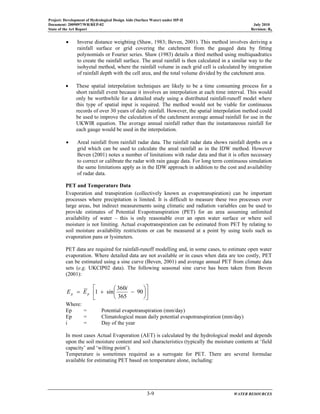
Nandagiri (2002). The model utilizes inputs of rainfall and potential evapotranspiration
and gives continous output of direct runoff, subsurface runoff, groundwater recharge,
baseflow, actual evapotranspiration and total runoff. The model has three unknown
parameters: S, awc, and blag, which need to be determined by calibration with measured
streamflow data. While CN (Curve Number), based on land use/land cover, hydrological
soil type and antecedent wetness conditions, can be readily obtained from standard tables
published in the literature, awc (available water capacity of the soil profile calculated as
the difference in profile water storage at field capacity and permanent wilting point) may
be derived from published data on soil hydraulic properties for various soil textural types.
The parameter blag was estimated using relationships presented by Ram Mohan & Nair
(1984) using information on basin slope, soil type and extent and type of forest cover
The algorithm of the model is given below:
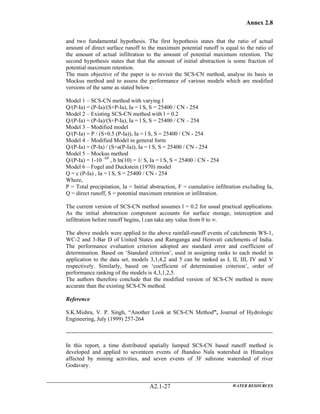
1. Direct Runoff from precipitation is computed using SCS-CN approach ( for Indian
conditions) as :
( )
)7.0(
3.0
2
SP
SP
DR
+
−
= when P = 0.3 S
= 0 otherwise
Where, DR = Direct Runoff, P = Precipitation, S = maximum possible Retention
2. Evaporation is computed as the difference between precipitation and direct Runoff :
DRPEP −=
3. APWL= ∑( EP- PET) for EP<PET
APWL= 0 EP > PET
4. Soil Moisture Content (ST) is given by
( )
0APWLfor ≠×=
−
awc
APWL
eawcST
( )[ ]{ } 0APWLfor,min 1 =+−= − awcSTPETEPST t
Where:
ST = Soil Moisture Storage
awc = available water capacity
PET = Potential Evapotransipiration
STt-1 = Soil moisture storage at time t -1
5. Actual Evapotranspiration (AET) is computed using the following equations:
AET = PET for EP > PET
= EP + DST for EP < PET
Where, AET = Actual Evapotranspiration
PET = Potential Evapotranspiration
DST = Direct Canopy Storage
6. Ground Water Recharge (GWR) :
( )
otherwise0
awcSTfor1
=
=−+−= − awcSTPETEPGWR t
7. Base flow (BF) :
BF = (1-blag)(TAR + GWR)](https://image.slidesharecdn.com/sar-150729075444-lva1-app6891/85/Central-Water-Commission-Ministry-Of-Water-Resources-Govt-of-India-131-320.jpg)
![Project: Development of Hydrological Design Aids (Surface Water) under HP-II
Document: 2009097/WR/REP-02 July 2010
State of the Art Report Revision: R0
Annexure 2.2-2
A2.2‐2
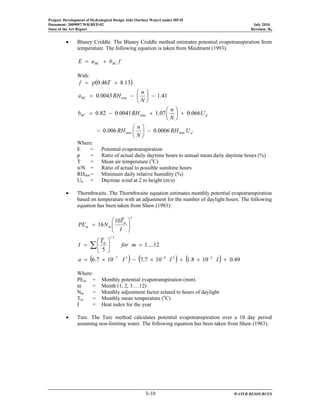
1 FLOOD FORMULAE
1.1 Commonly used Formulae
1. Dicken’s Q = C. A 3/4
Where, Q = discharge m3
/s
A = Area in sq.km
C = 6 for North-Indian Plains
= 11-14 North-Indian Plains
= 14-28 Central India
= 22–28 Coastal Andhra & Orisa
Also there is UPIRI Formulae to find C (Developed by Irrigation
Research Institute, Roorkee based on frequency studies on Himalayan
Rivers)
C =2.342 log (0.6T) X log (1185/P) + 4
Where P = [(a+b)/(A+a)] X 100
a = perpetual snow area(sq.km)
A+a = Total catchment area (sq.km)
2. Ryve’s Q = C. A 2/3
Where, Q = discharge m3
/s
A = Area in sq.km
C = 6.8 for areas within 80 km from east coast
= 8.3 for areas 80-2400 km from coast
= 10.2 limited areas near hills
3. Graig Q = 10 c.v. I x ln (4.97 L)
Where, C = Coefficient of discharge
V = Velocity in m/sec
I = rainfall in cm
C = 0.12 to 0.18](https://image.slidesharecdn.com/sar-150729075444-lva1-app6891/85/Central-Water-Commission-Ministry-Of-Water-Resources-Govt-of-India-138-320.jpg)

![Project: Development of Hydrological Design Aids (Surface Water) under HP-II
Document: 2009097/WR/REP-02 July 2010
State of the Art Report Revision: R0
Annexure 2.2-3
A2.2‐8
Sl
Probability
distribution
Probability density function(pdf) and cumulative
distribution function (cdf)
Parameters of
the distribution
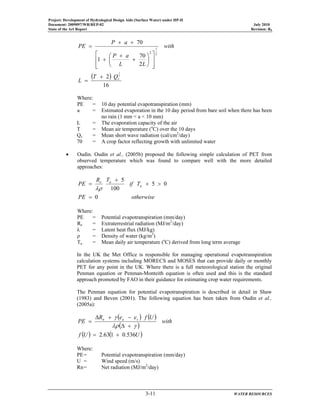
4. Log Normal
The pdf of a LN2 distribution is given by
[ ]
⎪⎭
⎪
⎬
⎫
⎪⎩
⎪
⎨
⎧ −−
=
y
y
y
x
x
xf
σ
μ
πσ 2
log
exp
2
1
)(
2
The normally distributed variable becomes log(x-a)
with the pdf of LN 3 distribution
( )
( )[
⎪⎩
⎪
⎨
⎧
−−−
−
= 2
log
2
1
exp
2
1
)(
yy
ax
ax
xf μ
σπσ
µy and σy are the
mean and
standard
deviation of the
natural
logarithms of x.
µy and σy are the
location and
scale parameters
of
5.
Normal
The pdf of Normal distribution is given by
( )2
2
2
1
2
1
)(
μ
σ
πσ
−−
=
x
exf
The variable x can take any value in the range (-∞,
+∞).
The CDF of this distribution is:
∫∞− ⎥
⎥
⎦
⎤
⎢
⎢
⎣
⎡
⎟
⎠
⎞
⎜
⎝
⎛ −
−=
x
x
xF
2
2
1
exp
2
1
)(
σ
μ
πσ
µ and σ are the
location and
scale parameters
of the
distribution.
6. Gumbel
The probability density function (pdf) of this
distribution:
⎥
⎥
⎦
⎤
⎢
⎢
⎣
⎡
−⎟
⎠
⎞
⎜
⎝
⎛ −
−=
⎟
⎠
⎞
⎜
⎝
⎛ −
−
α
αα
ux
e
ux
xf exp
1
)(
The variable x takes values in the
range <∝∝<− x . The distribution function of x is
⎥
⎥
⎦
⎤
⎢
⎢
⎣
⎡
−=
⎟
⎠
⎞
⎜
⎝
⎛ −
−
α
βx
exF exp)(](https://image.slidesharecdn.com/sar-150729075444-lva1-app6891/85/Central-Water-Commission-Ministry-Of-Water-Resources-Govt-of-India-144-320.jpg)
![Project: Development of Hydrological Design Aids (Surface Water) under HP-II
Document: 2009097/WR/REP-02 July 2010
State of the Art Report Revision: R0
Annexure 2.2-3
A2.2‐11
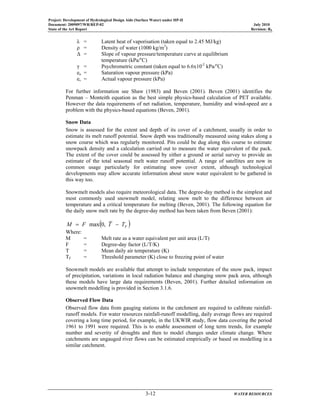
weighted moments (PWMs) of Greenwood et al. (1979). Probability weighted moments are
defined as:
Which can be rewritten as:
Where F= F (x) is the cumulative distribution function (CDF) for x, x(F) is the inverse CDF of x
evaluated at the probability F, and r = 0, 1, 2, …, is a nonnegative integer. When r = 0, β0 is equal
to the mean of the distribution π = E [x].
For any distribution the rth
L-moment λ0 is related to the rth
PWM (Hosking, 1990) through
For example, the first four L-moments are related to the PWMs using:
λ1= β0
λ2= 2β1- β0
λ3= 6β2- 6β1+β0
λ4= 20β3- 30β2+12β1+β0
Hosking (1990) defined L-moment ratios as:
L-coefficient of variation, L-CV (τ2) = λ2/ λ1
L-coefficient of skewness, L-skew (τ3) = λ3/ λ2
L-coefficient of kurtosis, L- kurtosis (τ4) = λ4/ λ2
Zafirakou- Koulouris et al. (1998) mention that like ordinary product moments, L-moments
summarize the characteristics or shapes of theoretical probability distributions and observed
samples. Both moment types offer measures of distributional location (mean), scale (variance),
skewness (shape), and kurtosis (peakedness). The authors further mention that L-moments offer
significant advantages over ordinary product moments, especially for environmental data sets,
because of the following:
• L-moment ratio estimators of location, scale and shape are nearly unbiased, regardless of the
probability distribution from which the observation arise (Hosking, 1990).
• L-moment ratio estimators suh as L-Cv L-skewness, and L-kurtosis can exibit lower bias than
conventional product moment ratios, especially for high skewed samples.
• The L-moment ratio estimators of L-Cv L-skewness do not have bounds which depend on
sample size as do the ordinary product moment ratio estimators of Cv and skewness.
• L-moment estimators are linear combinations of the observations and thus are less sensitive
to the largest observations in a sample then product moment estimators, which square or cube
the observations
• L- moment ratio diagrams are particularly good at identifying the dicributional properties of
highly skewed data, whereas ordinary product moment diagrams are almost useless for this
task (Vogel and Fennessey, 1993).](https://image.slidesharecdn.com/sar-150729075444-lva1-app6891/85/Central-Water-Commission-Ministry-Of-Water-Resources-Govt-of-India-147-320.jpg)
![Project: Development of Hydrological Design Aids (Surface Water) under HP-II
Document: 2009097/WR/REP-02 July 2010
State of the Art Report Revision: R0
Annexure 2.2-3
A2.2‐13
3. Cramer Von Mises (CvM)
The test derives from Kolmogorov statistics and its applicability rules are based on Kolmogorov
theorem. The Cramer-von Mises test is an EDF omnibus test for the composite hypothesis of
normality. The test statistic is
W = frac{1}{12 n} + sum_{i=1}^{n} (p_{(i)} - frac{2i-1}{2n}),
Where, p_{(i)} = Phi([x_{(i)} - overline{x}]/s).
Here, Phi is the cumulative distribution function of the standard normal distribution, and
overline{x} and s are mean and standard deviation of the data values. The p-value is computed
from the modified statistic Z=W (1.0 + 0.5/n) according to Table 4.9 in Stephens (1986).
4. Anderson-Darling Criterion (ADC)
The Anderson-Darling criterion has the form (see Laio et al., 2008; Di Baldassarre et al., 2008):
if 1:2_j _ _AD;j , where _AD;j is the discrepancy measure characterizing the criterion, the
Anderson-Darling statistic:
and _j , _j and _j are distribution-dependent coe_cients that are tabled by Laio (2004, Tables 3
and 5) for a set of seven distributions commonly employed for the frequency analysis of extreme
events. In practice, after the computation of the ADCj , for all of the operating models, one
selects the model with the minimum ADC value, ADCmin.
The above model selection technique has been developed by Alberto Viglione and presented in
his paper Model selection techniques for the frequency analysis of hydrological extremes in 2008.
This appears to be an important study which will assist in verifying whether AIC and BIC work
correctly when they are applied for identifying probability distributions of hydrological extremes
ie., when the available samples are small and the parent distribution is highly asymmetric and
additional model selection criteria based on ADC goodness of fit test statistic has also been
proposed and the performance of the three models are compared and found very highly
promising. These methods will also be attempted while preparing hydrological aids.](https://image.slidesharecdn.com/sar-150729075444-lva1-app6891/85/Central-Water-Commission-Ministry-Of-Water-Resources-Govt-of-India-149-320.jpg)


![Project: Development of Hydrological Design Aids (Surface Water) under HP-II
Document: 2009097/WR/REP-02 July 2010
State of the Art Report Revision: R0
Annexure 2.2-4
A2.2‐29
of a wave, inflow always exceeds outflow thus producing a wedge of storage called ‘wedge
storage’ and during the recession outflow exceeds inflow resulting in a negative wedge storage.
The storage beneath a line parallel to the stream bed is called ‘prism storage’; between this line
and the actual profile, ‘wedge storage’. During rising stages a considerable volume of wedge
storage may exist before any large increase in outflow occurs. During falling stages inflow drops
more rapidly than outflow and the wedge-storage volume becomes negative. Routing in streams
requires a storage relationship which adequately represents the wedge storage. This is usually
done by including inflow as a parameter in the storage equation.
i. Muskingum Method
McCarthy of the United States Corps of Engineers developed what is known as the Muskingum
Method, for use in studies for the Muskingum flood control project in 1934-35. The method
involves the concept of wedge and prism storage’s. The prism storage is represented as KO where
K known as the ‘storage constant’ is the ratio of storage to discharge and has the dimension of
time. The wedge storage is represented as K X(I-O) where X is a parameter, which expresses the
relative importance (weightage) of inflow and outflow in determining storage.
The total storage is
S=KO+KX(I-O)=K[XI+(1-X)O]
which is known as the Muskingum equation.
The constant X expresses the relative importance of inflow & outflow in determining storage. If
storage is entirely a function of outflow, as in a reservoir, then X=0; but if the wedge storage is
significant, then X will be greater than Zero, with a limiting value of 0.5 when inflow and outflow
have equal weight as in uniform channels. For most streams, X is between 0 and 0.3 with a mean
value near 0.2.
The storage constant K which expresses the ratio between storage and discharge, in fact is a
measure of the lag or travel time through the reach and is the slope of the storage-discharge curve.
K may be determined by finding the lag, or time interval, between the occurrences of the centre
of mass of inflow and centre of mass of outflow over the reach. It may also be approximated by
determining the time of travel of critical points on the hydrograph, such as the peak. The
Muskingum equation may be rewritten as,
S2-S1 = K[X(I2 – I1) + (1 – X) (O2 – O1)]
Where the subscripts 1, 2 indicate the routing periods and I, O and S are instantaneous values of
inflow, outflow and storage respectively at the beginning of the routing periods indicated. The
basic equation for change in storage in a time interval t is
( )12
2121
22
SSt
OO
t
II
−=⎟
⎠
⎞
⎜
⎝
⎛ +
−⎟
⎠
⎞
⎜
⎝
⎛ +
Combining the equations and simplifying we get,
O2 = C1I + C2I1 + C2I1 + C3O1](https://image.slidesharecdn.com/sar-150729075444-lva1-app6891/85/Central-Water-Commission-Ministry-Of-Water-Resources-Govt-of-India-165-320.jpg)
![Project: Development of Hydrological Design Aids (Surface Water) under HP-II
Document: 2009097/WR/REP-02 July 2010
State of the Art Report Revision: R0
Annexure 2.2-5
A2.2‐33
Where, ui = vector of L-moment ratios for station i.
K= covariance matrix of ui,
−
u = mean of vector ui.
The station i is declared to be discordant, if Di is greater than the critical value of the discordance
statistic given in a tabular form by [Hosking and Wallis, 1993].
Homogeneity of the region to be tested using the L–moments based heterogeneity measure,
H. For computing the heterogeneity measure H, 500 simulations we perform using the four
parameter Kappa distribution.
Hence, heterogeneity measure is obtained as:
( )
v
vV
H
σ
μ−
=
Where, V = weighted standard deviation of L-coefficient of variation values,
μV, σV = the mean and standard deviation of number of simulations of V.
The criteria for deciding heterogeneity of a region is as:
if H < 1, region is acceptably homogeneous,
if 1 ≤ H < 2, region is possibly heterogeneous,
if H ≥ 2, region is definitely heterogeneous.
perform a comparative regional flood frequency analysis studies using the L–moments based
frequency distributions: viz. Extreme value, General extreme value, Logistic, Generalized
logistic, Normal, Generalized normal, Uniform, Pearson Type–III, Exponential, Generalized
Pareto, Kappa, and five parameter statistic criteria, the GEV distribution was identified as the
robust distribution for the study area. For estimation of floods of various return periods for
gauged watersheds of the study area, a regional flood formula was developed using the L–
moments based GEV distribution.
The L–moment ratio diagram and | Zi
dist
| _statistic are used as the best fit criteria for
identifying the regional distribution.
For estimation of floods of desired return periods for ungauged watersheds, a regional flood
formula was developed by coupling the regional flood formula with the regional relationship
between mean annual peak flood and watershed area.
This practice is prevalent in Sone subzone region 1(d) and North Brahmaputra region of India by
R. Kumar and C. Chatterjee in 2003 and 2005.
1.5 Determining Homogeneous Regions
Present practice of determining homogeneity of basins in India is a two step method as under
1. To determine ratio of 10 yr flood to mean annual flood (Which has a return period of 2.33
years) from the frequency curve of each station. Averaging of ratios for a number of
stations in the region to obtain mean 10 yr ratio for the region
2. The return period corresponding to mean annual flood times the mean 10 yr ratio is
determined from frequency curve of each station and plotted against the number of years](https://image.slidesharecdn.com/sar-150729075444-lva1-app6891/85/Central-Water-Commission-Ministry-Of-Water-Resources-Govt-of-India-169-320.jpg)


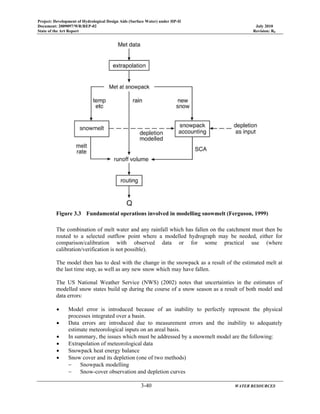
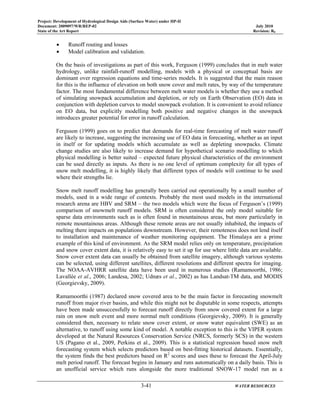


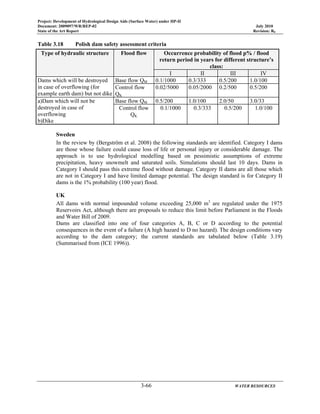
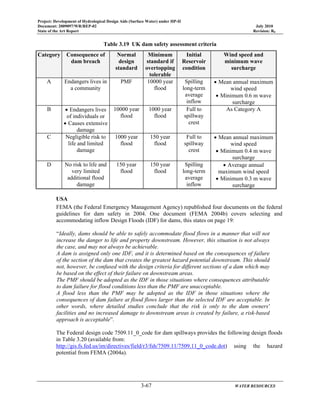
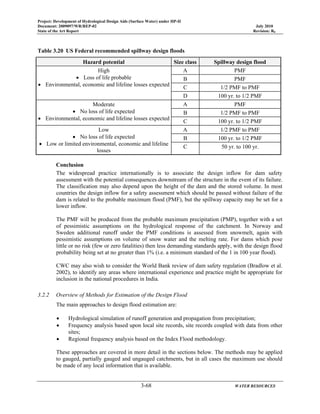


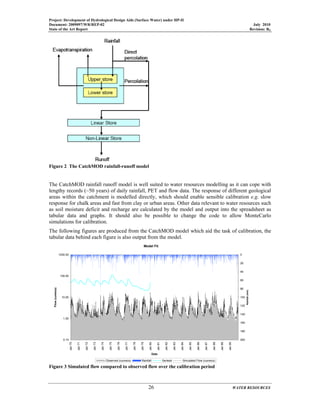


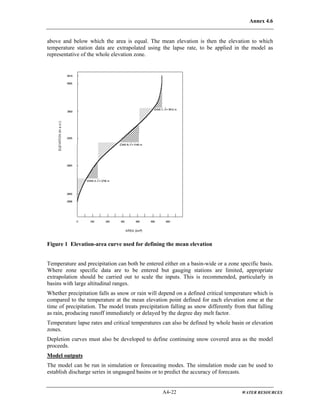

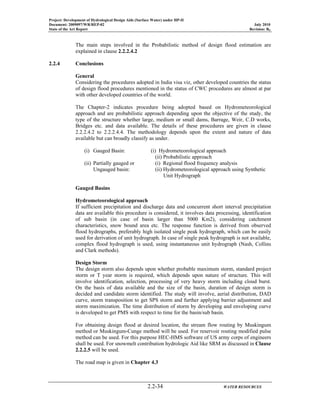
This document provides a state of the art report on hydrological design practices in India. It summarizes prevalent design criteria and practices for assessing water resources potential, estimating design floods, and estimating sedimentation rates. It discusses approaches and models used internationally and in India. It also proposes improved hydrological design practices for India, including recommended procedures and models for developing hydrological design aids for water resources planning and management.


