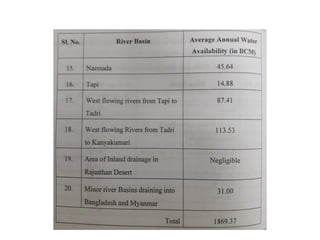
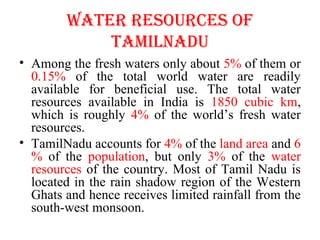
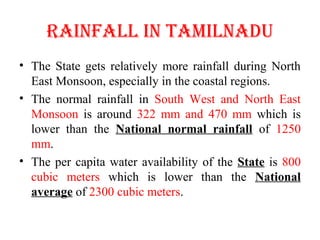
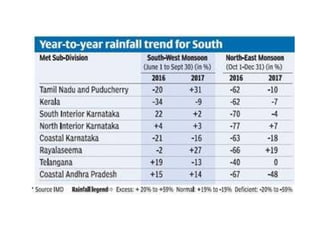
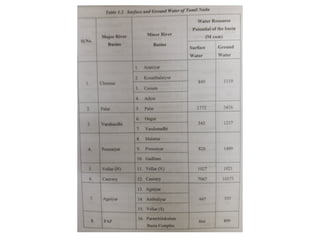
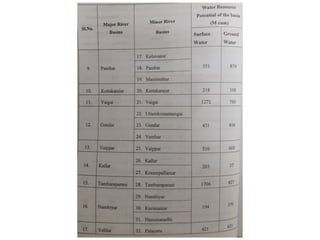
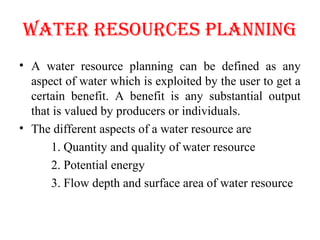
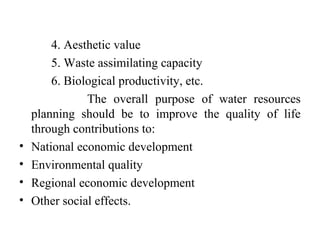
Water Resources Survey, Resources in India and TamilNadu, WaterResources Planning, Estimation of Water for Irrigation and Drinking, Reservoirs, Strategies for reservoir operation, Design Flood and Levees and Flood walls
Introduction to IEEE STANDARDS and its different types.pptx
Water resources
1. UNIT 1
WATER RESOURCES
Prepared by
M.MANOHARAN
Assistant Professor
Department of Civil Engineering
Rajalakshmi Engineering College
2. CONTENTS
• Water resources survey
• Water resources of India and Tamilnadu
• Description of water resources planning
• Estimation of water requirements for irrigation
and drinking
• Single and multipurpose reservoir
• Fixation of Storage capacity
• Strategies for reservoir operation
• Design flood
• Levees and flood walls
3. WATER RESOURCES SURvEy
• All Water Resources projects have to be cost evaluated.
This is an essential part of planning.
• Since, generally, such projects would be funded by the
respective State Governments, in which the project would
be coming up, it would be helpful for the State planners to
collect the desired amount of money, like by issuing bonds
to the public, taking loans from a bank, etc.
• Since a project involves money, it is essential that the
minimum amount is spent, under the given constraints of
project construction.
4. • Hence, a few feasible alternatives for a project are usually
worked out. For example, a project involving a storage dam
has to be located on a map of the river valley at more than
one possible location, if the terrain permits.
• In this instance, the dam would generally be located at the
narrowest part of the river valley to reduce cost of dam
construction, but also a couple of more alternatives would
be selected since there would be other features of a dam
whose cost would dictate the total cost of the project.
• For example, the foundation could be weak for the first
alternative and consequently require costly found treatment,
raising thereby the total project cost.
5. ANNUAL COST
• The investment for a project is done in the
initial years during construction and then on
operation and maintenance during the project's
lifetime. The initial cost may be met by certain
sources like borrowing, etc. but has to be
repaid over a certain number of years, usually
with an interest, to the lender.
6. • This is called the Annual Recovery Cost,
which, together with the yearly maintenance
cost would give the total Annual Costs. It must
be noted that there are many non - tangible
costs, which arise due to the effect of the
project on the environment that has to be
quantified properly and included in the annual
costs.
7.
8. WATER RESOURCES OF INDIA AND
TAMILNADU
The following are the major river basins of our
country:
– Indus
– Ganges
– Brahmaputra
– Krishna
– Godavari
– Mahanadi
– Sabarmati
10. WATER SUppLy AND DEMAND GAp
• The estimated water gap for India by 2030 is
an alarming 50 %.
• The country is also facing the climate change,
which may complex implications on the
availability of water resources including
Changes in pattern and intensity of rainfall
Glacial melt resulting in altered river flows
Changes in ground water recharge
More intense floods
11. Severe droughts in many parts of the country
Salt water intrusion in coastal aquifers
A number of water quality issues
12. ENvIRONMENTAL ChALLENGES
These environmental challenges may be
classified into four broad approaches:
1.Improving efficiencies and minimizing losses.
2.Recharging groundwater aquifers.
3.Abatement and treatment of water pollution.
4.Reuse and recycling of wastewater.
13. SOURCES OF FRESh WATER
• Surface water potential
1. The average annual surface water flows in India has
been estimated as 1869 BCM.
2. This is the utilizable surface water potential in India.
3. But the amount of water that can be actually put to
beneficial use is much less due to severe limitations
posed by Physiography, topography, inter-state issues
and the present state of technology to harness water
resources economically.
14.
15. 4. The recent estimates made by the Central Water
Commission, indicate that the water resources is
utilizable through construction of structures is about
690 cubic km (about 36% of the total).
5. Monsoon rain is the main source of fresh water with
76% of the rainfall occurring between June and
September under the influence of the southwest
monsoon.
6. The average annual precipitation in volumetric terms
is 4000 cubic km.
7. The average annual surface flow out of this is 1869
cubic km, the rest being lost in infiltration and
evaporation.
16. • Ground water potential
1. The potential of dynamic or rechargeable ground
water resources of our country has been estimated by
the Central Ground Water Board to be about 432
cubic km.
2. Ground water recharge is principally governed by
the intensity of rainfall as also the soil and aquifer
conditions.
3. This is a dynamic resource and is replenished every
year from natural precipitation, seepage from surface
water bodies and conveyance systems return flow
from irrigation water, etc.
17.
18. vARIATIONS IN RAINFALL
• The average annual rainfall varies from about 1000
cm in North Eastern region to less than 10cm in
Western part of Rajasthan.
• In India, the rainfall mostly occurs during the
monsoon and a few spells of intense rainfall.
• It has been estimated that the lower rainfall zone of
about less than 750 mm annual rainfall accounts for
33% of net sown area.
19. • Medium Rainfall zone = 750-1125 mm (35%)
• High rainfall zone = 1125 – 2000mm (24%)
• Very High zone = >2000 mm (8%)
• Replenish able ground water has estimated to be
about 433 BCM.
20. OvERALL WATER AvAILAbILITy
• After accounting for the losses due to evaporation,
the total average annual water availability for the
country has been estimated to be 1869 BCM.
• Due to hydrological and topographical constraints,
the utilizable water works out to be as 1123 BCM.
• Out of which, 690 BCM is surface water and 433
BCM is through replenish able ground water.
• Ganga-Brahmaputra river basin contributes to
about 60% of the total annual water availability.
21.
22.
23. WATER RESOURCES OF
TAMILNADU
• Among the fresh waters only about 5% of them or
0.15% of the total world water are readily
available for beneficial use. The total water
resources available in India is 1850 cubic km,
which is roughly 4% of the world’s fresh water
resources.
• TamilNadu accounts for 4% of the land area and 6
% of the population, but only 3% of the water
resources of the country. Most of Tamil Nadu is
located in the rain shadow region of the Western
Ghats and hence receives limited rainfall from the
south-west monsoon.
24. RAINFALL IN TAMILNADU
• The State gets relatively more rainfall during North
East Monsoon, especially in the coastal regions.
• The normal rainfall in South West and North East
Monsoon is around 322 mm and 470 mm which is
lower than the National normal rainfall of 1250
mm.
• The per capita water availability of the State is 800
cubic meters which is lower than the National
average of 2300 cubic meters.
25.
26.
27.
28. WATER RESOURCES PLANNINg
• A water resource planning can be defined as any
aspect of water which is exploited by the user to get a
certain benefit. A benefit is any substantial output
that is valued by producers or individuals.
• The different aspects of a water resource are
1. Quantity and quality of water resource
2. Potential energy
3. Flow depth and surface area of water resource
29. 4. Aesthetic value
5. Waste assimilating capacity
6. Biological productivity, etc.
The overall purpose of water resources
planning should be to improve the quality of life
through contributions to:
• National economic development
• Environmental quality
• Regional economic development
• Other social effects.
31. ChARACTERISTICS OF WR PLANNINg
1. Water resource systems mostly have multiple
objectives.
2. The technical aspects of the problem provide the
foundations, institutional, social and other
considerations which are also important.
3. The projects have a significant influence on society
and regional economy.
32. STAgES IN WATER RESOURCES
PLANNINg
The levels of planning associated with
three different areas of geographic extent:
• National
• Regional or River Basin
• Local areas
34. Based on the sequence of the planning
process, the life cycle of a project can be divided into
three phases:
1. Planning phase
2. Construction phase
3. Operation phase
In the above three phases, the planning
phase which can be categorized into five stages:
STAGE-1: Project Initiation stage
STAGE-2: Data collection stage
STAGE-3: Project configuration stage
STAGE-4: Detailed planning stage
STAGE-5: Design stage
35. DESCRIPTION OF WATER
RESOURCES PLANNINg
Water resources development and
management will have to be planned for a
hydrological unit such as a drainage basin as a whole
or a sub-basin. Apart from traditional methods, non-
conventional methods for utilization of water should
be considered, like
–Inter-basin transfer
–Artificial recharge of ground water
–Desalination of brackish sea water
–Roof-top rain water harvesting
36.
37.
38. ESTIMATION OF WATER
REQUIREMENTS FOR IRRIgATION
AND DRINKINg
• The primary objective of irrigation is to provide plants with
sufficient water to obtain optimum yields and a high quality
harvested product.
• The required timing and amount of applied water is
determined by the prevailing climatic conditions, the crop
and its stage of growth, soil properties (such as water
holding capacity), and the extent of root development.
• Water within the crop root zone is the source of water for
crop evapo-transpiration.
39. • Thus, it is important to consider the field water balance to
determine the irrigation water requirements.
• Plant roots require moisture and oxygen to live.
• Where either is out of balance, root functions are slowed
and crop growth reduced.
• All crops have critical growth periods when even small
moisture stress can significantly impact crop yields and
quality.
• Critical water needs periods vary crop by crop.
• Soil moisture during the critical water periods should be
maintained at sufficient levels to ensure the plant does not
stress from lack of water.
40. CALCULATION OF IRRIgATION
WATER REQUIREMENTS
• Delineation of major irrigation cropping pattern
zones.
• These zones are considered homogeneous in terms of
types of irrigated crops grown, crop calendar,
cropping intensity and gross irrigation efficiency.
• Combination of the irrigation cropping pattern zones
with the climate stations zones (in GIS) to obtain
basic mapping units.
• Calculation of net and gross irrigation water
requirements for different scenarios.
• Comparison with existing data and final adjustment.
41. SOIL WATER bALANCE
• For design and management purposes, the
field water balance can be written
mathematically as:
Fg = E Tc + Dp + RO – P – GW + SDL – ΔSW
Where,
Fg = gross irrigation required during the period
ETc = amount of crop evapotranspiration
during the period
42. Dp = Deep percolation from the crop root zone
during the period
RO = surface runoff that leaves the field during
the period
P = Total precipitation during the period
GW = ground water contribution to the crop root
zone during the period
SDL = spray and drift losses from irrigation water
in air and evaporation off of plant canopies
ΔSW = Change in soil water in the crop root zone
during the period
43.
44. In addition to that, the following are the
additional data to include while calculating:
1.Crop Water Use
2.Climatic Relationships and Data
3.Reference Crop Evapotranspiration
4.Crop Coefficients
5.Significance of Salinity
6.Auxiliary Irrigation Water Requirements
7.Effective Precipitation
8.Irrigation Efficiencies
45. DRINKING WATER REQUIREMENTS
• An average person consumes not more than 3 to 6
litres of liquid in the form of water, milk and other
beverages. The per capita consumption of water
drawn from public supply is large.
• Total water requirements may be divided into the
following five categories:
Residential or domestic use
Institutional use
Public use
Industrial use
Water system losses
46. WATER QUANTITy ESTIMATIoN
Estimation of Water Quantity = Per capita demand *
Population
The quantity of water required for
municipal uses for which the water supply schemes to
be designed for following data:
•Water consumption rate
•Population to be served
48. pER cApITA DEMAND
The amount of water required per person
per day which includes domestic, industrial and
commercial consumptions.
Per capita demand = Consumption of water in litres per
day / Total Population
From Indian Standards, the value of water
supply given as 150 to 200 litres per head per day
reduced to 135 litres per head per day for domestic
consumption depending upon prevailing conditions.
49. fAcToRS AffEcTING pER cApITA
DEMAND
The following are some of the factors that
affects per capita demand;
Size of the city
Quality of water
Efficiency of water works administration
Policy of metering and charging method
Presence of industries
Climatic conditions
Habits of people and their economic status
Pressure in the distribution system
Cost of water
50. VARIATIoNS IN RATE of DEMAND
If this average demand is supplied at all the
times, it will not be sufficient to meet the variations.
Avg. Daily per capita demand = Qty. reqd. in 12 months
/ (365 x Population)
1.Seasonal variation
2.Daily variation
3.Hourly variation
51. popUlATIoN foREcAST
The various methods adopted for
estimating future populations are given below:
1.Arithmetical increase method
2.Geometric increase method
3.Incremental increase method
4.Decreasing rate of growth method
5.Simple graphical method
6.Comparative graphical method
7.Ratio method
8.Logistic curve method
53. RESERVoIRS
A reservoir usually means an enlarged
natural or artificial lake, storage pond or impoundment
created using a dam to store water. Most reservoirs are
formed by constructing dams across rivers.
A reservoir can also be formed from a
natural lake whose outlet has to control the water level.
The dam controls the amount of water that flows out of
the reservoir.
54.
55. During droughts or dry periods, the water
level in a river may very low. During that conditions,
more water is released from the reservoir so that water
may use in agriculture, irrigation, residential purpose,
etc.
Reservoirs also serve for other purposes
like to generate electricity, water supply, boating,
fishing and other forms of recreation.
56. DAM
A dam can be termed as a man-made
barrier that is placed in between a flowing river
to use that water in desired manner, such as
preventing excess flow in specific regions and
making it flow to regions where there is a deficit
of water.
57.
58. clASSIfIcATIoN of RESERVoIRS
The main function of reservoirs is to
provide the storage for water and some of the purposes
are
1.Irrigation
2.Generation of hydroelectric power
3.Public and industrial water supply
4.Low water regulation for navigation and recreation.
59. Depending upon the purpose served, reservoirs are
broadly classified in two categories:
•Single purpose reservoirs
For single purpose like conservation or
flood control. It is further classified as
1. Retarding reservoir
2. Detention reservoir
•Multi-purpose reservoirs
To serve more than one of the basic
purposes such as irrigation, water supply, hydroelectric
power, flood control, navigation, recreation and wild
life conservation.
Note: Single is not multiple.
60. fIxATIoN of SToRAGE cApAcITy
Reservoir storage generally consists
of three parts as follows:
Inactive storage including dead storage
Active or conservation storage
Flood and surcharge storage
61. TERMS IN SToRAGE cApAcITy of
RESERVoIRS
The storage capacity of reservoirs can be
classified into different parts or levels;
Full Reservoir Level – Level corresponding to the
storage.
Sediment Yield – Total quantity of sediment brought
in a year to a reservoir.
Trap Efficiency – ratio of total deposited sediment in
the reservoir to the total sediment inflow in a year.
62. Minimum Draw-Down Level (MDDL) –
Level up to which the reservoir may be
depleted for various need. In power projects,
releases are allowable up to MDDL only
instead of dead storage level, for power
generation.
Maximum Water Level (MWL) – Level
nearby the top face of the dam. It is also called
highest flood level or spillway design flood
level or maximum water surface elevation.
63. Buffer Storage – Level between the Dead storage
level (DSL) and Minimum Draw-Down level
(MDDL).
Dead Storage
Surcharge Storage – Level between FRL and MWL.
Live Storage – Level between MDDL and FRL.
Within-the-Year Storage – Meeting the demands of
a specific hydrologic year used for planning the
project.
Carry-Over Storage – Unused water of the year
Flood Control Storage
Field Storage – Is equal to FRL
64. STRATEGIES FOR RESERVOIR
OPERATION
1. Single Purpose Reservoirs
Some of the common principles of Single
purpose reservoir operation are as follows:
Flood Control
Effective use of available flood control storage
Control of reservoir design flood
Combination of principles
Flood control in emergencies
Conservation.
65. 2. Multi Purpose Reservoirs
The general principles of operation of
reservoirs with the multiple storage are below:
Separate allocation of capacities
Joint use of storage space
66. FAcTORS FOR ThE dESIGN OF
STORAGE cAPAcITy OF
RESERVOIRS (dESIGN FlOOd)
The following factors govern the design
storage capacity of reservoirs:
Precipitation, run-off and silt records available in the
region.
Erodibility of catchment upstream of reservoir for
estimating sediment yield.
Area capacity curves at the proposed location.
Trap efficiency.
Losses in the reservoir.
67. Water demand from the reservoir for different uses.
Committed and future upstream uses.
Criteria for assessing the success of the project. –
Design Period and Percentage.
Density current aspects and location of outlets.
Data required for economic analysis.
Data on engineering and geological aspects.
68. FlOOd cONTROl WORkS
One of the oldest and widely used methods
of protecting land from flood water is barrier preventing
over flow. Levees and flood walls are essentially
longitudinal dams created roughly parallel to a river
rather than across its channel.
A levee is an earth dyke, while a flood wall
is made of masonry or concrete construction.
1. Levees
Levees are frequently used for flood
control because they can be built relatively at low cost
of materials available at the site.
69. Levees are built from the material
excavated from the borrow pits paralleling the levee
line.
If dry construction is used, material should
be placed in layers and compacted.
Development of different types of
embankment have been largely in the result of
experience. The essential conditions considering in the
designs are:
1.An adequate height to prevent overtopping.
2.A cross-section of sufficiently massive for security
against seepage through the embankment.
3.Sufficient width at the top of embankments to provide
a road for supervision and transportation of materials
for works during flood.
70.
71. 2. Flood Walls
Costs for levees my be reasonable in rural
areas, but in cities difficult to obtain enough land for
earth dykes. In this case concrete flood walls are
preferable solution.
Flood walls are designed to withstand the
hydrostatic pressure when stages are low.
72.
73. EmbANkmENT dESIGN
Types of Embankment
Embankments can be classified into
two types as given below:
1. Homogeneous Embankment
2. Zoned Embankment
74. The following are the essential
requirements for designing the embankment:
High flood level (HFL)
Freeboard
Top width
Hydraulic gradient
Side slopes
The stability of the structure should be
checked under all stages of construction, condition of
saturation and drawdown. The embankment should be
safe against cracks due to unequal moisture contents in
different parts and unequal settlement.
75. 1. Design of High Flood Level (HFL)
- where long term discharge and gauge data are
available.
- where discharge and gauge data are available
for a short period.
- where no discharge and gauge are available.
2. Free Board
hw = 0.032 (VF)^(1/2) + 0.76 – 0.27 (F)^(1/4)
Where, hw = height of wave from trough to crest in ‘m’
V = wind velocity in kilometres per hour
F = fetch or straight length of water subject to
wind action in kilometres
76. 3. Top Width
- should be 5m. Turning platforms are 15
to 30m long and 3m wide with side slope 1:3.
4. Hydraulic Gradient
i) Clayey soil - 1 in 4
ii) Clayey sand - 1 in 5
iii) Sandy soil - 1 in 6
5. Side Slope
- River Side Slope
- Countryside Slope
77. INTERIOR dRAINAGE
• Rain, snow melt and seepage water must be removed
from the protected side of a levee or floodwall using
drains (with flap valves to prevent backflow during a
flood) and a sump pump.
• An emergency power source for the electric sump
enables operation during a power outage.
78. mAINTENANcE
• Routine inspection enables identification and repair
of problems while they are still minor.
• Levees should be checked for signs of erosion,
settlement, loss of vegetation, animal burrows and
trees.
• Inspect floodwalls for cracking, spelling or scour.
• Routine maintenance is needed to make sure that
sump pumps, valves, drain pipes and closures operate
properly.
79. AdVANTAGES OF lEVEES ANd
FlOOd WAllS
• Levees and floodwalls can protect a building and the
surrounding area from inundation without significant
changes to the structure if the design flood level is not
exceeded.
• There is no pressure from floodwater to cause
structural damage to the building.
• These barriers are usually less expensive than
elevating or relocating the structure.
• Occupants do not have to leave the structure during
construction.
80. dISAdVANTAGES
• This technique cannot be used to bring a substantially
damaged or improved structure into compliance with
floodplain development standards.
• For buildings with basements, hydrostatic pressure
from groundwater may still cause damage.
• Interior drainage must be provided.
• Require periodic maintenance.
• Do not eliminate the need to evacuate during floods.