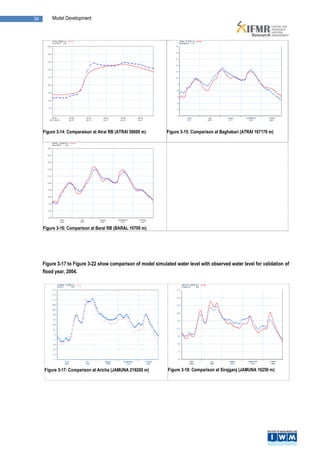
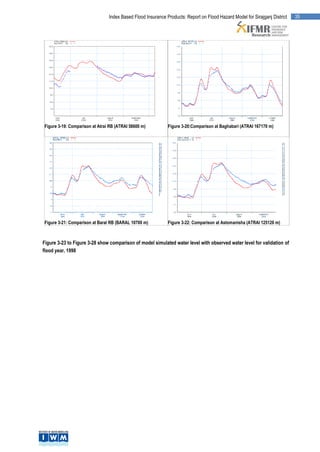
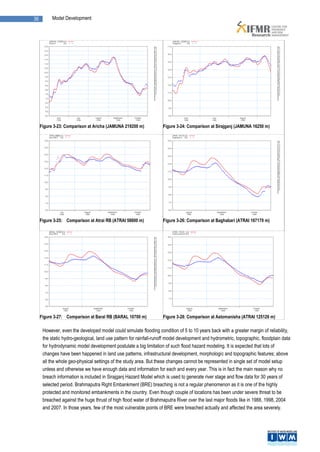
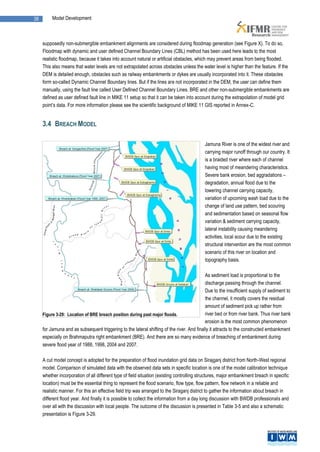
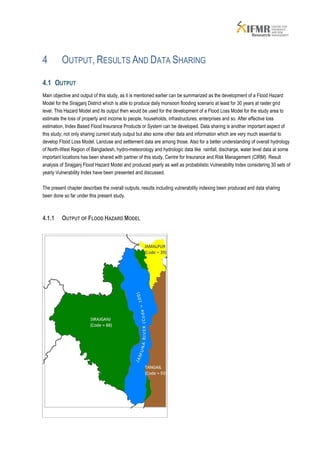
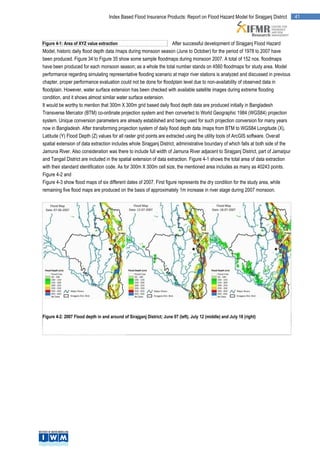
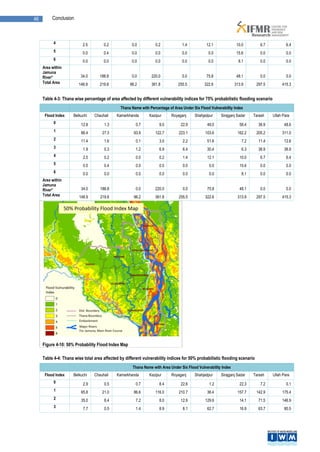
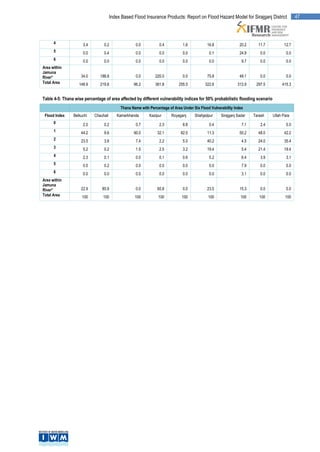
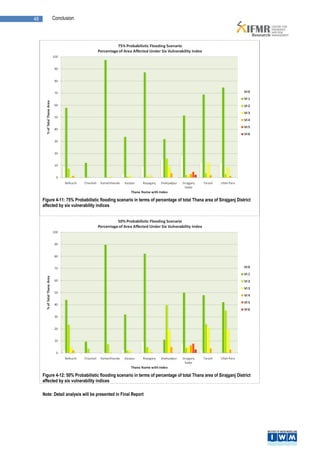
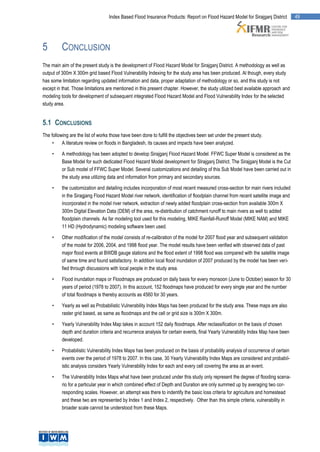
CIRM in collaboration with the Institute of Water Modelling, Dhaka, Bangladesh published a report on Flood Hazard Model for an Index Based Flood Insurance Products for Sirajganj District, Bangladesh.
1. TABLE OF CONTENTS
Table of Contents ........................................................................................................................................................... i
List of Figures............................................................................................................................................................... iii
List of Tables ................................................................................................................................................................ iv
Abbreviations and Acronyms ........................................................................................................................................ v
1 INTRODUCTION ...................................................................................................................................................... 1
1.1 General ........................................................................................................................................................... 1
1.2 Background Of The Study .............................................................................................................................. 1
1.3 Study Area ...................................................................................................................................................... 2
1.3.1 Geographical Location ............................................................................................................................... 2
1.3.2 River System .............................................................................................................................................. 3
1.3.3 Geology And Topography .......................................................................................................................... 5
1.3.4 People And Livelihood ............................................................................................................................... 5
1.4 Objectives, Scope Of Works And Outputs ...................................................................................................... 5
1.4.1 Objectives .................................................................................................................................................. 5
1.4.2 Scope Of The Works .................................................................................................................................. 6
1.4.3 Output ........................................................................................................................................................ 6
1.5 Literature Review ............................................................................................................................................ 6
1.5.1 Bangladesh And Its Hydrological Features ................................................................................................ 6
1.5.2 Floods In Bangladesh ................................................................................................................................ 8
1.5.3 Flooding And Drainage In The North West Region .................................................................................. 12
2 METHODOLOGY, DATA AND INFORMATION USED .......................................................................................... 13
2.1 Concept Of Flood Hazard Model .................................................................................................................. 13
2.2 Methodology: Development Of Flood Hazard Model .................................................................................... 13
2.2.1 Tools Used For The Study ....................................................................................................................... 15
2.2.2 Selection Of Events ................................................................................................................................. 16
2.2.3 Generation Of Flood Maps....................................................................................................................... 16
2.3 Methodology: Flood Vulnerability Index ........................................................................................................ 16
2.3.1 Criteria For Flood Vulnerability ................................................................................................................ 16
2.3.2 Yearly Index Map ..................................................................................................................................... 18
2.3.3 Probabilistic Vulnerability Index Map ....................................................................................................... 19
2.4 Data And Information Used .......................................................................................................................... 19
2.4.1 For Rainfall-Runoff Model Development .................................................................................................. 19
2.4.2 For Hydrodynamic Model Development................................................................................................... 19
2.4.3 For Flood Map Generation ....................................................................................................................... 20
3 DEVELOPMENT OF FLOOD HAZARD MODEL ................................................................................................... 21
3.1 Introduction ................................................................................................................................................... 21
3.2 Existing Super Model .................................................................................................................................... 22
3.2.1 Hydro-Meteorological Data Input ............................................................................................................. 22
3.2.2 Rainfall-Runoff Model .............................................................................................................................. 23
3.2.3 Hydrodynamic Model ............................................................................................................................... 23
3.2.4 Boundary Generation ............................................................................................................................... 23
2. ii Table of Contents
3.2.5 Performance of The Super Model ............................................................................................................ 24
3.3 Sirajganj Flood Hazard Model ...................................................................................................................... 25
3.3.1 Incorporation Of Floodplain Channel & Cross-Section ............................................................................ 25
3.3.2 Watershed /Catchment Runoff Distribution To River Network ................................................................. 28
3.3.3 Boundary Generation For Sirajganj Flood Hazard Model ........................................................................ 29
3.3.4 Calibration And Validation Of Sirajganj Model ......................................................................................... 32
3.3.5 Flood Inundation Maps/ Data Generation ................................................................................................ 37
3.4 Breach Model................................................................................................................................................ 38
4 OUTPUT, RESULTS AND DATA SHARING.......................................................................................................... 40
4.1 Output ........................................................................................................................................................... 40
4.1.1 Output of Flood Hazard Model ................................................................................................................. 40
4.2 Yearly Flood Vulnerability Index Map ........................................................................................................... 43
4.2.1 Index For Major Flood .............................................................................................................................. 43
4.2.2 Index For Normal or Average Flood Year ................................................................................................ 44
4.2.3 Index for Below Than Normal Flood Year ................................................................................................ 44
4.2.4 Probabilistic Index Map ............................................................................................................................ 45
5 CONCLUSION ....................................................................................................................................................... 49
5.1 Conclusions .................................................................................................................................................. 49
5.2 Limitations..................................................................................................................................................... 50
5.3 Recommendations ........................................................................................................................................ 50
6 REFERENCE ......................................................................................................................................................... 52
Annex-A
Annex-B
Annex-C
3. Table of Contents iii
LIST OF FIGURES
Figure 1-1: Study area ....................................................................................................................................................... 3
Figure 1-2: River system of North-West Region of Bangladesh ..................................................................................... 4
Figure 1-3: Topography and major river system of Bangladesh ........................................................................................ 7
Figure 1-4: Flood regime and type of Bangladesh ............................................................................................................. 7
Figure 2-1: Flow diagram showing methodology to produce Vulnerability Index Map using daily flood maps for 152
days of monsoon period. .................................................................................................................................................. 18
Figure 3-1: River network of FFWC Super Model ........................................................................................................... 22
Figure 3-2: The updated and non updated river reaches in Super Model ...................................................................... 23
Figure 3-3: Evaluation of FFWC Model performance at .................................................................................................. 25
Figure 3-4: Comparison of simulated water level of Brahmaputra at Sirajganj (top) Ganges at Rajshahi (middle) and
and Meghna at Bhairab Bazar (bottom) ........................................................................................................................... 25
Figure 3-5: Sirajganj Flood Hazard Model river network ................................................................................................. 26
Figure 3-6: Floodplain channels incorporated in the dedicated Sirajganj Model ............................................................. 26
Figure 3-7: Existing river network in Super Model covering the project area (left) and customized river and floodplain
network in Sirajganj Flood Model ..................................................................................................................................... 27
Figure 3-8: Water level grid (model h-points) of existing Super Model setup (left) and increased model grid points for
customized Sirajganj Flood Hazard Model (right) ........................................................................................................... 28
Figure 3-9: Thematic presentation of catchment runoff distribution approach. Main channel and corresponding
catchment area (left figure), main channel including additional channels (middle figure) and re-distribution of catchment
area to main and additional channels (right figure) .......................................................................................................... 29
Figure 3-10: Boundary location of North West Region of Super Model ........................................................................... 30
Figure 3-11: Water level comparison points for calibration and validation of the model .................................................. 32
Figure 3-12 to Figure 3-16: Comparison of model simulated water level with observed water level for calibration of flood
year, 2007 ........................................................................................................................................................................ 33
Figure 3-17 to Figure 3-22: Chow comparison of model simulated water level with observed water level for validation of
flood year, 2004 ............................................................................................................................................................... 34
Figure 3-23 to Figure 3-28: Comparison of model simulated water level with observed water level for validation of flood
year, 1998 ........................................................................................................................................................................ 36
Figure 3-29: Location of BRE breach position during past major floods. ........................................................................ 38
Figure 4-1: Area of XYZ value extraction ......................................................................................................................... 41
Figure 4-2: 2007 Flood depth in and around of Sirajganj District; June 07 (left), July 12 (middle) and July 18 (right) .... 41
Figure 4-3: 2007 Flood depth in and around of Sirajganj District; July 25 (left), July 29 (middle) and August 03 (right)
......................................................................................................................................................................................... 42
Figure 4-4: Flood Vulnerability Index Map for 2007 ......................................................................................................... 44
Figure 4-5: Flood Vulnerability Index Map for 1998 ......................................................................................................... 44
Figure 4-6: Flood Vulnerability Index Map for 2001 ......................................................................................................... 44
Figure 4-7: Flood Vulnerability Index Map for 1997 ......................................................................................................... 44
Figure 4-8: Flood Vulnerability Index Map for 2006 ......................................................................................................... 45
Figure 4-9: 75% Probability Flood Index Map .................................................................................................................. 45
Figure 4-10: 50% Probability Flood Index Map ................................................................................................................ 46
Figure 4-11: 75% Probabilistic flooding scenario in terms of percentage of total Thana area of Sirajganj District affected
by six vulnerability indices ................................................................................................................................................ 48
Figure 4-12: 50% Probabilistic flooding scenario in terms of percentage of total Thana area of Sirajganj District affected
by six vulnerability indices ................................................................................................................................................ 48
4. iv Table of Contents
LIST OF TABLES
Table 2-1: Agricultural land classification in terms of flood depth .................................................................................... 16
Table 2-2: Vulnerability scale for depth of flooding .......................................................................................................... 17
Table 2-3: Vulnerability scale for duration of flooding ...................................................................................................... 17
Table 2-4: Unique Index Assigned for Combined or Averaged Depth-Duration Index .................................................... 19
Table 3-1: Boundary data type and availability status for Northwest Region of Super Model ......................................... 30
Table 3-2: Boundary position of Sirajganj Flood Hazard Model with river name and chainage corresponds to FFWC
Super Model grid points used .......................................................................................................................................... 31
Table 3-3: Statistical parameter values for model performance (Year 2007) .................................................................. 32
Table 3-4: Statistical parameter values for model performance (Year 2004). ................................................................. 33
Table 3-5: Breach information on BRE in different flood year. ......................................................................................... 39
Table 4-1: Sample output of X,Y and flood depth value (Z) extracted from flood maps .................................................. 42
Table 4-2: Thana wise total area affected by different vulnerability indices for 75% probabilistic flooding scenario ....... 45
Table 4-3: Thana wise percentage of area affected by different vulnerability indices for 75% probabilistic flooding
scenario ........................................................................................................................................................................... 46
Table 4-4: Thana wise total area affected by different vulnerability indices for 50% probabilistic flooding scenario ....... 46
Table 4-5: Thana wise percentage of area affected by different vulnerability indices for 50% probabilistic flooding
scenario ........................................................................................................................................................................... 47
5. Table of Contents v
ABBREVIATIONS AND ACRONYMS
BWDB Bangladesh Water Development Board
BMD Bangladesh Meteorological Department
BRE Brahmaputra Right Embankment
CSFFWS Consolidation and Strengthening of Flood Forecasting and Warning Services
DHI Danish Hydraulic Institute
FAP Flood Action Plan
FCD Flood Control and Drainage
FCDI Flood Control Drainage and Irrigation
FFWC Flood Forecasting and Warning Centre
FFWS Flood Forecasting and Warning Services
GIS Geographic Information System
GoB Government of Bangladesh
HD Hydrodynamic
IWM Institute of Water Modelling
Khal Small natural water channel
Km Kilometer
m Meter
MIKE 11 1-Dimentional River Modelling Software developed by DHI
MIKE 11 GIS Flood Mapping tool of DHI
MSE Mean Squared Error
NAM Rainfall Runoff Model (Danish Abbreviation: Nedbor Afstomings Model)
NWRM North West Regional Model
NSE Nash-Sutcliffe efficiency
RHD Roads and Highways Department
RR Rainfall Runoff
R2 Co-efficient of Determination
6.
7. 1 INTRODUCTION
1.1 GENERAL
Bangladesh – a land of promise where full credits belong to its generous and industrious people, however, are often been
claimed as land of calamities and disaster. Such claim has been so exaggerated sometimes itgives an idea that natural
disaster like floods, cyclones, droughts, river bank erosion etc. are largely responsible for its underachievement. Socio-political
system of any country or community plays the pivotal role for development and enhances the resilience among the people
against such disaster. Meanwhile, science, technology and its applicability can ensure a sustainable strategic programme for
the policy makers and this is why the present study has a greater importance to come up with an integrated flood management
plan. The deaths and economic losses resulting from large flood like flood in 1988, 1998, 2004 and 2007 and subsequent other
major floods have forced the need for improved and integrated flood management and mitigation strategy. The impacts of
floods are expected to be worsen as the vulnerability of Bangladesh to natural disasters is increasing due to several factors
including poverty, worsening environmental soundness, population growth, urban growth, weak governance and institutional
factors, and climate change and variability (EWS, 2006).
Floodplain zoning and flood insurance system has appeared as an effective and community participatory concept over the last
few decades to mitigate the loss of income and property to flood effected people, property, infrastructure, and enterprises. Most
importantly it addresses the importance of preserving natural geo-physical settings whether it is water, agricultural, land use or
coverage which is evolved as current state with practices and adaptation of people with nature for hundred thousands of years.
In other words, it can facilitate to preserve the harmonic and sustainable interaction between people and nature for any given
area. With the idea of that, a collaborative research work between Chennai based Centre for Insurance and Risk Management
(CIRM), India and Dhaka based Institute of Water Modelling (IWM) has been taken on floodplain zoning and insurance system.
The study selects Sirajganj District as its pilot area first to identify the flood hazard that affects the study area; second to
estimate the flood loss in terms of peoples’ income and property, agricultural damage; and finally to come up with an effective
insurance system based on the findings from first two. In other words, the project aims to produce insurance based flood index
products for Sirajganj District.
This chapter, therefore, will describe the conceptual background of the project, project area, objectives-scope of works-output.
A literature review on overall flooding scenario of Bangladesh, particularly on North West Region of the county; its causes and
consequence; flood insurance products or system that has been in operation in many parts of the world for the last few years or
so and experiences of those operation is also presented.
1.2 BACKGROUND OF THE STUDY
Flood is an annual recurring event during the monsoon in Bangladesh and has often been studied (e.g. Rasid and Paul, 1987;
Khalil, 1990; Haque and Zaman, 1993; Paul, 1997; and the excellent overview by Hofer and Messerli, 1997). Normal floods (in
bangle it is usually called barsha) are considered as natural assets as they maintain the high fertility of cultivated land, whereas
extreme floods or bonna may be considered as natural hazards. Extreme floods are characterized by either unusually high
water levels or long-durations of flooding or early or late arrival of the flood (Jacobson et al., 2004). The average flood
discharges of the three main rivers (individually) are within the range 14,000 to 100,000 m3/s (Sarkar et al., 2003). Formation
and erosion of the islands and bars and banks of the rivers are very common features for those major rivers. The average
annual sediment transport through these rivers is nearly 950 Mton per year among which two third is wash load i.e. silt and clay
(Sarkar et al., 2003).
8. 2 Introduction
There have been several indications that the importance of sound flood management is expected to increase in the future both
nationally and globally. Firstly, climate change studies indicate that risk of flooding is increasing in inlands and costal zones. In
order to adapt to these scenarios, society and concerned countries need to be prepared and improve their flood management
strategy. Secondly, national and international agendas and agreements are required for comprehensive and progressive flood
management practices (Dubrovin et. al., 2006). For South Asia, particularly for Hindu-Khush-Himalayan (HKH) region and its
downstream region, this is more relevant than any other parts of the world.
Even though the occurrence of future flood disasters cannot be prevented, the magnitude of impact can be reduced by
developing apposite flood countermeasures (Dewan et al., 2006). In general, the construction of embankment and dykes along
river bank is the popular means of flood management in Bangladesh. It has become apparent during the flood in 1998 that
such an approach is inadequate to combat flood disaster. Moreover, many socio-environmental threats are already reported
due to the technological fixes and ill conceiving projects aiming to combat against flood with the concept of ‘flood control’ rather
than ‘flood management’. Now days, the question of integrated flood management comes out more on the surface among the
concerned authorities, experts, intelligentsia as well as among the people. In recognition of this fact, water experts of the
country have emphasized on prevention and mitigation measures. Development of effective flood forecasting system, quick
rehabilitation programme, flood zoning and hazard mapping for the management of future flood disasters (Nishat, 1998;
Hossain, 1998) are among those. It is perhaps recognized that to lessen the negative consequences of floods, hazard areas
must be identified and proper countermeasures should be adopted accordingly. Flood forecasting and warning services for the
major river systems of the country has been operated successfully for the last two decades, though lots of works yet to be done
to make it a meaningful flood mitigation proramme for community level. On the other side, there are few and mostly preliminary
works have been done so far in Bangladesh (Dewan et al., 2006) to produce flood hazard maps and estimate economic losses
for the past major floods as well as estimate potential economic losses for future such floods.
Nevertheless, it is arguably accepted that the advanced hydrologic forecast products, development of flood hazard maps
followed by producing flood loss index parameters, flood zoning and subsequent insurance policy, improvement of the drainage
pattern of the country are pinnacle fields to be concentrated on as part of the integrated flood management of the country.
With the idea discussed above, a research project aiming to produce index based flood insurance products for Sirajganj District
has been undertaken. There are three components of the project; first one deal with the development of Flood Hazard Model
and the second one will come up with a development of a Flood Loss Model for Sirajganj District using the output of first
component. The final one will focus on the development of formidable insurance policy against annual flood loss and on how it
could be applied to the stakeholders and users lev`1el. Institute of Water Modelling (IWM), Bangladesh and Centre for
Insurance and Risk Management (CIRM), India are jointly conducting this project study.
The present report thus presents an inception report of the project activities so far been accomplished which includes
methodology of the study, hazard model development, model calibration and validation and the ongoing generation of daily
flood depth data for the study area.
1.3 STUDY AREA
1.3.1 GEOGRAPHICAL LOCATION
Sirajganj district is located in the northwestern part of Bangladesh, of which the mighty Brahmaputra or Jamuna River following
at the right edge of the district. Interestingly enough 10 to 15 km wide Brahmapurtra River along with its floodplain at both sides
shares large part of the district’s total area. Geographically, extension of Sirajganj District is within the area of longitude from
89°20’ west to 89°50’ east and in latitude it is 24°00’ south to 24°20’ north. Total area of the district is 2497.92 sq km and is
9. Index Based Flood Insurance Products: Report on Flood Hazard Model for Sirajganj District 3
bounded by Bogra District on the north, Bogra and Nator District on the west and southwest, Pabna District on the south,
Tangail and Jamalpur districts on the east.
Sirajganj subdivision was established in 1845 during the period of British India-Bangladesh, and was included in Pabna district
at that time. It was turned into a district in 1984 after the liberation of Bangladesh back in 1971. The district consists of 4
municipalities, 42 wards, 9 upazilas, 79 union parishads (all are local government administrative units), 117 mahallas, 1467
mouzas and 2006 villages. The upazilas are Belkuchi, Chauhali, Kamarkhanda, Kazipur, Raiganj, Shahjadpur, Sirajganj Sadar,
Tarash and Ullahpara (see Figure 1-1).
1.3.2 RIVER SYSTEM
The description of river system of the district
must have to start with the river system of North
West region of Bangladesh. North West region
has 28 rivers with total length of approximately
401 km. Major rivers of the region are Teesta,
Upper-Karatoya, Atrai, Charalkata-Jamuneswari,
Karatoya and Bangali. There are several other
minor rivers in this area. Most of the rivers of this
region flow from very steep to flat ground,
predominantly from north to south (See Figure
1-2). A quick response of flash flood occurs in the
upper portion of the region and inundates
floodplains of both sides.
Charalkata-Jamuneswari-Karatoya-Bangali
River System
The Charalkata-Jamuneswari or Jainttnesvari
River (often referred as C. Jamuneswari)
originates from an inside country small catchment
and falls into Karatoya Rriver near Sirajganj. The
Figure 1-1: Study area Bullai having its upstream boundary at Hajipur
meets with C.Jamuneswari at Barati and Chickly
meets with that system at Badarganj. The Karatoya River originates at Nalshisa south of Dinajpur-Rangpur railway line and
receives flow of C.Jamuneswari at Sirajganj and flow to Akhira at Ghoraghat. Finally, this combined flow along with flow of
Ghagot meets with Bangali River near Mohimaganj. The river Bangali flows parallel to the Jamuna starting from Mohimaganj
and ends at Baghabari by falling into the Hurasagar River. Several flood cells, flood depression areas exist in the western side
of Bangali River. Spilling from the Barhmaputra or Jamuna River, though during high floods, generally occurs via breaches
developed in the Brahmaputra Right Embankment (BRE), which inundates large areas. Backwater effects from the Jamuna and
the Atrai is dominant in the lower reaches of the system and causes additional flood.
10. 4 Introduction
North West Region and Its
River System
Figure 1-2: River system of North-West Region of Bangladesh
11. Index Based Flood Insurance Products: Report on Flood Hazard Model for Sirajganj District 5
Upper Karatoya-Atrai River System
Upper Karatoya is one of the main rivers of North West Region. Generated from Himalaya territory, it enters into Bangladesh at
Panchagarh. It is flashy in nature and flows through a steeper ground slope. It is a perennial river. The lower part of Upper
Karatoya River named as Atrai is flowing through slightly steeper to flat land. Atrai River with several tributaries and
distributaries has formed a complex network of rivers before falling into the Hurasagar River at Baghabari almost at the same
point where the Bangali River also meets with the Hurasagar River. Thus, combined flow of Atrai-Bangali river system falls to
the Jamuna River through the Hurasagar River, the single outlet to the Jamuna. Upper part of Atrai River is influenced by local
flow and is flashy in nature whereas the lower part is largely influenced by backwater effect of the Jamuna through Hurasagar.
There are several depressions or beels existing around this river and a number of breaches originate every year from the banks
of Atrai. This causes changed flow characteristics every year. Important tributaries of Atrai river system are Ichamati-Jamuna,
Lower Nagor, Nandakuja, Baral and important distributaries are Dhepa, Sib-Bamai and Fakimi.
Ichamati-Jamuna-Tulshiganga-Little Jamuna System
Kharkharia and Ichamati-Jamuna River collect runoff from depression near at Syedpur. The flow of Tushiganga meets with
Ichamati-Jamuna and then flows with the name of Little Jamuna before joining with Atrai River. Lower Karatoya-Nagor River
system is the old course of Karatoya River which is now known as Lower Karatoya River, bifurcates from Karatoya River at
Gobindaganj and then flow southwards to Bogra and finally falls in Bangali at Khanpur in Sirajganj District. Nagor River
branches out from Lower Karatoya River at Shibganj and afterwards taking the name of Lower Nagor it traverses through
Chalan beel area and meets with Atrai near Singra.
The Jamuna and the Ganges
The Jamuna and the Ganges are the Eastern and Southern boundaries of North West Region, respectively. The Jamuna
separates the region from North Central Region and the Ganges separates North West region from the South West Region.
Most of the river systems of North West Region fall into the Jamuna River; whereas only Mohananda meets with the Ganges.
1.3.3 GEOLOGY AND TOPOGRAPHY
Sirajganj is relatively a plain land area. There is some low land and marsh land in this district. The land level of the area varies
from 3-4 meter at south to 15-20 meter at north. Most of the area of this district goes under water during the rainy season.
About 10% area of the Chalan Beel is located in the Tarash Upazila of this District. Total cultivable land is 179,964 hectares,
fallow land 15,702 hectares, forestry 50 hectares. Out of total cultivated area, single cropped land is 19.54%, double crop
59.18% and treble crop land shares 21.28%. 74.34% of the cultivated land is under irrigation facilities either by indigenous local
practices or small to medium scale irrigation projects of Bangladesh Water Development Board (BWDB).
1.3.4 PEOPLE AND LIVELIHOOD
Nearly one-third of the district’s households are involved in and dependent on weaving. More than 20,000 families in nine
upazilas of the district used to earn their livelihood from production, sale and marketing of clay-goods, but now they are in acute
economic hardship. Main occupations of this district are -Agriculture 35.49%, agricultural labourer 21.45%, wage labourer
5.77%, commerce 11.98%, service 5.49%, handicraft 5.59%, industrial labourer 2.78%, others 11.45%.
1.4 OBJECTIVES, SCOPE OF WORKS AND OUTPUTS
1.4.1 OBJECTIVES
The objectives of the IWM study component are summarized as following:
• Development of a Flood Hazard Model using the integrated Hydrologic and Hydrodynamic Model for Sirajganj District
and simulate the model for the period of 30 years (1978 to 2007).
• Generation of daily flood depth data for each of monsoon period of 30 years to provide input variables and parameter
values for development of a Flood Loss Model.
12. 6 Introduction
• Development of methodology to produce raster based (300m X 300m) distributed Flood Vulnerability Index for Siraj-
ganj District using the depth-duration defined vulnerability scale.
1.4.2 SCOPE OF THE WORKS
• Development of Hydrodynamic Model using data and information of hydro-meteorology, hydro-morphological and
geo-physical settings of the of the study area. Hydro-meteorological data /information include rainfall, water level and
discharge data; while hydro-morphological and geo-physical data /information comprises of river and khal (small
floodplain channel) alignment and their cross-sections, embanked non-embanked condition, floodplain and wa-
tershed information, soil-water interaction, farming practices (mainly irrigable, non-irrigable land), etc. MIKE 11 HD
(hydrodynamic) coupled with MIKE 11 NAM (rainfall-runoff) modeling software, developed by Danish Hydraulic Insti-
tute (DHI), Denmark is used for this hydrodynamic model development.
• Development of Flood Hazard Model for the project area using combined modeling approach like integrating MIKE 11
Hydrodynamic and Flood Depth-Duration generating tool MIKE 11 GIS.
• Generating raster based (300m X 300m cell size) daily flood depth data /maps using time series model output of hy-
drodynamic model for every model grid points (water level and discharge) and topographic information of the study
area (DEM, Digital Elevation Model). Flood depth generation tool named as MIKE 11 GIS, also developed by DHI is
used for this purpose.
• Producing Flood Vulnerability Index Maps using Arc View /ArcGIS software with the spatial and temporal analysis of
daily flood depth data generated from developed Flood Hazard Model (integrating model of MIKE 11 and MIKE 11
GIS) during monsoon period over the period of 1978 to 2007.
1.4.3 OUTPUT
Outputs or deliverables from this study can be summarized as follows:
• A detailed report describing the study undertaken, objectives, methodology, outputs and conclusion.
• Time series model grid point output (water level and discharge) for rivers and floodplain channels incorporated in the
hydrodynamic model.
• Daily flood depth data for Sirajganj District for 30 years (1978 to 2007) during monsoon period.
• Flood maps in terms of flood depth and duration in paper and digital format.
• Flood vulnerability index maps in terms of flood depth and duration in paper and digital format.
• Database achieve, customized GIS and data analysis tools to automate several steps of daily flood depth generation
and flood vulnerability index mapping.
• Data and output /results sharing with the partner institution of this project, named as CIRM, India.
1.5 LITERATURE REVIEW
1.5.1 BANGLADESH AND ITS HYDROLOGICAL FEATURES
Bangladesh is a developing country in South Asia located between 20°34' to 26°38' north latitude and 88°01' to 92°42' east
longitude, with an area of 147,570 sq km. It has a population of about 128 million, with a very low per capita Gross National
Product (GNP) of US$ 370 (WB, 2000). It has a border on the west, north, and east with India, on the southeast with Myanmar,
and the Bay of Bengal is to the south. The floodplains of the three big rivers, together with smaller rivers and streams, cover
about 80% of the country (Brammer, 1990A). Therefore a flat, low-lying topography is the most characteristic geomorphologic
feature of Bangladesh (see
Figure 1-3 and Figure 1-4); 60% of the country is lower than 6 meters above sea level (USAID, 1988:110).
13. Index Based Flood Insurance Products: Report on Flood Hazard Model for Sirajganj District 7
Figure 1-3: Topography and major river system of Bangladesh Figure 1-4: Flood regime and type of Bangladesh
Accordingly the average river gradient in the delta is very low, about 6cm/ km (GOB, 1992A: 3.1). The precipitation is
dominated by monsoonal characteristics. June to September are the most important months of the rainy season. There is a
significant increase of total precipitation as well as duration of the rainy season from west to east, with the onset of the
monsoon season in the east as early as May. 80% of the rainfall over Bangladesh occurs between June and October (BWDB,
1975: 39). According to Ahmad (1989: 23) the average annual rainfall in the catchment area of the Ganges/Padma reaches is
1400 mm, of the Brahmaputra/Jamuna 2100 mm and of the Meghna 4000 mm. The hydrographs of the main rivers are
characterized by monsoonal features as well the peak discharges are reached in July or August, the lowest flows are measured
from December to March. The range between high flow and low flow is significant: the average flood flow of the Brahmaputra
reaches ten times, of the Ganges even twenty times, the respective dry season flow! Due to the earlier onset of the monsoon in
the east, the discharge hydrograph of the Brahmaputra rises much earlier, and normally reaches its peak one month before the
Ganges. In spite of the significantly lower catchment area, the Meghna, too, reaches remarkable discharge figures in the
monsoon season.
The following particular hydrological features result from the unique geographical situation of Bangladesh:
• 7-8% of the catchment areas of the Ganges, the Brahmaputra and the Meghna basins are located within Bangla-
desh. 62% are in India, 18% in China, 8% in Nepal and 4% in Bhutan (Hughes et al., 1994).
• 1,360,000 million m3 of discharge per year originates outside Bangladesh, 85% of which between June and October
(Boyce, 1990: 419-509) is contributed by the Brahmaputra, 40% by the Ganges and nearly 10% by the tributaries of
the Meghna (BWDB, 1975: 21). 90% of the water carried by the river systems is brought from outside the country
(Choudhury, 1989: 235; Boyce, 1990: 412).
• The amount of water which annually reaches Bangladesh would form a lake of the size of the country and of 10.3
meters depth (Ahmad, 1989: 26).
• Bangladesh has to drain water from an area which is 12 times its size (Miah, 1988:5; Bingham, 1991:31).
14. 8 Introduction
• The estimated annual sediment load is 735x106 tons for the Brahmaputra and 450x106 tons for the Ganges (Dewan,
1989:28). The daily suspended sediment discharge of the Brahmaputra at Bahadurabad amounts to 2-3 million tons
from July to August (Hossain et al., 1987: 17).
• 1/3 of the area of Bangladesh is influenced by the tides in the Bay of Bengal (Hossain et al., 1987:16).
All the information and references presented here are already cited in Floods in Bangladesh (Hofer, 1998).
1.5.2 FLOODS IN BANGLADESH
According to the discussion presented in Banglapedia, floods are more or less a recurring phenomenon in Bangladesh and
often have been within tolerable limits. But occasionally they become devastating. Each year in Bangladesh about 26,000 sq
km, 18% of the country is flooded. During severe floods, the affected area may exceed 55% of the total area of the country. In
an average year, 844,000 million cubic meter of water flows into the country during the humid period (May to October) through
the three main rivers the Ganges, the Brahmaputra-Jamuna and the Meghna. This volume is 95% of the total annual inflow. By
comparison only about 187,000 million cubic meter of stream flow is generated by rainfall inside the country during the same
period.
In Bangladesh, the definition of flood appears differently. During the rainy season when the water flow exceeds the holding
capacity of rivers, canals (khals), beels, haors, low-lying areas it inundates the whole area causing damage to crops,
homesteads, roads and other properties. In the Bangladesh context there is a relation between inundation and cropping.
Floods in Bangladesh can be divided into three categories: (a) monsoon flood - seasonal, increases slowly and decreases
slowly, inundates vast areas and causes huge losses to life and property; (b) flash flood - water increases and decreases
suddenly, generally happens in the valleys of the hilly areas; and (c) tidal surge flood – due to cyclonic effects in the coastal
belt, short duration, height is generally 3m to 6m, blocks inland flood drainage.
The combined annual flood wave from the Ganges, Brahmaputra and Meghna rivers passes through a single outlet, the Lower
Meghna River. During the high tidal level in the Bay of Bengal, it reduces the slope of water flowing to the bay and
consequently reduces the discharge capacity of the Lower Meghna. The effects of these high river water levels extend over
most of the country and are the main determinant of the drainage condition and capacity. The discharge from minor rivers is
reduced and surface drainage by gravity is limited to land above the prevailing flood level. Flooding caused by this drainage
congestion exists nearly everywhere except in the highland and hilly areas in the northern and eastern parts of the country.
General Causes of Flooding (cited in Hofer, 1998)
In general, heavy monsoonal rainfall simultaneously over the whole Ganges-Brahmaputra-Meghna (GBM) basins is the main
causes of flood in Bangladesh as it receives almost all the runoff generated in those basins’ area (Miah, 1988: 5-6). The flood
situation is become worsen when high river discharge combined with heavy rainfall inside the country (BWDB, 1975: 6-10;
Hossain et al., 1987: 8; Ahmad, 1989: 20-22). Earthquakes and sediment transport are another important issue causing shift or
abandoned of active channels and decreasing water carrying capacity of major river due to heavy sedimentation (BWDB. 1975:
6-10; Hossain et al., 1987: 20; Ahmad, 1989: 20-22). In the reality of climate change era, greenhouse effect resulting in higher
rainfall, higher temperatures and consequently increased melting of ice in the Himalayas and brings more and more water to
the river system of Bangladesh (Matin and Husain, 1989: 6-7).
Causes of floods inside Bangladesh (cited in Hofer, 1998)
• Flat low-lying topography, low channel gradient (BWDB, 1975: 6.10; Rasid and Paul, 1987: 159; Ahmad, 1989: 20-
22).
• Geological depressions (BWDB. 1975: 6-10; Rasid and Paul, 1987: 159; Ahmad, 1989: 20-22; Dewan, 1989: 6-7).
• Local heavy rainfall (Brammer, 1987: 19; Hossain et al., 1987: 19. USAID, 1988: 111; Ives, 1991: 37).
• High river discharge (Rasid and Paul, 1987: 158; Ahmad, 1989: 20-22).
• Overflowing of river beds and irrigation channels (BWDB, 1975: 6-10; Ahmad, 1989: 20-22; Dewan, 1989: 6-7. Hos-
sain, 1989: 781).
15. Index Based Flood Insurance Products: Report on Flood Hazard Model for Sirajganj District 9
• Synchronization of high flow of the three major rivers (BWDB, 1975: 6-10; Hossain et al., 1987: 6; Ahmad, 1989: 20-
22).
• Backwater effects (BWDB, 1975: 6-10; Hossain et al., 1987: 3-8; Miah, 1988: 80-85; Ahmad, 1989: 20-22).
• Soil saturation (Choudhury, 1989: 237).
• Old river courses within Bangladesh (Hossain et al., 1987: 17).
• Impeded drainage due to high water levels in the rivers (Dewan, 1989: 6-7).
• Siltation of the river beds (Hossain et al., 1987: 17; Rashid and Paul, 1987: 159; USAID, 1988: 111; Abbas, 1989: 92;
Ahmad 1989: 20-22; Choudhury, 1989: 236; Hossain, 1989: 78).
• Changing of river courses (Hossain, 1989: 78).
• Riverbank erosion (Hossain, 1989: 78).
• Poorly planned embankments for flood protection or roads and railways within the flood plains, upland development
works in Bangladesh (Hossain et al., 1987; Miah, 1988: 66-79; Ahmad, 1989: 202-203; Choudhury, 1989: 236; De-
wan, 1989: 6-7; Huda, 1989: 122; Pearce, 1991: 40. Hughes et al., 1994: 24).
• Breaches of embankments (Hossain et al., 1987: 19).
• Water logging due to congestion and failures in drainage systems like pumps or sluice gates (Dewan, 1989: 6-7; Ad-
nan, 1991: 1).
• Disappearance of wetlands: the floodplains are losing their most skilled environmental managers (Hughes et al.,
1994: 19).
• Rising of the mean sea level during monsoon period (BWDB, 1975: 6-10: Hossain et al., 1987: 16: Ahmad, 1989: 20-
22).
• High tides (BWDB. 1975: 6-10; Hossain et al., 1987: 16: Choudhury, 1989: 236-237; Dewan, 1989: 6-7).
Causes outside Bangladesh (cited in Hofer, 1998)
• Humid air masses producing orographic rainfall on the slopes of the first Himalayan ridges (Hossain et al., 1987: 7).
• Heavy rainfall in the upper catchment of the big rivers (Huda, 1989: 121).
• Snowmelt (Choudhury, 1989: 236).
• Immense extra-territorial inflows (Hossain et al., 1987: 7; Rasid and Paul, 1987: 158; Ahmad, 1989: 23; GOB, 1992A:
5-11).
• Deforestation (Hossain et al.,1987: 17; USAID,1988: 111; Abbas,1989: 91-94; Ahmad, 1989: 26-28; Choudhury,
1989: 236; Dewan, 1989; Haq, 1989: 146; Huda, 1989: 121; Khan, 1989: 152; Latif, 1989: 98; Shahjahan, 1989:
142).
• Aggravating the flood situation in Bangladesh through construction of embankments and other structures in India, es-
pecially between 1966-1980 (BWDB, 1975:6-10; Ahmad, 1989: 20-22, 28).
• Farakka Barrage producing higher flood peak (Hossain et al., 1987: 17; Ahmad, 1989: 28).
Chronology of big floods (cited in Banglapedia)
1781: Serious flood, which was more pronounced in the western part of Sylhet District. The cattle suffered much from the loss
of fodder.
1786: Floods in the Meghna wrought havoc to the crops and immense destruction of the villages on the banks. It was followed
by a famine, which caused great loss of life at Bakerganj. At Tippera the embankment along the Gumti River gave way. At
16. 10 Introduction
Sylhet the parganas were entirely under water, the greater part of the cattle drowned and those surviving were kept on bamboo
rafts.
1794: The Gumti embankment burst again, causing much damage around Tippera.
1822: Bakerganj division and Patuakhali subdivision were seriously affected; 39,940 people died and 19,000 cattle perished
and properties worth more than 130 million taka were destroyed. Barisal, Bhola and Manpura were severely affected.
1825: Destructive floods occurred at Bakerganj and adjoining regions. There were no important embankments or other
protective works against inundation in the district.
1838: Heavy rainfall caused extensive inundation at Rajshahi and a number of other districts. The cattle suffered much from
loss of fodder and the people were greatly inconvenienced when driven to seek shelter on high places and when the water
subsided cholera broke out in an epidemic form.
1853: Annual inundation was more pronounced than usual in the west of Sylhet District, partly the result of very heavy local
rainfall and partly caused by the overflow of the Meghna.
1864: Serious inundation when the embankment was breached and the water of the Ganges flooded the greater part of
Rajshahi town. There was much suffering among the people who took shelter with their cattle on the embankment.
1865: Extensive inundation caused by the annual rising of the Ganges flooded Rajshahi District. Excessive rainfall seriously
affected Rajshahi town.
1867: Destructive flood also affected Bakerganj. Crop was partially destroyed, but no general distress resulted.
1871: Extensive inundation in Rajshahi and a few other districts. Crops, cattle and valuable properties were damaged. This was
the highest flood on record in the district. Cholera broke out in an epidemic form.
1876: Barisal and Patuakhali were severely affected. Meghna overflowed by about 6.71m from the sea level. Galachipa and
Bauphal District were damaged seriously. A total of about 215,000 people died. Cholera broke out immediately after flood.
1879: Flooding of the Teesta when the change in the course of the Brahmaputra River began.
1885: Serious floods occurred due to the bursting of an embankment along the Bhagirathi, affected areas of Satkhira
subdivision of Khulna District.
1890: Serious flood at Satkhira caused enormous damage to cattle and people.
1900: Due to the bursting of an embankment along the Bhagirathi, Satkhira was affected.
1902: At Sylhet the general level of the river went so high that there was terrible flood. Crops and valuable properties were
damaged.
1904: The crops in some parts of Cox's Bazar subdivision and Kutubdia Island were damaged due to an abnormally high tide.
This flood was exceptional in severity in Mymensingh. The distress caused on this occasion is probably the nearest parallel to
that which resulted from the flooding of the Teesta in 1879, when the change in the course of Brahmaputra began.
17. Index Based Flood Insurance Products: Report on Flood Hazard Model for Sirajganj District 11
1954: On August 2, Dhaka District went under water. On August 1 flood peak of the Jamuna River at Sirajganj was 14.22m and
on August 30 flood peak of the Ganges River at Hardinge Bridge was 14.91m.
1955: More than 30% of Dhaka District was flooded. The flood level of the Buriganga exceeded the highest level of 1954.
1962: The flood occurred twice, once in July and again in August and September. Many people were affected and crops and
valuable properties were damaged.
1966: One of the most serious floods that ever affected Dhaka occurred on 8 June, 1966. The flood level was almost the
highest in the history of Sylhet district too. A storm on the morning of 12 June 1966 made the situation grave. About 25% of
houses were badly damaged, 39 people died and 10,000 cattle were lost, and about 1,200,000 people were affected. On
September 15 Dhaka city became stagnant due to continuous rainfall for 52 hours, which resulted in pools of water 1.83m deep
for about 12 hours.
1968: Severe flood in Sylhet District and about 700,000 people were badly affected.
1969: Chittagong District fell in the grip of flood caused by heavy rainfall. Crops and valuable property were damaged.
1974: In Mymensingh about 10,360 sq km area was flooded. People and cattle were severely affected and more than 100,000
houses were destroyed.
1987: Catastrophic flood occurred in July-August. Affected 57,300 sq km (about 40% of the total area of the country) and
estimated to be a once in 30-70 year event. Excessive rainfall both inside and outside of the country was the main cause of the
flood. The seriously affected regions were on the western side of the Brahmaputra, the area below the confluence of the
Ganges and the Brahmaputra, considerable areas north of Khulna and finally some areas adjacent to the Meghalaya hills.
1988: Catastrophic flood occurred in August-September. Inundated about 82,000 sq km (about 60% of the area) and its return
period is estimated to be 50-100 years. Rainfall together with synchronization of very high flows of all the three major rivers of
the country within only three days aggravated the flood. Dhaka, the capital of Bangladesh, was severely affected. The flood
lasted 15 to 20 days.
1989: Flooded Sylhet, Sirajganj and Maulvi Bazar and 600,000 people were trapped by water.
1993: Severe rains all over the country, thousands of hectares of crops went under water. Twenty-eight districts were flooded.
1998: Over two-thirds of the total area of the country was flooded. It compares with the catastrophic flood of 1988 so far as the
extent of flooding is concerned. A combination of heavy rainfall within and outside the country, synchronization of peak flows of
the major rivers and a very strong backwater effect coalesced into a mix that resulted in the worst flood in recorded history. The
flood lasted for more than two months.
2000: Five southwestern districts of Bangladesh bordering India were devastated by flood rendering nearly 3 million people
homeless. The flood was caused due to the outcome of the failure of small river dykes in West Bengal that were overtopped by
excessive water collected through heavy downpour.
2004: Nationwide 36 million people (about 25 percent of the population) across 39 districts were affected by the flood many of
which were rendered homeless. Approximately 38 percent of Bangladesh was inundated by the time the waters begun to
recede in late August, including 800,000 hectares of cultivable land. As of mid-September, the death toll had reached almost
800. During the emergency, access to potable water and sanitation facilities was diminished, as thousands of tube-wells and
latrines were affected. The flood also caused heavy damage to major infrastructures such as roads, bridges, railway,
embankment, irrigation system, rural infrastructure
18. 12 Introduction
2007: By August 1, flood condition for both Ganges and Brahmaputra Rivers become severe and the flow of these two rivers
synchronized each other. By August 3, the main highway connecting Dhaka to the rest of the country was impassable, many
districts were flood-affected and 500,000 people had been marooned. By August 7, an estimated 7.5 million people had fled
their homes. By August 8, more than 50,000 people had diarrhea or other waterborne diseases and more than 400,000 people
were in temporary shelters. The number of people with flood-related diseases was increasing and about 100,000 people had
caught dysentery or diarrhoea. By August 15, five million people were displaced, the estimated death toll was nearly 500, and
all six of Bangladesh's divisions were affected.
1.5.3 FLOODING AND DRAINAGE IN THE NORTH WEST REGION
As it is discussed in FAP study back in early 1990’s, the North West region (NWR) covers 3.5 million hectares, and has a
population of 25 million people. It shows considerable variation, in relation to such aspects as climate, topography and water
resources. These variations are reflected in the range of flooding problems existing within it.
The region has been divided into fifteen planning units in order to provide comprehensive coverage of these problems. Within
each unit the flooding situation was assessed by a combination of field visits, primary data collection and analysis of secondary
sources. The principle data used related to agricultural cropping, crop and infrastructure damage due to flooding, and water
bodies and fisheries. This was supplemented by analysis of hydrological data and the development and use of a hydrodynamic
model covering part of the region.
The east and south of the region is bordered by the major rivers, the Brahmaputra and the Ganges. The part of the region
along the Brahmaputra suffers particularly severely from flooding caused by breaches in the main Brahmaputra Right
Embankment (BRE). This type of flooding is very damaging in the disruption it causes to people's lives, and the losses to
agriculture and infrastructure. Similar problems of a more limited scale occur along the Teesta, Dharla and Dudhkumar River in
the north east of the region. In the south, breaches from the Ganges are not a major source of flooding.
Within the region, flooding and drainage problems are mainly caused by the drainage patterns of the internal rivers. The
majority of these drain to the south east to the Lower Atrai/ Lower Bangali system, and thence to the Brahmaputra through the
Hurasagar River outfall. Outfall conditions are often constrained during the monsoon by high levels in the Brahmaputra, and
this in turn results in backing up and extensive flooding throughout the Lower Atrai and Lower Bangali River. Flooding over
three meters regularly occurs over many parts of the Lower Atrai /Bangali sytem (mainly in Sirajganj District). However, while
such flooding constrains agricultural production, it is not a problem in the same way as that caused by breaches from the major
rivers since it develops more slowly and does not cause the same amount of social disruption.
The upper reaches of the region are steeper than elsewhere and are susceptible mainly to flash flooding. In most cases the
floods last only for a few days and do not cause a great deal of damage to crops, though they can do to infrastructure.
19. 2 METHODOLOGY, DATA AND INFORMATION USED
2.1 CONCEPT OF FLOOD HAZARD MODEL
While flood modelling is a fairly recent practice, the recent development in computational flood modelling has enabled water
experts and others to step away from the tried and tested "hold or break" approach and its tendency to promote overly
engineered structures. Various computational flood models have been developed in recent years either one-dimensional (1D)
models (flood levels measured in the channel) and two-dimensional (2D) models (flood depth measured for the extent of the
floodplain).
On the other hand, GIS and remote sensing, satellite images has widely been used to map and model surface water and flood
hazard (Aziz et al. 2003; Werner, 2001; Boyle et al. 1998; Green and Cruise, 1995). Remotely sensed data provides the
instantaneous and synoptic view necessary for the estimation of flood and are therefore widely used in flood mapping and
hazard assessment (Dewan et al., 2006). Remote sensing data, however, is predominantly invaluable for developing countries
in development planning (Imhoff et al. 1987). Its application is considered vital for third world countries because it is difficult for
government to update their database due to the lack of resources with the traditional ground observation method which is both
costly and time consuming (Dong et al. 1997). Recently, the integrating capabilities of satellite data with GIS have opened up
opportunities for quantitative analysis of hydrological events, such as flood, at all geographic and spatial scales.
Conceptually as well as in practice Hazard Model is kind of modeling approach output of which is used to estimate the loss
(e.g. loss of income, property to people, households, infrastructures and enterprises and so) due to certain type of hazards. In
this regard, Flood Hazard Model should have to be in a position so that the annual flooding scenario for a particular area could
be produced and using those scenario losses due to flood can be estimated. Meanwhile, the present chapter will describe the
overall methodology being applied for the development of a Flood Hazard Model for Sirajganj District. Data and information to
be required for such model development is also presented here for a better understanding of Flood Hazard Modelling.
2.2 METHODOLOGY: DEVELOPMENT OF FLOOD HAZARD MODEL
The development of Hazard Model comprises of two steps; first one is the development of Hydrologic and Hydrodynamic River
and Floodplain Model followed by the second one which deals with the generation of daily flood depth (inundation) data/ maps.
Calibration of the model considers proper selection, adjustment and application of parameters values both for rainfall-runoff and
hydrodynamic model and comparison of model output data with observed data for base year. In present study, monsoon period
of 2007 is considered as base period for model development and calibration. Validation of the model is normally carried out by
comparing the model output data with observed data for different time period without changing any parameter values of base or
calibrated model. Calibration period may be past or next year(s) of calibrated year. Reliability as well as applicability of
developed model thus comes under a thorough analysis of calibration of validation of the model. A well calibrated model must
produce results which show reasonably good matches with the observed data and upon which confidence of further using of
those model data is largely relied on.
Sirajganj District is located at the western side of the Brahmaputra River through which some of the major rivers in the North
West Region of the country are flowing. Sirajganj District is unique in its choice for Flood Hazard Modelling to mitigate the
frequently recurrent flooding problem of the area; as whole for watershed planning. Rather than using single event-steady state
models for hydrology and hydraulics, the present study utilizes continuous simulation and dynamic routing models like MIKE 11
HD (Hydrodynamic) coupled with hydrological model named as MIKE 11 NAM (Rainfall-Runoff). The models were selected for
the following reasons. First, the continuous simulation of the hydrologic model is used to capture the effects of antecedent
moisture on runoff volumes and peaks and to account for non-uniform precipitation distributions over the watersheds. It is
difficult to deal with these factors using the typical design storm approach. Second, the effects of huge upstream incoming flow
20. 14 Methodology
to the river system of the project area, flood plain storage, permanent water body and complex backwater effect from Jamuna
River have a significant impact on the overall hydrology and flooding scenario of the project area. Thus, an unsteady flow
model has been adopted for use in Flood Hazard Modelling. MIKE 11 HD produces continuous flow and stream stage
information based on historical precipitation and inflow records estimated /generated at the boundary location of project model
domain. From this data, flow and stage duration is readily available for every result saving time step; for instance in this case
every 3 hours time step for whole monsoon season.
In other way, the continuous simulation approach allows to generate daily flood depth data /maps properly using the floodplain
mapping software like MIKE 11 GIS. Hydrologic information, by means of the MIKE 11 NAM (Rainfall-Runoff) Model, developed
by DHI Water and Environment, Denmark requires input data such as rainfall, evaporation etc. The Rainfall-Runoff Model is
applied to estimate the runoff generated from rainfall occurring in the catchment by NAM method (please see scientific
background of NAM Model in Annex-A). NAM is a lumped conceptual model that simulates continuous runoff, base and
interflow by simple water balance approach for various land cover types for a continuous period of precipitation record. The
model incorporates infiltration, interflow, depressional storage, soil storage, overland flow, evapotranspiration, and changes in
antecedent soil moisture in determining rainfall-runoff. Thus NAM hydrological model simulates rainfall-runoff processes
occurring at the catchment scale and forms Rainfall-Runoff (RR) module of the MIKE 11 River Modelling system.
Hence, the resulting output from MIKE 11 NAM is a continuous time series file (TSF) of runoff for every sub-basin been
modelled in response of meteorology (rainfall, evaporation) gauges and soil-moisture content, characteristics of agro-geological
land cover covering the whole model domain area.
Hydraulic analyses are achieved using MIKE 11 Hydrodynamic module (HD). MIKE 11 HD uses an implicit, finite difference
scheme for the computation of unsteady flows in rivers and estuaries (please see scientific background of MIKE 11 HD in
Annex-A). The module can describe sub-critical as well as supercritical flow conditions through a numerical scheme which
adapts according to the local flow conditions (in time and space). Advanced computational modules are included for description
of flow over hydraulic structures, including possibilities to describe structure operation. The formulations can be applied to
looped networks and quasi two-dimensional flow simulation on flood plains.
Thus MIKE 11 HD model is applied to compute water level, discharge and flow velocity at every model grid points (water level,
discharge /velocity point). The MIKE11 HD solves the vertically integrated equations of conservation of energy and momentum
called the ‘Saint Venant Equation’ that describe the flow dynamic in a river system. The Model takes into account the river
connectivity, river cross-sections, flood plain level and observed discharge at inlet and stage at outlet locations of the modelled
river network. The observed discharge and stage applied respectively at the inlet and outlet are called boundary to the model.
The runoff generated in the NAM model from rainfall occurring inside the basin is taken care of as inflows into the river system.
Historical rainfall and stream flow data along with computer modeling are used to evaluate the flooding scenario of the project
area. All models are calibrated with recorded time series water level data at Bangladesh Water Development Board (BWDB)
maintained river stage monitoring stations. These gauges are also used both for flood forecasting and model calibration
purposes in FFWC (Flood Forecasting and Warning Centre) Super Model. FFWC Supper Model has been in operation for
national flood forecasting and warning services during monsoon for the last two decades.
Existing FFWC Super Model is used as base for developing dedicated Sirajganj Flood Hazard Model. Hence, based on the
Super model and collected detailed information from field a dedicated flood model of Sirajganj has been prepared. At first, the
FFWC Super Model is simulated for 30 consecutive years (from 1978 to 2007) for generating the boundaries of the dedicated
Sirajganj Flood Model. In order to better representation of physical system governing the flooding scenario, detail floodplain
information is incorporated in the dedicated Sirajganj Flood Hazard Model for the project area.
Since flood information generates for many model grid points (e.g. water level points) for 30 years of monsoon simulation,
accurate recurrence intervals can be developed for them in the model. Generations of flood inundation maps /data are carried
out using MIKE 11 GIS. MIKE 11 GIS is an advanced tool for the spatial presentation and analysis of one-dimensional (1D)
flood model results for use in the flood management planning process. The MIKE 11 GIS system integrates the MIKE 11 river
21. Index Based Flood Insurance Products: Report on Flood Hazard Model for Sirajganj District 15
and floodplain modeling technologies with the spatial analysis capabilities of the ArcView Geographic Information System
(GIS). MIKE 11 GIS is ideally suited as a decision support tool for river and floodplain management through its enhanced
routines that provide precise and efficient means of mapping and quantifying flooding impacts on communities, infrastructure,
agriculture, fisheries and on the environment.
The analysis and outputs developed using MIKE 11 GIS are important inputs for a range of floodplain management
undertakings including flood risk assessment, flood control, flood forecasting, floodplain preservation and restoration, drainage
structure projects and project design specifications. MIKE 11 GIS is based on a bi-directional data exchange between MIKE 11
and ArcView. At its most basic level, MIKE 11 GIS requires information from a MIKE 11 model (river network), MIKE 11 flood
simulations and a Digital Elevation Model (DEM). Hence, based on the discrete information from MIKE 11, MIKE 11 GIS
constructs a grid based water surface and compares this data with the already available DEM to produce flood depth and
duration mapped surfaces. For this project, cell size of grids of DEM as well as flood inundation maps is 300m X 300m. Other
useful inputs are maps of rivers, infrastructure, property type, land use, satellite imagery and other more project specific data
(please see the scientific background of MIKE 11 GIS in Annex-C)
2.2.1 TOOLS USED FOR THE STUDY
MIKE 11 GIS has been utilized for the spatial presentation and analysis of one-dimensional (1D) flood model results. The MIKE
11 GIS system integrates the MIKE 11 river and floodplain modelling technologies with the spatial analysis capabilities of the
ArcView GIS.
MIKE 11
MIKE 11, developed by DHI Water & Environment, is a modelling package for the simulation of surface runoff, flow, sediment
transport and water quality in rivers, floodplains, channels and estuaries. The hydrodynamic module is commonly applied as a
flood management tool, simulating the unsteady flow in branched and looped river networks and quasi two-dimensional flow on
floodplains. Once a model is established and calibrated, the impact of changes of artificial or natural origin on flood behavior
can be quantified and displayed as changes in flood levels and discharges. MIKE 11 is based on an efficient numerical solution
of the complete non-linear St. Venant equations for unidirectional flows along the channel. Flood levels and discharges as a
function of time are calculated at specified points along the branches to describe the passage of flood flows through the model
domain.
MIKE 11 GIS
MIKE 11 GIS imports simulated water levels and discharges from MIKE 11 result files. Based on the discrete information from
MIKE 11 result file, MIKE 11 GIS constructs a raster grid based water surface and compares this data with topographic
information such as DEM to produce flood depth and duration mapped surfaces. The outputs of MIKE 11 GIS are compatible
with ArcView GIS. MIKE 11 GIS produces three types of flood depth data /maps:
• Flood depth (inundation) data /map.
• Flood depth duration data /map.
• Flood comparison map
Flood depth (inundation) data /map show the variation in flood depth over the floodplain, in sharp contrast to the flood-free
areas. Inundation maps provide a clear and concise picture of the depth and the extent of an inundation.
Flood depth duration data /map are similar to Inundation maps, but they also take into account the duration of the flooding.
Duration map indicates in each point, for how long the area has been inundated.
Flood comparison map shows the difference between two flood depth maps.
22. 16 Methodology
2.2.2 SELECTION OF EVENTS
The objective of the current investigation is to produce index base flood insurance products for Sirajganj District, statistical and
analytical analysis of floods in these areas for the last 30 years dating from 1978 to 2007 are carried out. As for the statistical
analysis for a particular event, at least 30 samples are required, therefore flood depths for each of the raster grid (300m X
300m) of the study area for monsoon period (June to October, 153 days) for the last 30 years are considered to be most
omportant input data. As such, flood depth data for 30 years have been generated using the hydrodynamic model results.
However, most common practice of categorizing flooding events into normal or average (flood of 1 in 2.3 years return periods),
moderate flood (1in 5 to 10 year return period), sever flood (1 in 25-49 years return period) and extremely sever flood (1 in 50-
100 year return period flood) is use of statistical analysis of water level, discharge or flood depth data of important location(s).
The present study, on the other hand, makes an attempt to use a statistical analysis of every 300m X 300m grids covering the
whole study area and would produce probability of certain types of flooding to be occurred for each of the grid points
considering flood depth and duration.
2.2.3 GENERATION OF FLOOD MAPS
In the next step, different types of flood maps would be prepared for selected different flooding scenarios for the selected
areas. Three types of flood maps have been prepared for each of the flood prone regions and these are:
• Flood depth maps for normal and extreme flooding scenarios.
• Flood depth duration map.
• Flood depth maps for calculating duration of inundation.
2.3 METHODOLOGY: FLOOD VULNERABILITY INDEX
2.3.1 CRITERIA FOR FLOOD VULNERABILITY
For producing any index based flood insurance products for a given region, ranking or scaling of flood vulnerability for different
flood scenarios should have to be carried out. Criteria for flood vulnerability have been introduced both in terms of flood depth
and flood duration. The accepted WARPO (Water Resources Planning Organization) classification in terms of flood depth has
been used for agricultural lands (Table 2-1). For households, flood depth more than 50 cm has been considered as flooding.
Flood depths and duration for any given flood event exceeding 30 cm and 3 days respectively have been taken into account to
address the vulnerability regarding the agricultural loss. Thus the inundations for a period of 3 days or longer with flood depths
higher than 30 cm threshold value have been taken into consideration in the calculation of flood vulnerability.
Vulnerability Index level 1 both for depth (31 to 60 cm) and duration (4 to 10 days) shown in Table 2 and 3 will signify the
agricultural loss, while Vulnerability Index higher than 1 will refer the loss in agriculture, homestead, and others. However, loss
depends on landuse patterns also; the presented or proposed Indices only take into account the depth and duration of flood.
Therefore, the indices are not fully object oriented; rather they represent the flooding scenario in terms of different combination
of flood depth and duration for the project area.
Table 2-1: Agricultural land classification in terms of flood depth
Land classification Depth of flooding (meter)
F0 0.01 – 0.30
F1 0.30 – 0.90
F2 0.9 – 1.80
F3 1.80 – 3.60
F4 > 3.60
23. Index Based Flood Insurance Products: Report on Flood Hazard Model for Sirajganj District 17
Vulnerability Index (depth of flooding)
To take account the agricultural land classification shown in Table 2-1 into the Vulnerability Indexing, new scales have been
proposed in this study which is different from the scale used in one of IWM’s previous study (IWM, 2007). Vulnerability Index
based on depth of flooding would be calculated using the scale shown in Table 2-2 and Table 2-3.
Table 2-2: Vulnerability scale for depth of flooding Table 2-3: Vulnerability scale for duration of flooding
Depth (cm) Scale Duration (Days) Scale
0 – 30 0 0–3 0
31 – 90 1 4 – 14 1
91 – 180 2 15 – 30 2
181 – 360 3 31 – 45 3
361 – 560 4 46 – 60 4
561 – 760 5 61 – 90 5
> 761 6 > 91 6
Vulnerability Index (duration of flooding)
The Vulnerability Index has also been derived based on duration of flooding. The scales used to calculate Vulnerability Index
as regards duration of flooding have been provided below in Table 2-3.
With aim of this certain criteria have been devised to rank each and every grid (300m X 300m) depending on its vulnerability to
flooding. Methodologies have been developed to calculate Vulnerability Index based on both duration and depth of flooding.
Finally, combined vulnerability index has been calculated by adding the Vulnerability Index for duration of flooding and
Vulnerability Index for depth of flooding. Here a clear distinction between the agricultural land classification done by WARPO
and the depth-duration ranges considered for indexing flood vulnerability should kept in mind. However, overlaying the flood
vulnerability maps on agricultural land type classified map based on criteria shown in Table 2-1 and other land use pattern
areas (homestead, city, agricultural, non-agricultural land, perennial or terrestrial water body (beel /haor), etc.), overall hazard
status or indices have been figured out.
Vulnerability Index (combined)
The combined Vulnerability Index of each land type (agricultural or land use type) would be calculated by taking the average
value of two Vulnerability Indices (for duration and depth of flooding). Thus equal weights have been assigned on both the
Vulnerability Indices during the calculation of combined vulnerability.
Now the methodology is going to be presented here which has been adopted in this study to produce Flood Vulnerability Index
Map for a particular year as well as probabilistic Vulnerability Index Map considering 30 sets of yearly Vulnerability Index Maps.
24. 18 Methodology
2.3.2 YEARLY INDEX MAP
There are as many as 152 daily Flood Maps are produced for every monsoon (June 01 to Oct 30) over the period of 1978 to
2007. At first step, these 152 Flood Maps are re-classified to Depth Scale Maps in which flood depths are changed to scale 0 to
6 depending on the ranges of depth assigned for each scale. The vulnerability scale for depth of flooding is shown in Table 2-2.
Then a recurrence analysis is done for each depth scale; like how many days a particular cell is experienced to a particular
depth scale out of 152 days. This recurrence analysis actually gives the duration of a particular depth scale for a certain cell.
Thus it produces 6 Duration Maps, each of which corresponds to particular Depth Scale. There remains a limitation regarding
the duration which has been found
after recurrence analysis. It does not
give any idea of how many days out of
total days found are consecutive.
Nonetheless, uncertainty regarding
consecutive or non-consecutive
duration for a particular depth scale is
ignored here. It just accounts the total
number of days irrespective of whether
it is in early monsoon, mid of the
monsoon or late monsoon.
The next step is to classify these 6
Duration Maps for 6 Depth Scale
according to the vulnerability scale for
duration of flooding shown in Table
2-3. It has now produces 6 Depth-
Duration Scale Maps in which for each
depth scale (0 to 6), duration scales (0
to 6) are attained. In other words, for
unique depth scale duration scale are
attained for each cell.
The combined Vulnerability Index is
calculated by taking the average value
of two Vulnerability Indices (for
duration and depth of flooding).
Meanwhile, 6 sets of Vulnerability
Figure 2-1: Flow diagram showing methodology to produce Vulnerability Index Map us-
ing daily flood maps for 152 days of monsoon period. Index maps are produced with a
combination of different depth and
duration scales. Returning the maximum value of combined 6 Vulnerability Index Maps, final Vulnerability Index Map has been
found. This is the Vulnerability Index Map been produced for a particular year and can be called as Yearly Vulnerability Index
Map.
Now, the Vulnerability Index Maps which have been generated under this study, however, only represent the degree of flooding
scenario for a particular year in which combined effect of Depth and Duration are only summed up by averaging the two
corresponding scales. That’s why the combined Vulnerability Index considering both Depth and Duration scale can be found for
different matrices of Depth and Duration Index. For instance, for Vulnerability Index 2, it can be formed either for Depth Scale 1,
Duration Scale 3; or Depth Scale 2, Duration Scale 2 and Depth Scale 3, Duration Scale 1. Whether the impacts in terms of
loss regarding these various sets of Depth-Duration Index are same or not; how much it is varied from each other that might be
an interesting research to be carried out in future. But at this moment, all three sets of Depth-Duration Index are assigned as 2.
This is the first approach being taken into account for finding combined Vulnerability Index. The second approach is to
25. Index Based Flood Insurance Products: Report on Flood Hazard Model for Sirajganj District 19
reclassify the ranges of combined Index into a certain Index value. In this case, higher value either for Depth Scale or Duration
Scale is given more weightage for setting a combined Index. Table 2-4 show the ranges of averaged or combined scale which
finally are come up with a single value of Vulnerability Index.
Table 2-4: Unique Index Assigned for Combined or Averaged Depth-Duration Index
Combined or Averaged Unique Index
Depth-Duration Index Assigned
0 – 0.49 0
0.5 – 1.49 1
1.5 – 2.49 2
2.5 – 3.49 2
3.5 – 4.49 4
4.5 – 5.49 5
5.5 – 6 6
2.3.3 PROBABILISTIC VULNERABILITY INDEX MAP
After completing the generation of Yearly Vulnerability Index Maps for 30 years where index are assigned as 0, 1, 2 to 6, again
a recurrence analysis for each and every index are performed for those maps. Like how many years out of 30 years every
raster grid or cell covering the whole study area is found of a particular index value. And then analysis is limited to two
probability of flooding scenario; 75% and 50% probability. 75% Probabilistic Vulnerability Index Map show the Index for each
cell which has been found at least 22 years out of 30 years. The same is for 50% Probabilistic Index Map where it accounts 15
years out of total 30 years. Thus two Probabilistic Vulnerability Index Maps are produced. Recurrence analysis has been done
using spatial analyst utility of ESRI ArcGIS.
2.4 DATA AND INFORMATION USED
The basic data required for the development of the Hydrodynamic Model has described as following:
2.4.1 FOR RAINFALL-RUNOFF MODEL DEVELOPMENT
• Catchment information (area, physical characteristics, different surface, sub-surface, ground water, irrigation parame-
ter values);
• Time series rainfall, actual evaporation (evapotranspiration, ET0), irrigation abstraction data.
2.4.2 FOR HYDRODYNAMIC MODEL DEVELOPMENT
• Surveyed cross-section data for main rivers as well floodplain channels;
• Floodplain information (physical features, flood cell, area-elevation data, etc.);
• Information on river dikes or embankment, control structures, culverts and bridges;
• Time series measured or estimated boundary data (discharge for upstream boundary and water level for downstream
boundary);
• Output of Rainfall-Runoff Model (time series catchment runoff data) which are distributed along the river and flood-
plain channels and also in some cases as a point sources for certain location of a main model river;
• Roughness and vegetation characteristics of the river and floodplain system;
26. 20 Methodology
• Measured water level data at the regular measurement stations inside the project area to calibrate the model.
2.4.3 FOR FLOOD MAP GENERATION
• Digital Elevation Model (DEM) of the project area. DEM of smaller resolution (e.g. 50m X 50 m or 100m X 100m)
would be preferable;
• Satellite flood images for the verification of flood water extension or spreading over the floodplain area as well as on
other land type during high flood scenario;
• Measured water level data at the regular and /or newly installed measurement points on the flood-plain area to cali-
brate the flood map (flood depth and duration verification).
27. 3 DEVELOPMENT OF FLOOD HAZARD MODEL
3.1 INTRODUCTION
As it has been mentioned before, the present study aims to produce daily flood inundation maps/ data for Sirajganj District
during flood season (June to October) over the period of 1978 to 2007. As such, a dedicated one-dimensional hydrodynamic
model for the project area is developed. The developed dedicated one-dimensional model incorporates more and detail
information on physical settings of the hydrology (rainfall, evaporation, incoming and outgoing discharge to the system) and
hydrometric network (river, floodplain, water and other types of infrastructures, etc.) of selected model domain area.
Existing FFWC Super Model is taken as the base model for dedicated Sirajganj Flood Hazard Model development. Basically,
the dedicated model is a cut model of Super Model, therefore the hydrological model setup (catchment size and characteristics,
rainfall and evapotranspiration distribution, land cover and soil characteristics, soil moisture content and abstraction, etc.) as
well as the basic hydrodynamic model setup remain same. However, flood propagation route through floodplain and its
connectivity /disconnectivity to the main channels, perennial or non perennial water storage, and flood cells are included in the
dedicated model to represent the geo-physical settings of river-floodplain interaction and flooding scenario of the project in a
better way. Boundary data for cut or dedicated model are generated from FFWC Super model results simulated for 30
consecutive years (from 1978 to 2007). The present chapter presents a description of existing Super Model setup first. Then it
describes the activities done regarding the development of Sirajganj dedicated or cut model. To note that, dedicated or cut
model is mentioned as Sirajganj Flood Hazard Model afterwards.
28. 22 Model Development
Figure 3-1: River network of FFWC Super Model
3.2 EXISTING SUPER MODEL
The Flood Forecasting and Warning Center (FFWC) of
Bangladesh Water Development Board (BWDB) operates
a real time numerical model based on one dimensional
fully hydrodynamic model (MIKE 11 HD) incorporating all
major rivers and floodplains of the country.
The hydrodynamic model is linked to a lumped conceptual
rainfall-runoff model (MIKE 11 RR) which generates
inflows from catchments within the country. FFWC usually
collects real time hydro-meteorological data and simulate
the numerical model routinely throughout the monsoon
season FFWC also takes account of the satellite images &
information as well as rainfall and water level data from
Ganges-Brahmaputra-Meghna (GBM) basins outside the
country for boundary estimation. The model covers most of
the flood prone areas of the country and is now used to
provide 24, 48 & 72 hours forecasts to a total of 69
stations. The flood warning is developed and disseminated
to a wide range of user including Government and non-government sectors. The river network of FFWC Model is shown in
Figure 4.
The FFWC super model is updated based on topographic and infrastructure information of 2007 or earlier. The present status
of the super model has been described in the following sections. The FFWC super model is updated based on topographic
and infrastructure information of 2007 or earlier. The present status of the super model has been described in the following
sections.
3.2.1 HYDRO-METEOROLOGICAL DATA INPUT
For real time flood forecasting purposes hydro-meteorological data is required for inside as well as outside the country. FFWC
collects data from three sources: BWDB gauge data, additional gauge data and remote sensing data which are incorporated in
the FFWC super model for routine operation of flood forecasting. BWDB gauge data includes 82 (presently 73) water level and
58 rainfall stations (presently 56) data which are measured manually and transmitted by either radio or mobile phone to FFWC
daily morning.
Additional data includes Indian and Nepalese data through the Joint River Commission (JRC), Bangladesh. The JRC provides
water level data at 13 stations within India and 4 stations within Nepal (IWM, 2009, SMReport).
Remote Sensing Data includes Satellite images and RADAR images. Satellite data are captured through internet from a variety
of secondary sources. Rainfall radar images are provided by BMD via microwave link to FFWC from each of the country’s radar
sites at Dhaka, Khepupara, Cox’s Bazar and Rangpur.