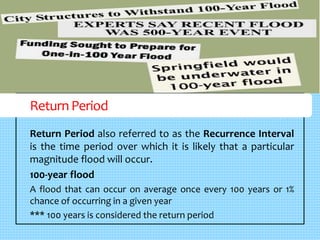
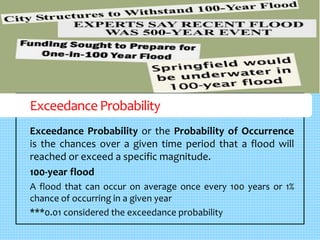
Downloaded 223 times

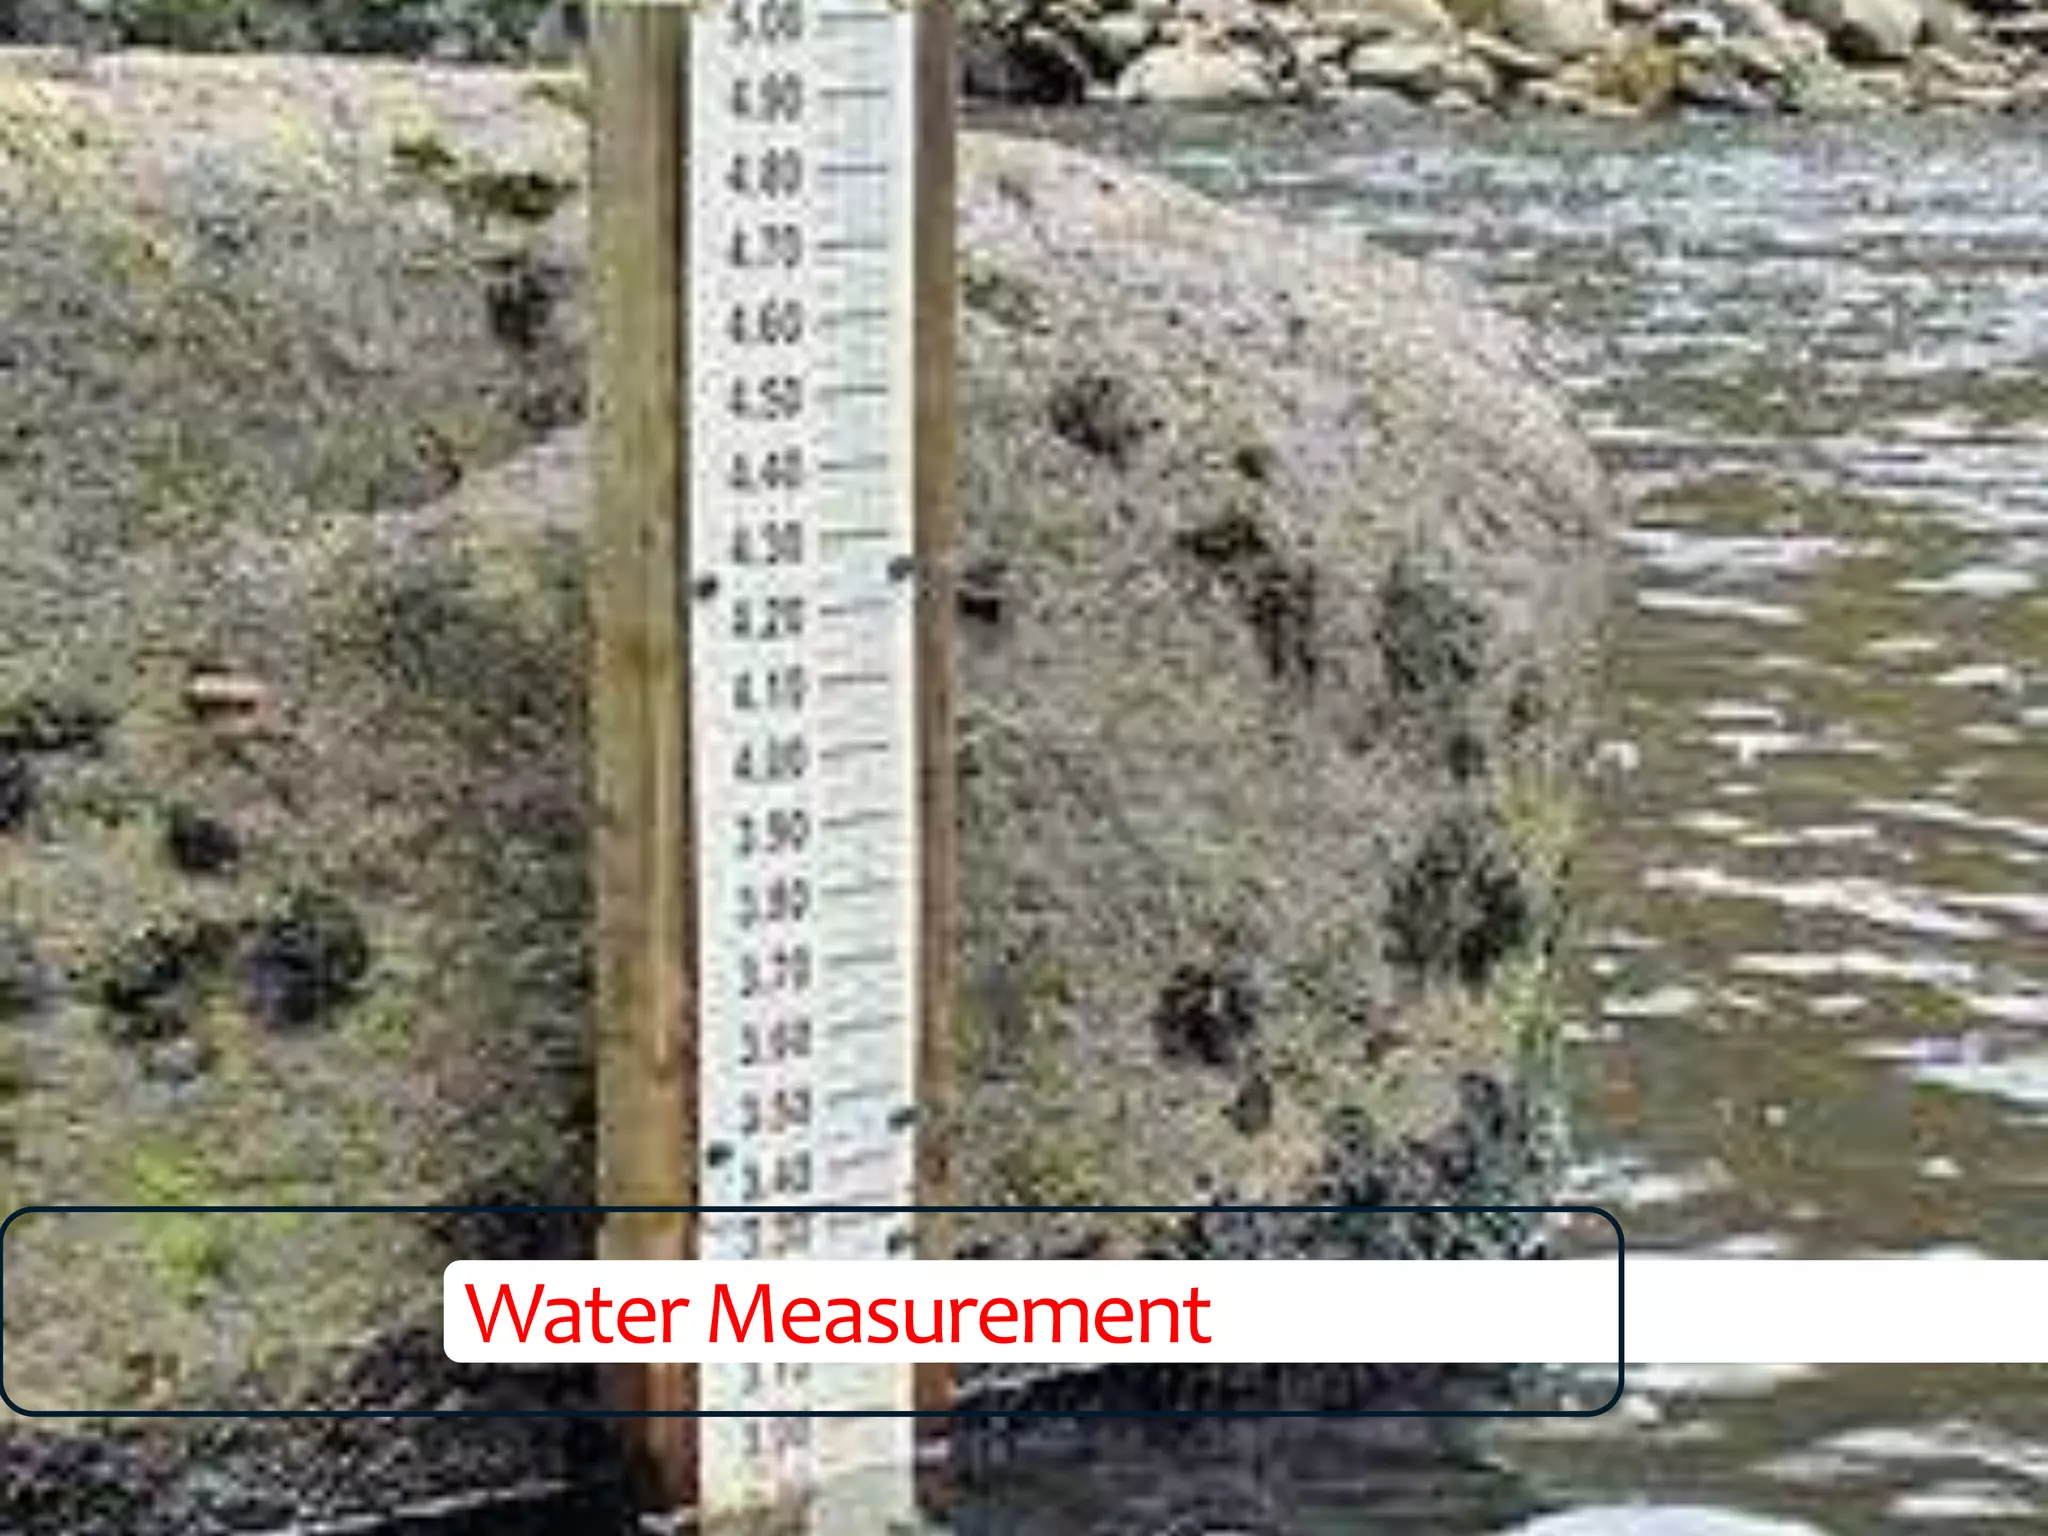
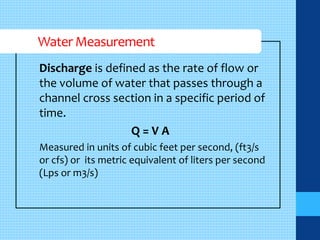
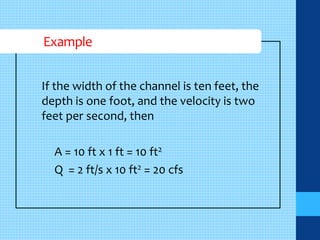
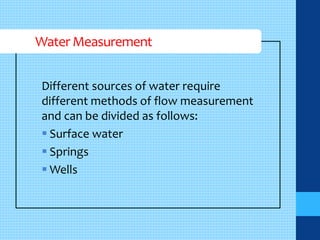
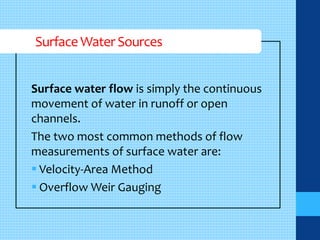
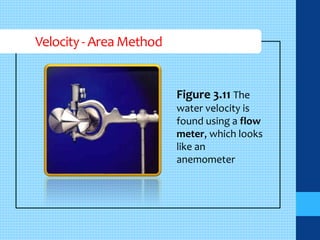
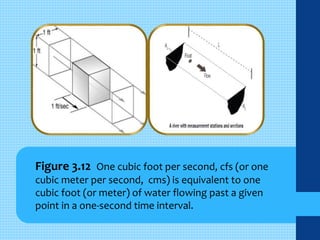
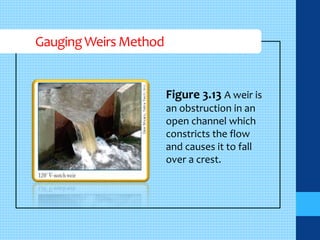
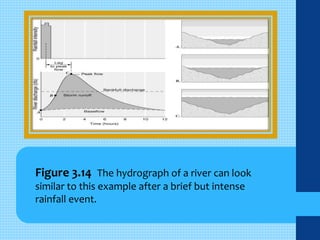


Water flow is measured to assess water supply and flow through systems. Discharge is the rate of water flow passing through a cross section per time unit. It is calculated by multiplying water velocity by the cross-sectional area. Surface water flow measurement methods include the velocity-area method and weir gauging. Rating curves relate river discharge to stage. Flood frequency analysis uses historical flood records to predict future flood magnitudes and recurrence intervals.