Downloaded 743 times

![Observations and variablesVariablecharacteristic measured for each sampling unit, e.g. [P]more than one variable can be measured for each sampling unit, e.g. [P], [T], Wind etc.Observationsvalue of a variable for each sampling unit e.g. [P]](https://image.slidesharecdn.com/hydrologymeasuringrain-101214050342-phpapp01/85/Hydrology-measuring-rain-13-320.jpg)
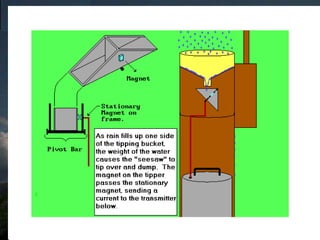
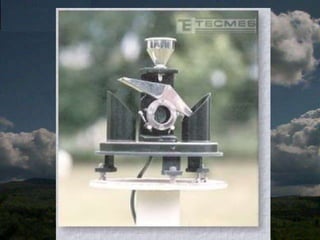
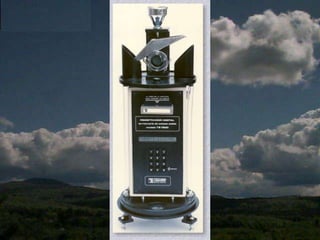
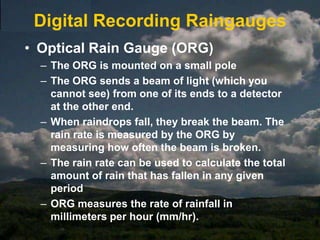
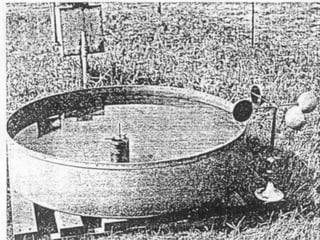
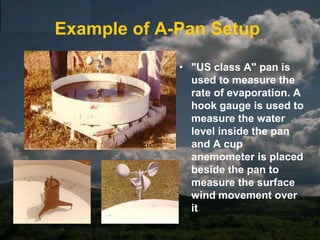
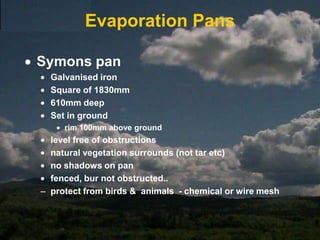
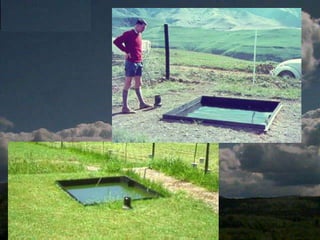
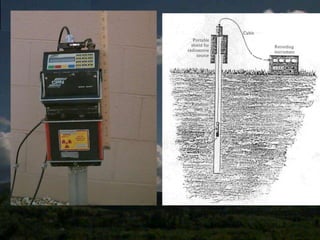
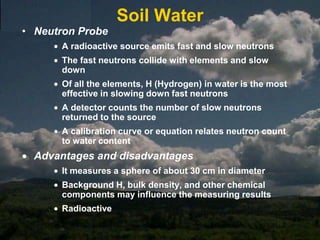
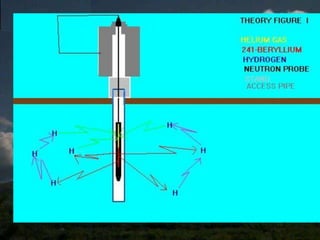
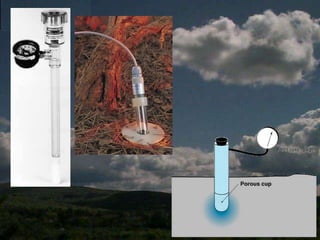

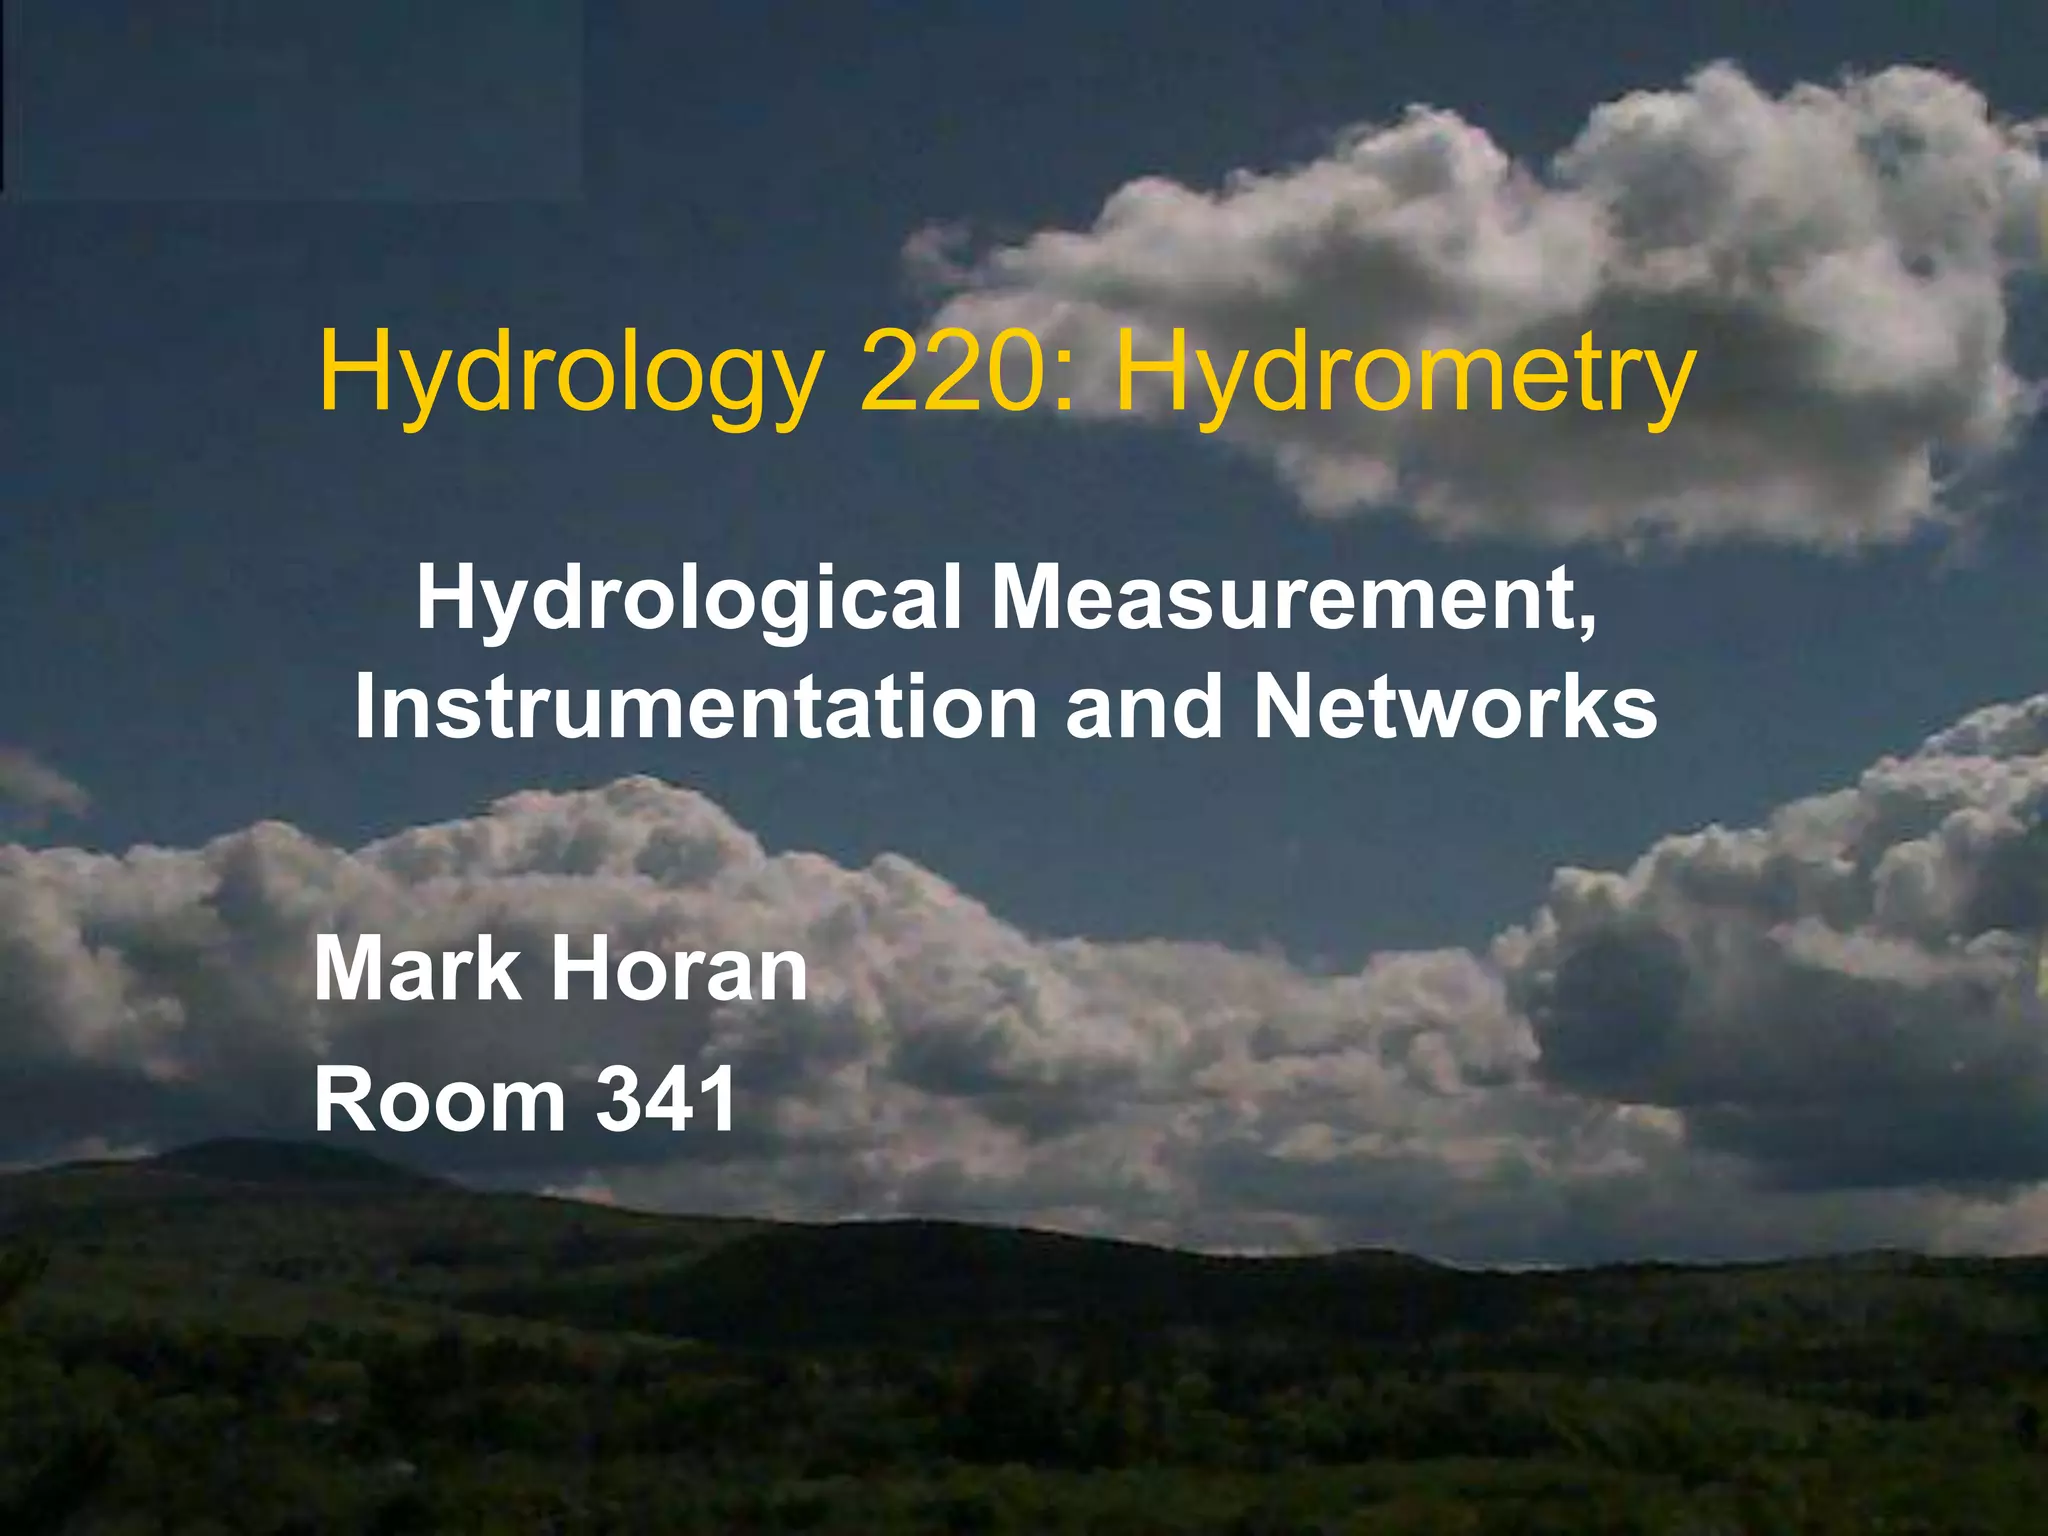
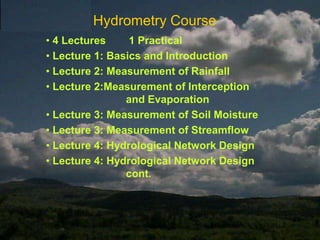
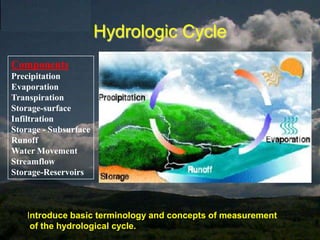
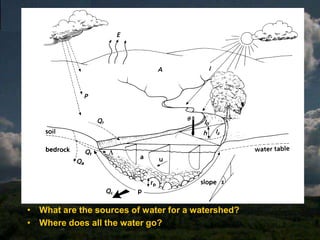
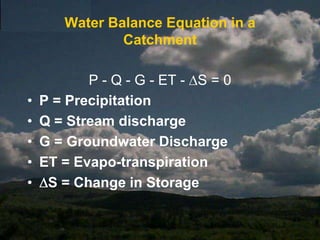
This document provides an overview of a hydrometry course covering measurement of various components of the hydrological cycle including precipitation, evaporation, soil moisture, and streamflow. It discusses different types of instruments used to measure these variables such as raingauges, evaporation pans, neutron probes, tensiometers, and current meters. Measurement methods include manual observation as well as automated data recording using devices like data loggers. The goal is to introduce concepts and terminology for quantifying water in the hydrological cycle.