Downloaded 1,338 times
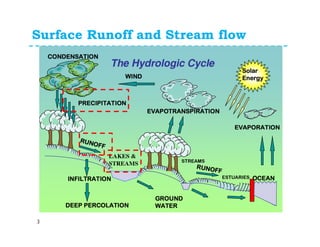
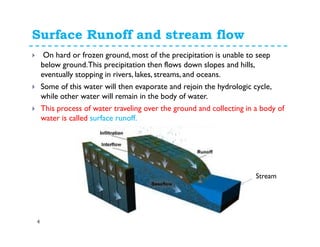
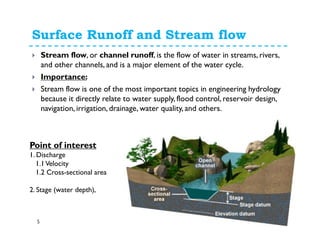
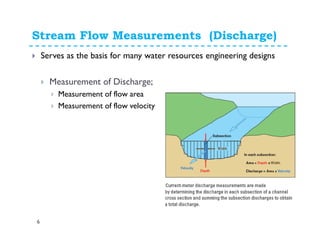
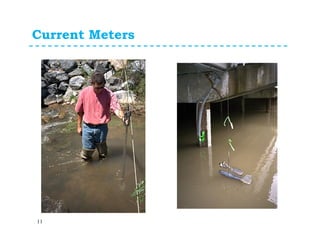
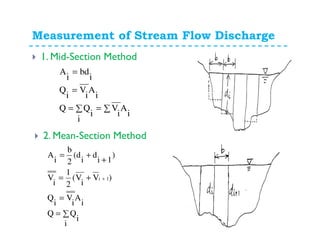
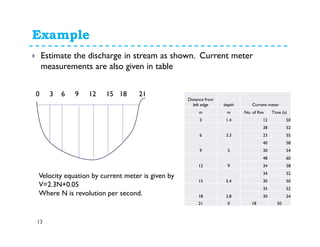
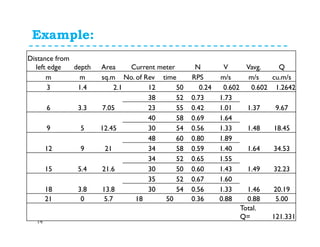
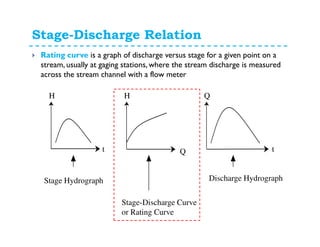
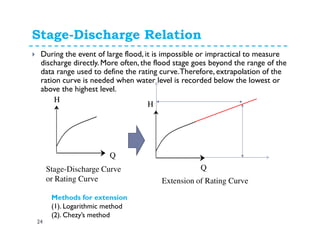
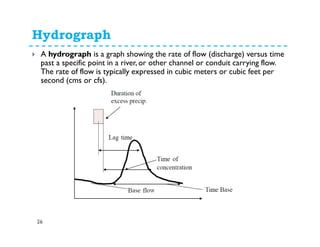
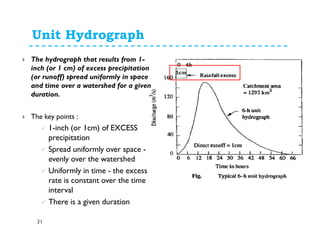
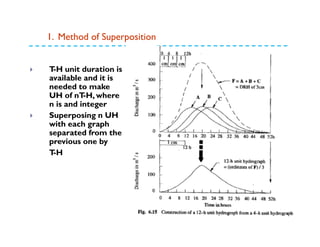
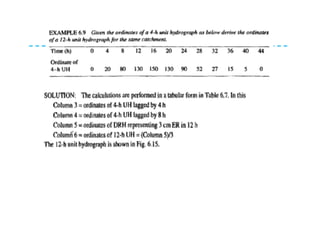
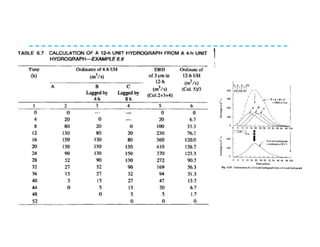
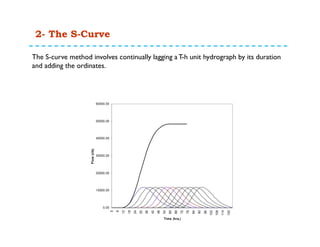
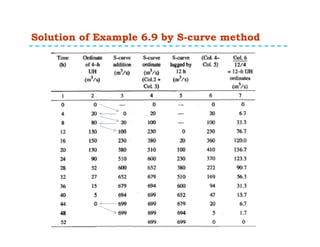
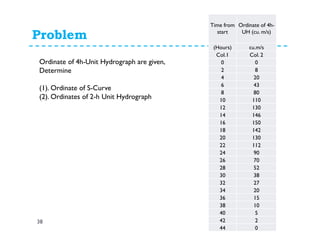
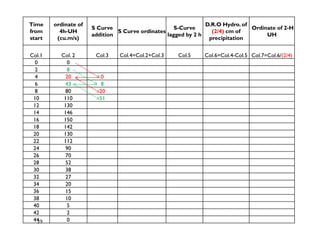


This document discusses surface runoff, stream flow, hydrographs, and unit hydrographs. It begins by defining surface runoff and stream flow, explaining that surface runoff occurs when precipitation is unable to infiltrate the ground and flows overland into streams, rivers, and other bodies of water. It then discusses measuring stream flow through various methods like current meters and weirs to determine discharge. The document introduces the concept of hydrographs, which plot discharge over time, and unit hydrographs, which represent the hydrograph resulting from 1 unit of excess precipitation. It provides examples of using unit hydrographs and the S-curve method to develop hydrographs of different durations.


![Engineering Economics: Solved exam problems [ch1-ch4]](https://cdn.slidesharecdn.com/ss_thumbnails/solvedexamproblemsch1-ch4-200220070043-thumbnail.jpg?width=640&height=640&fit=bounds)