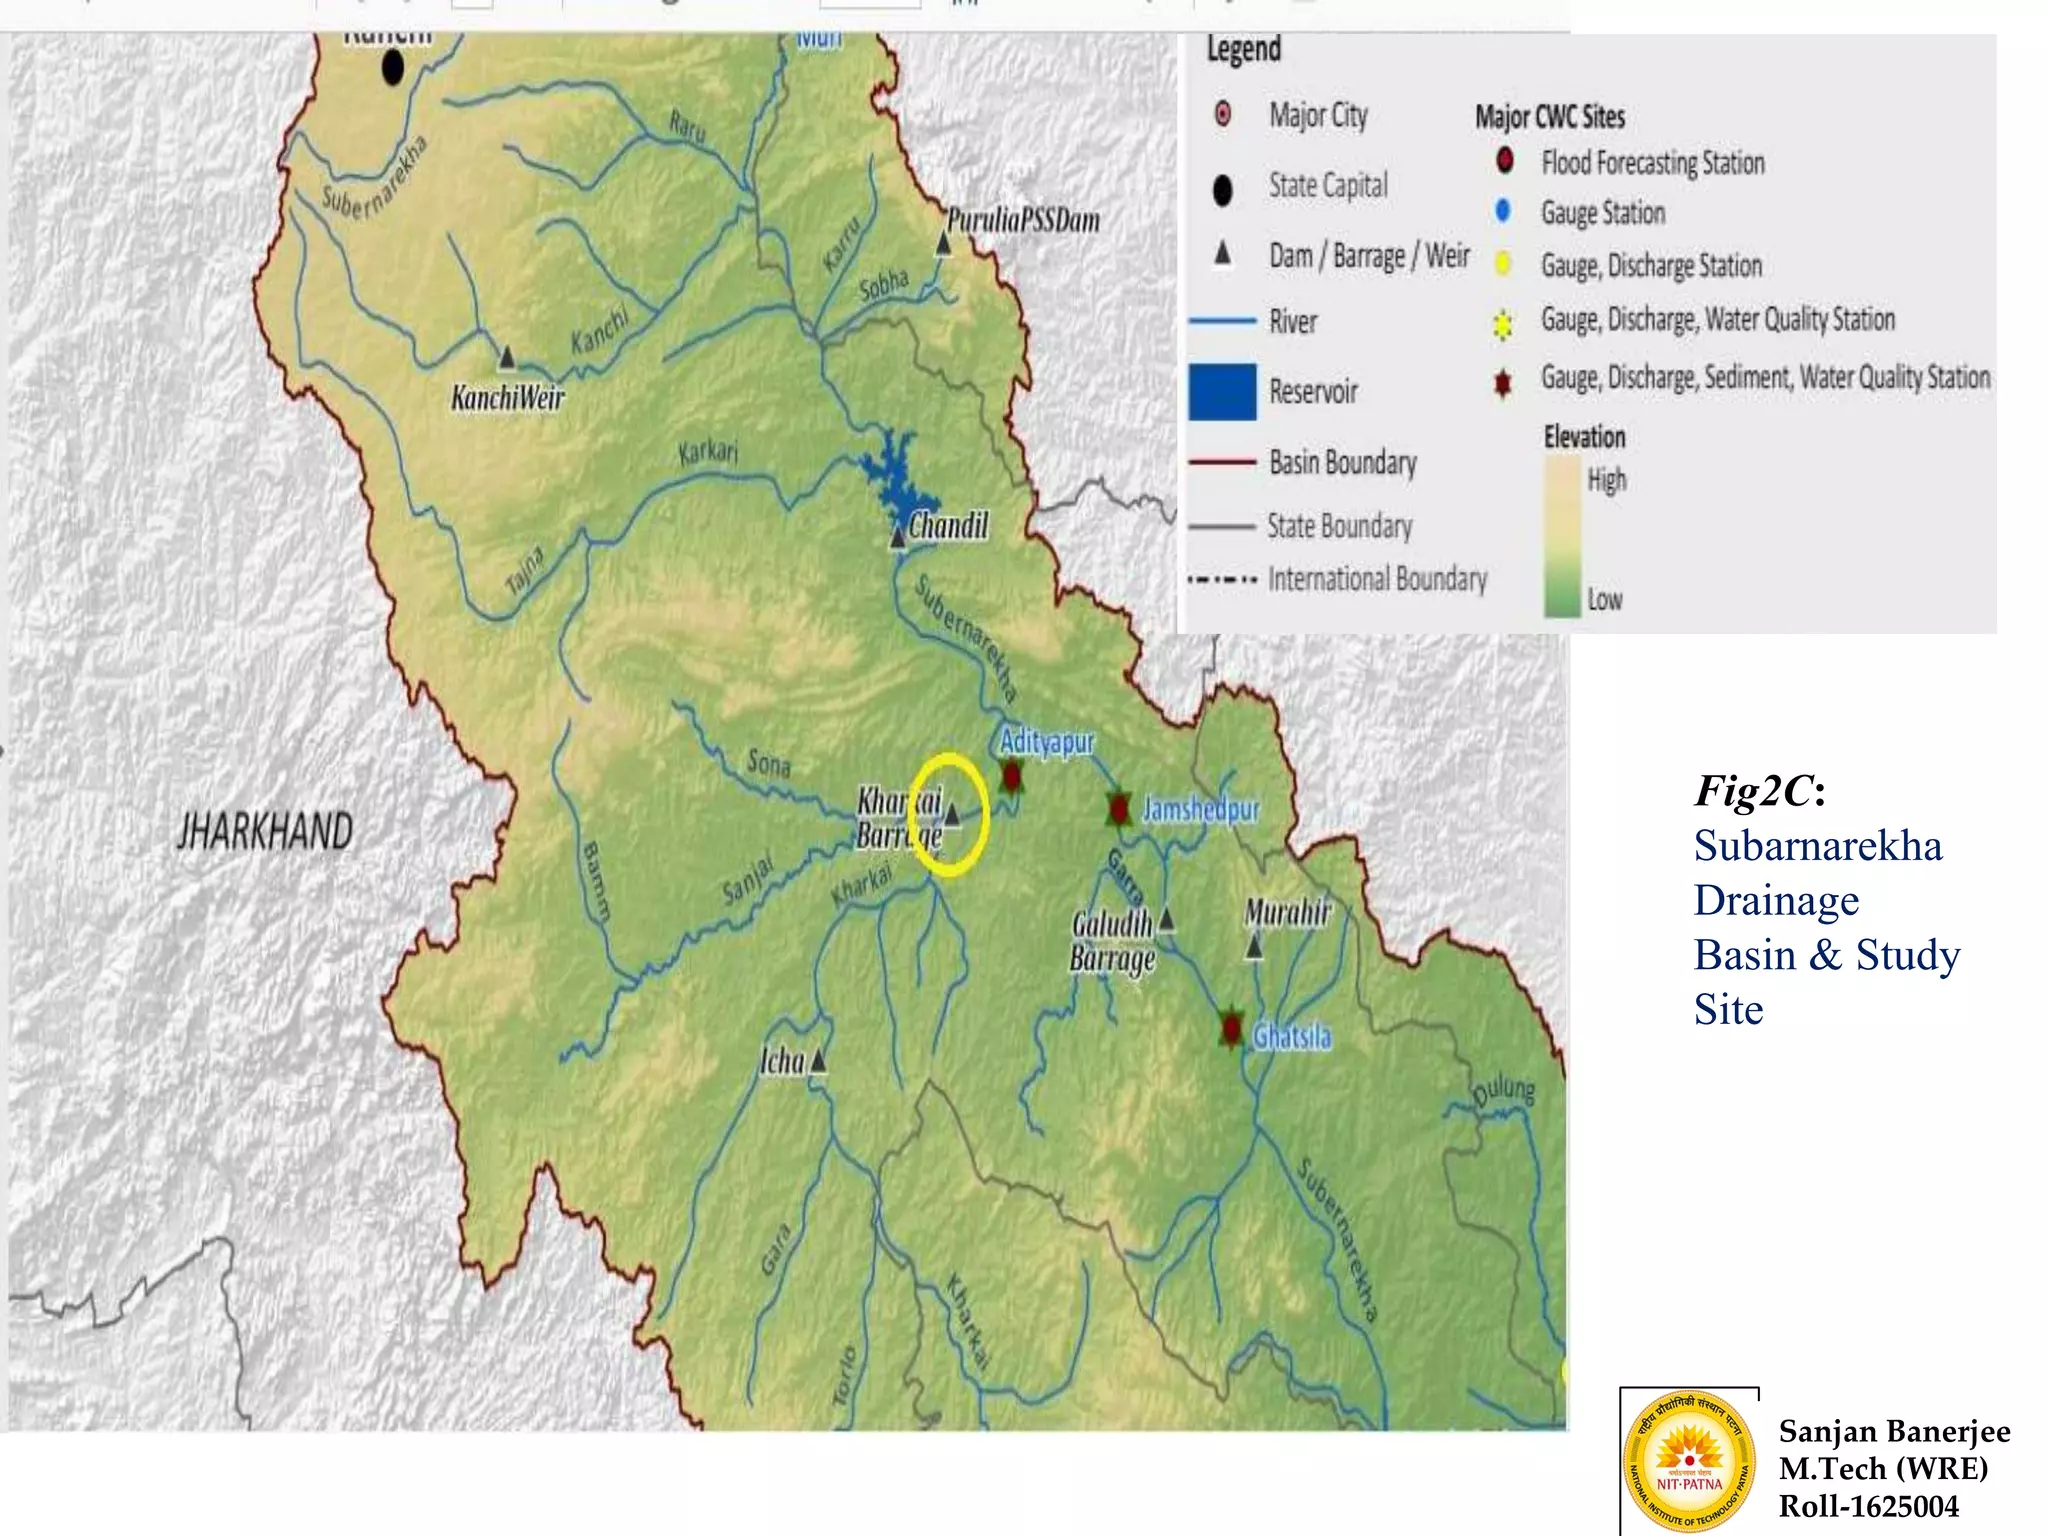
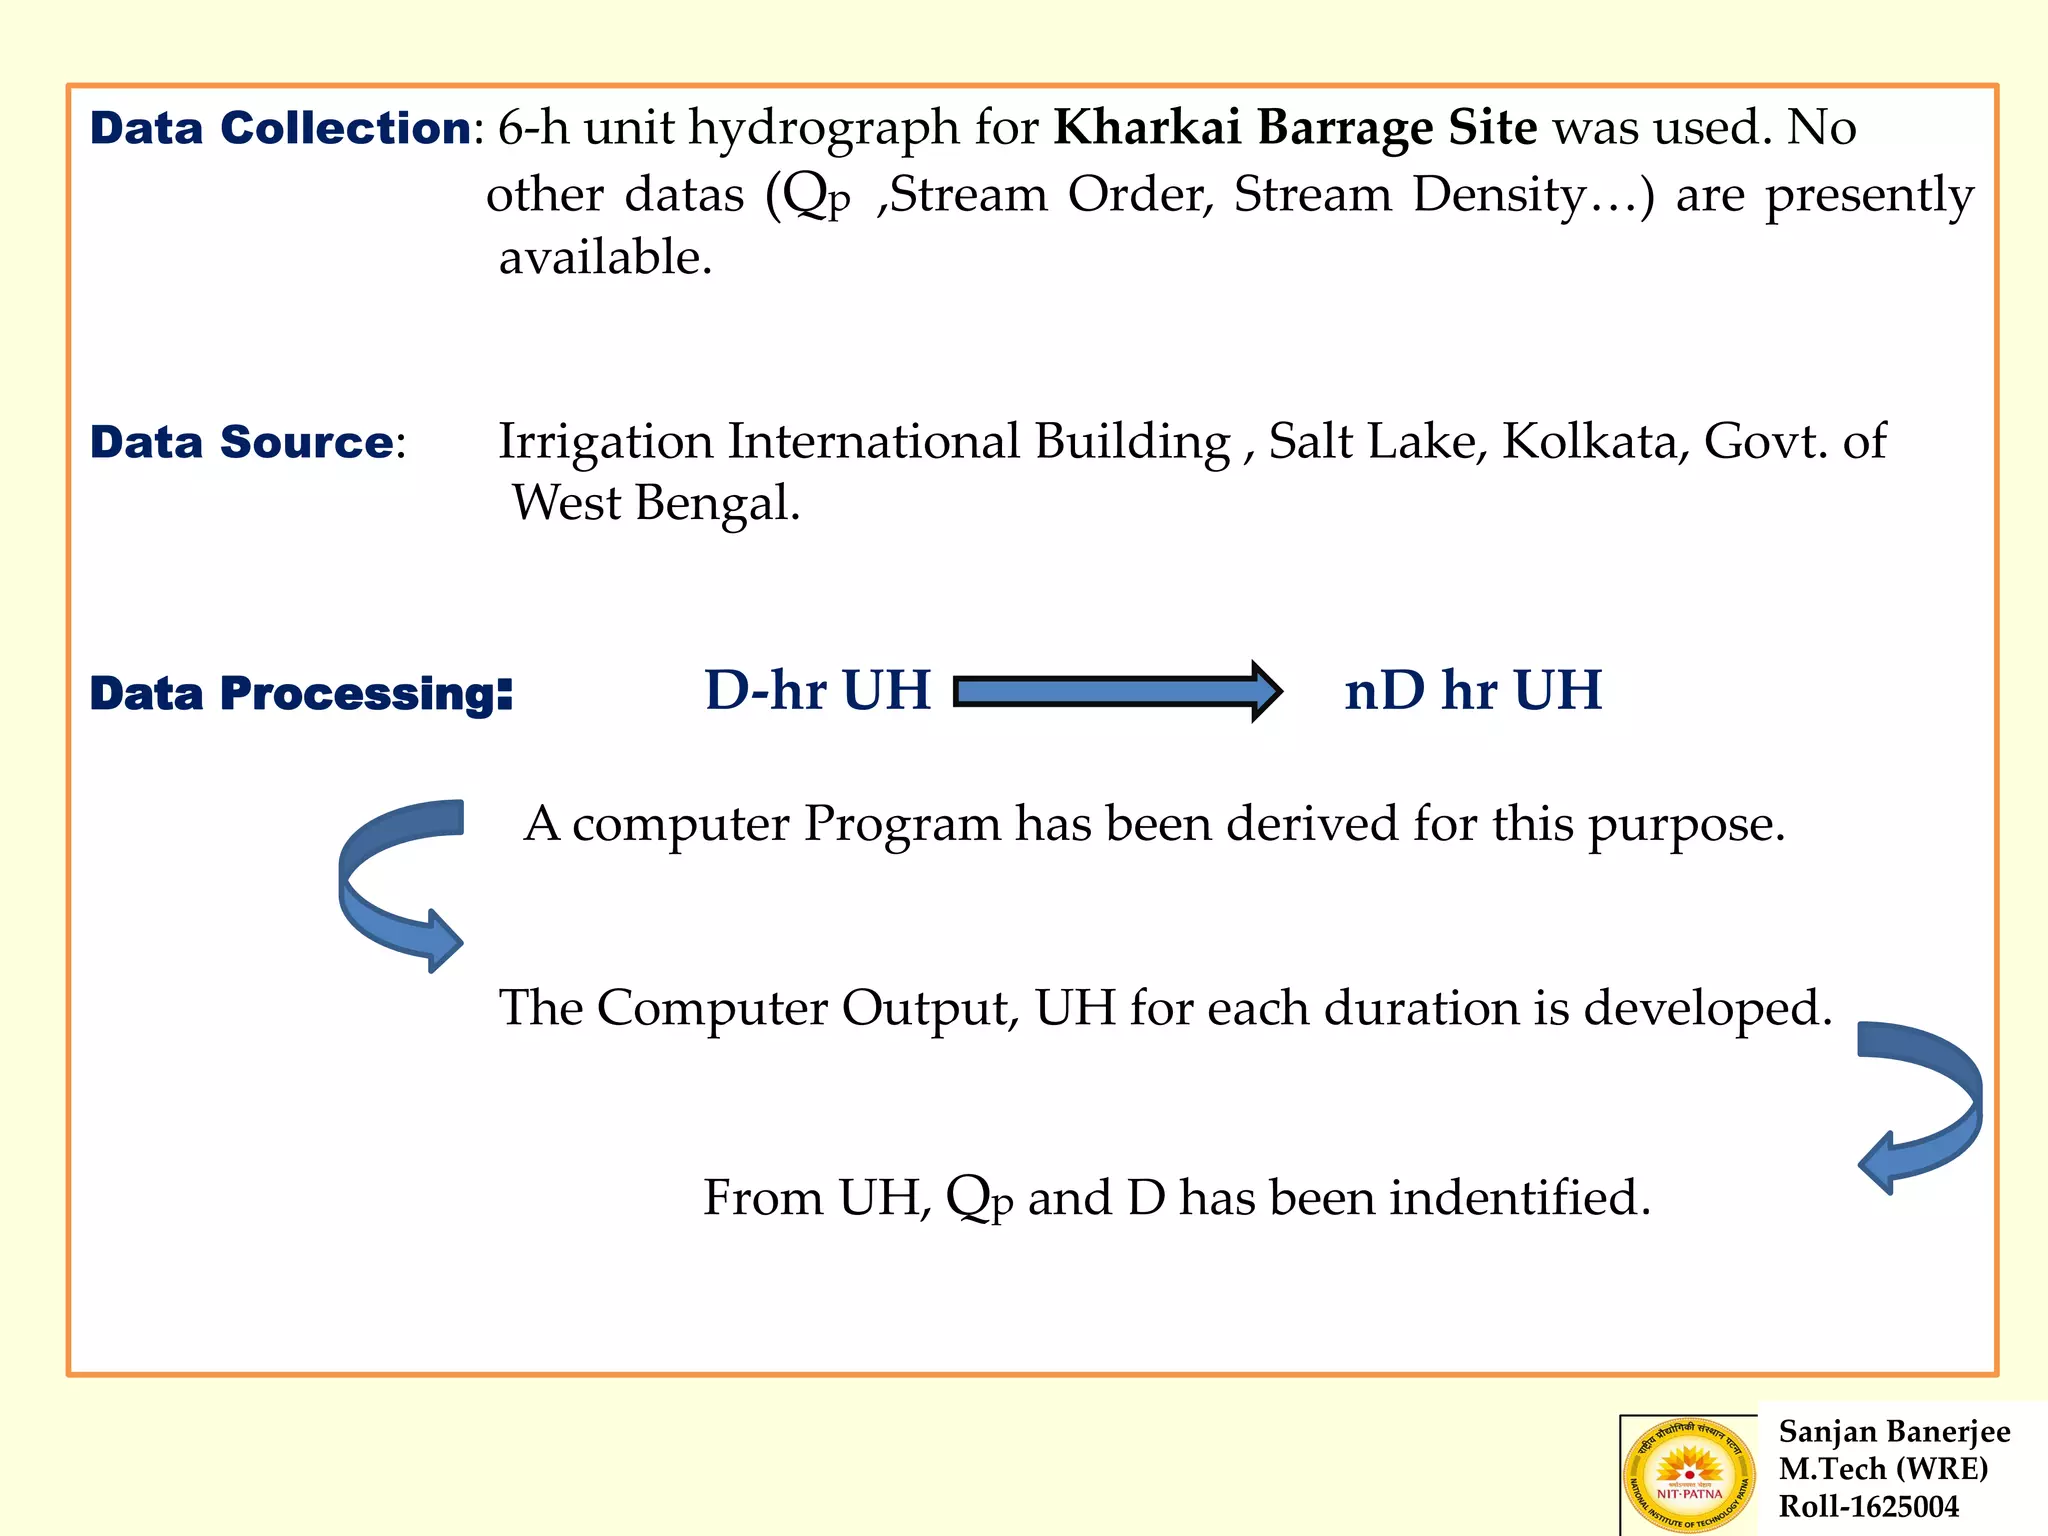
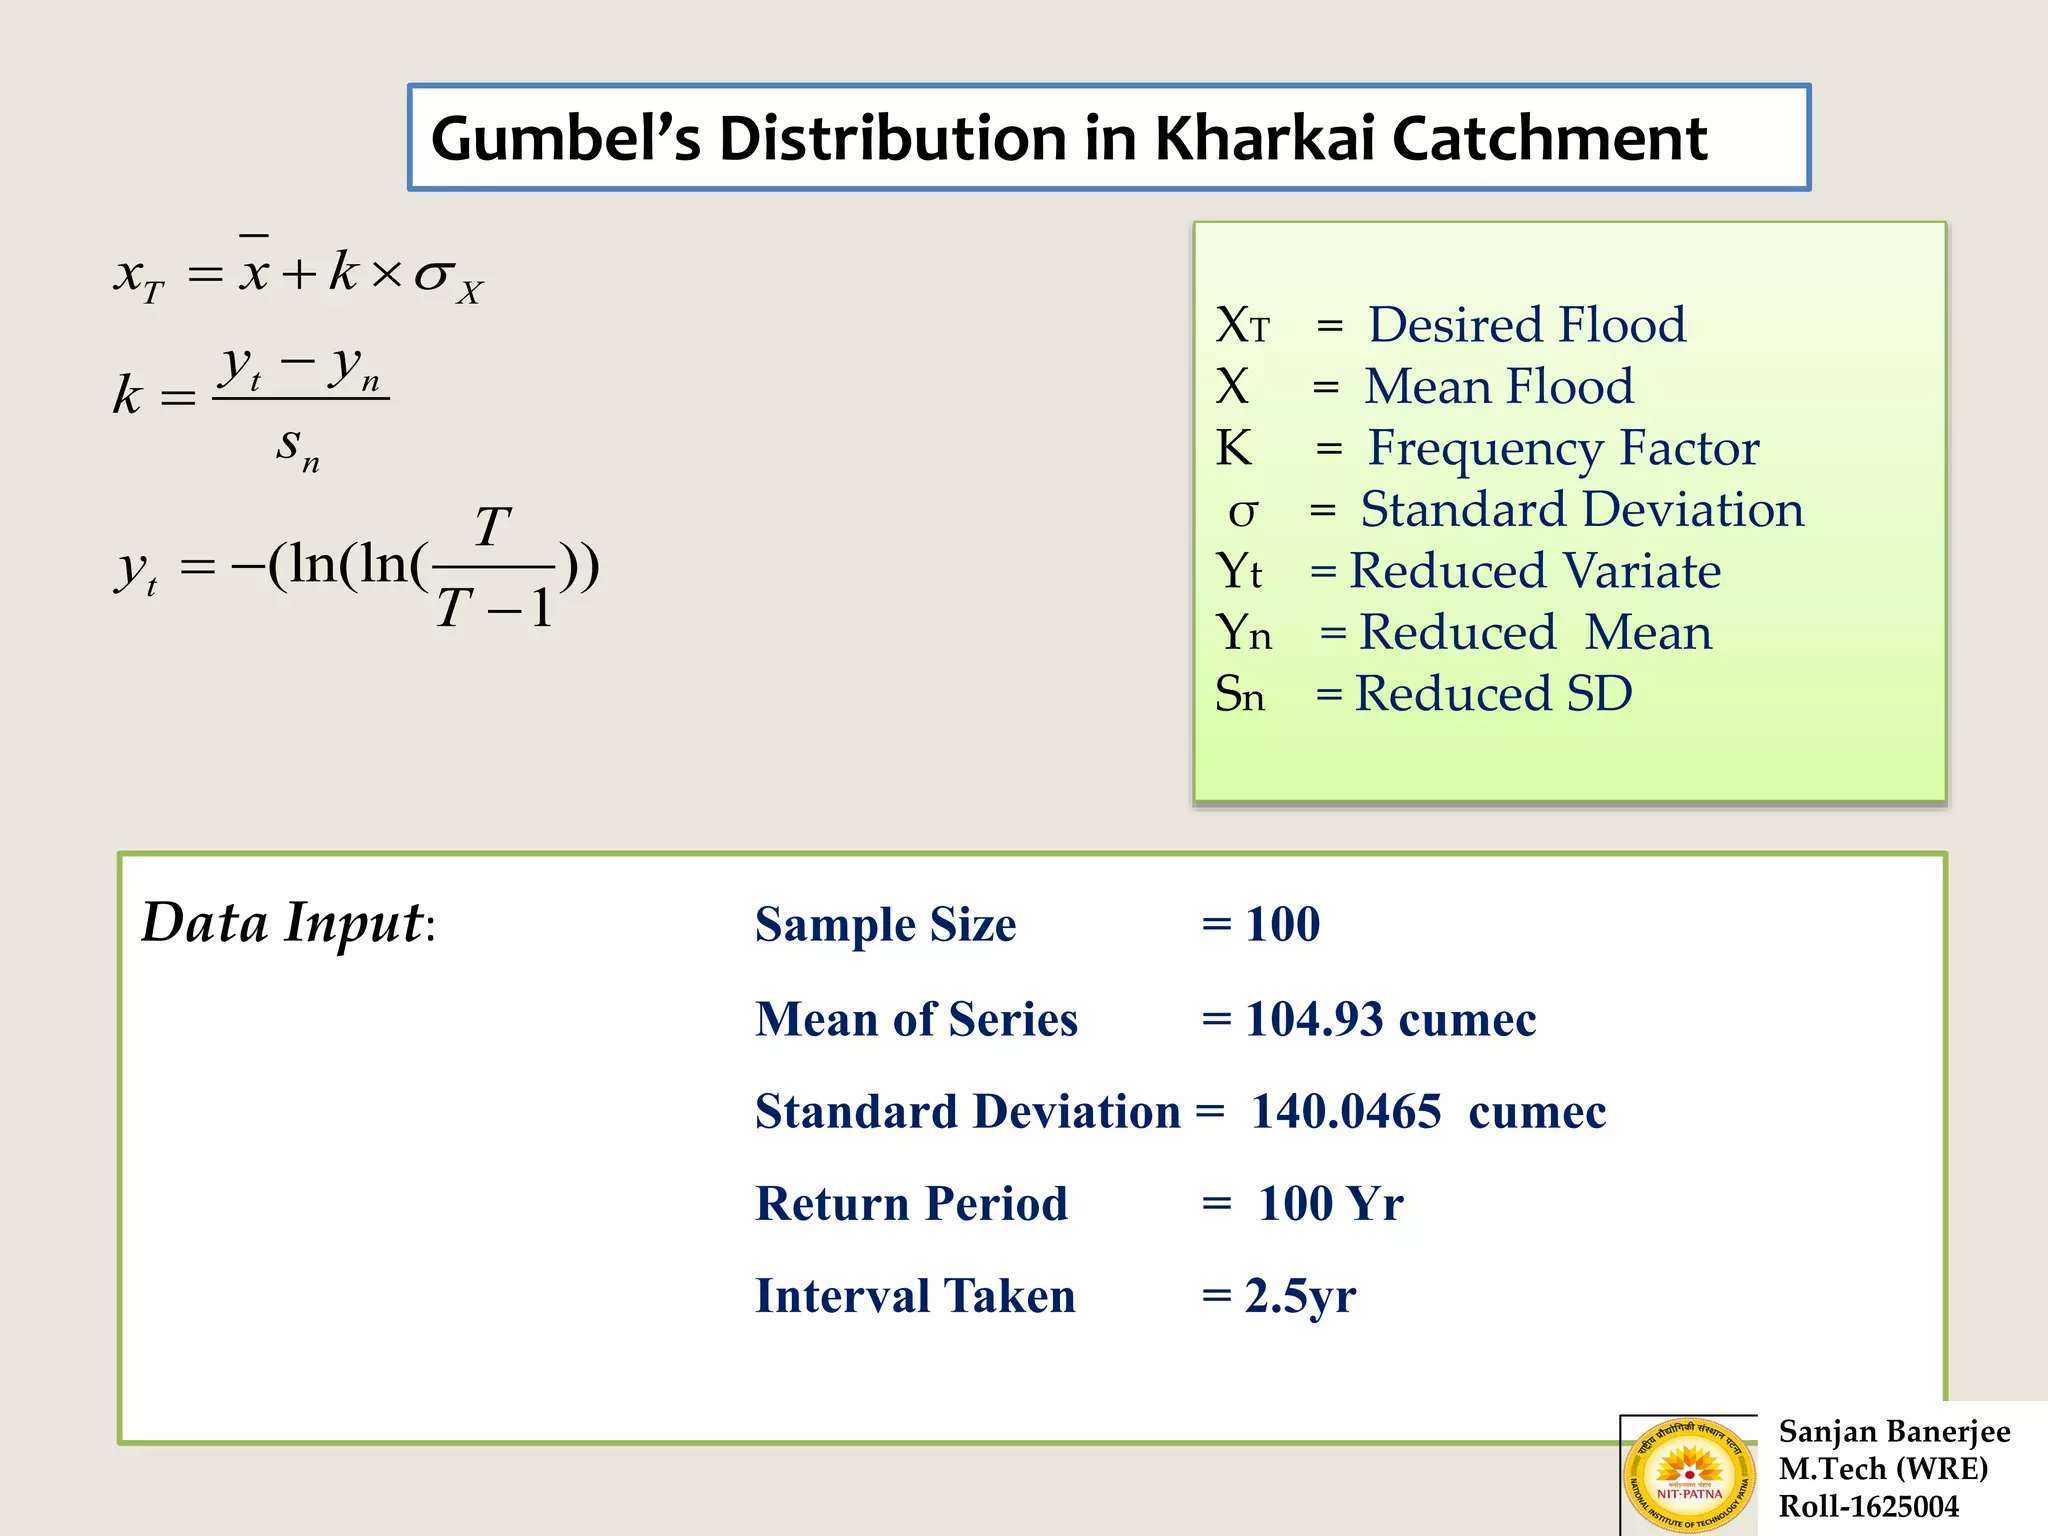
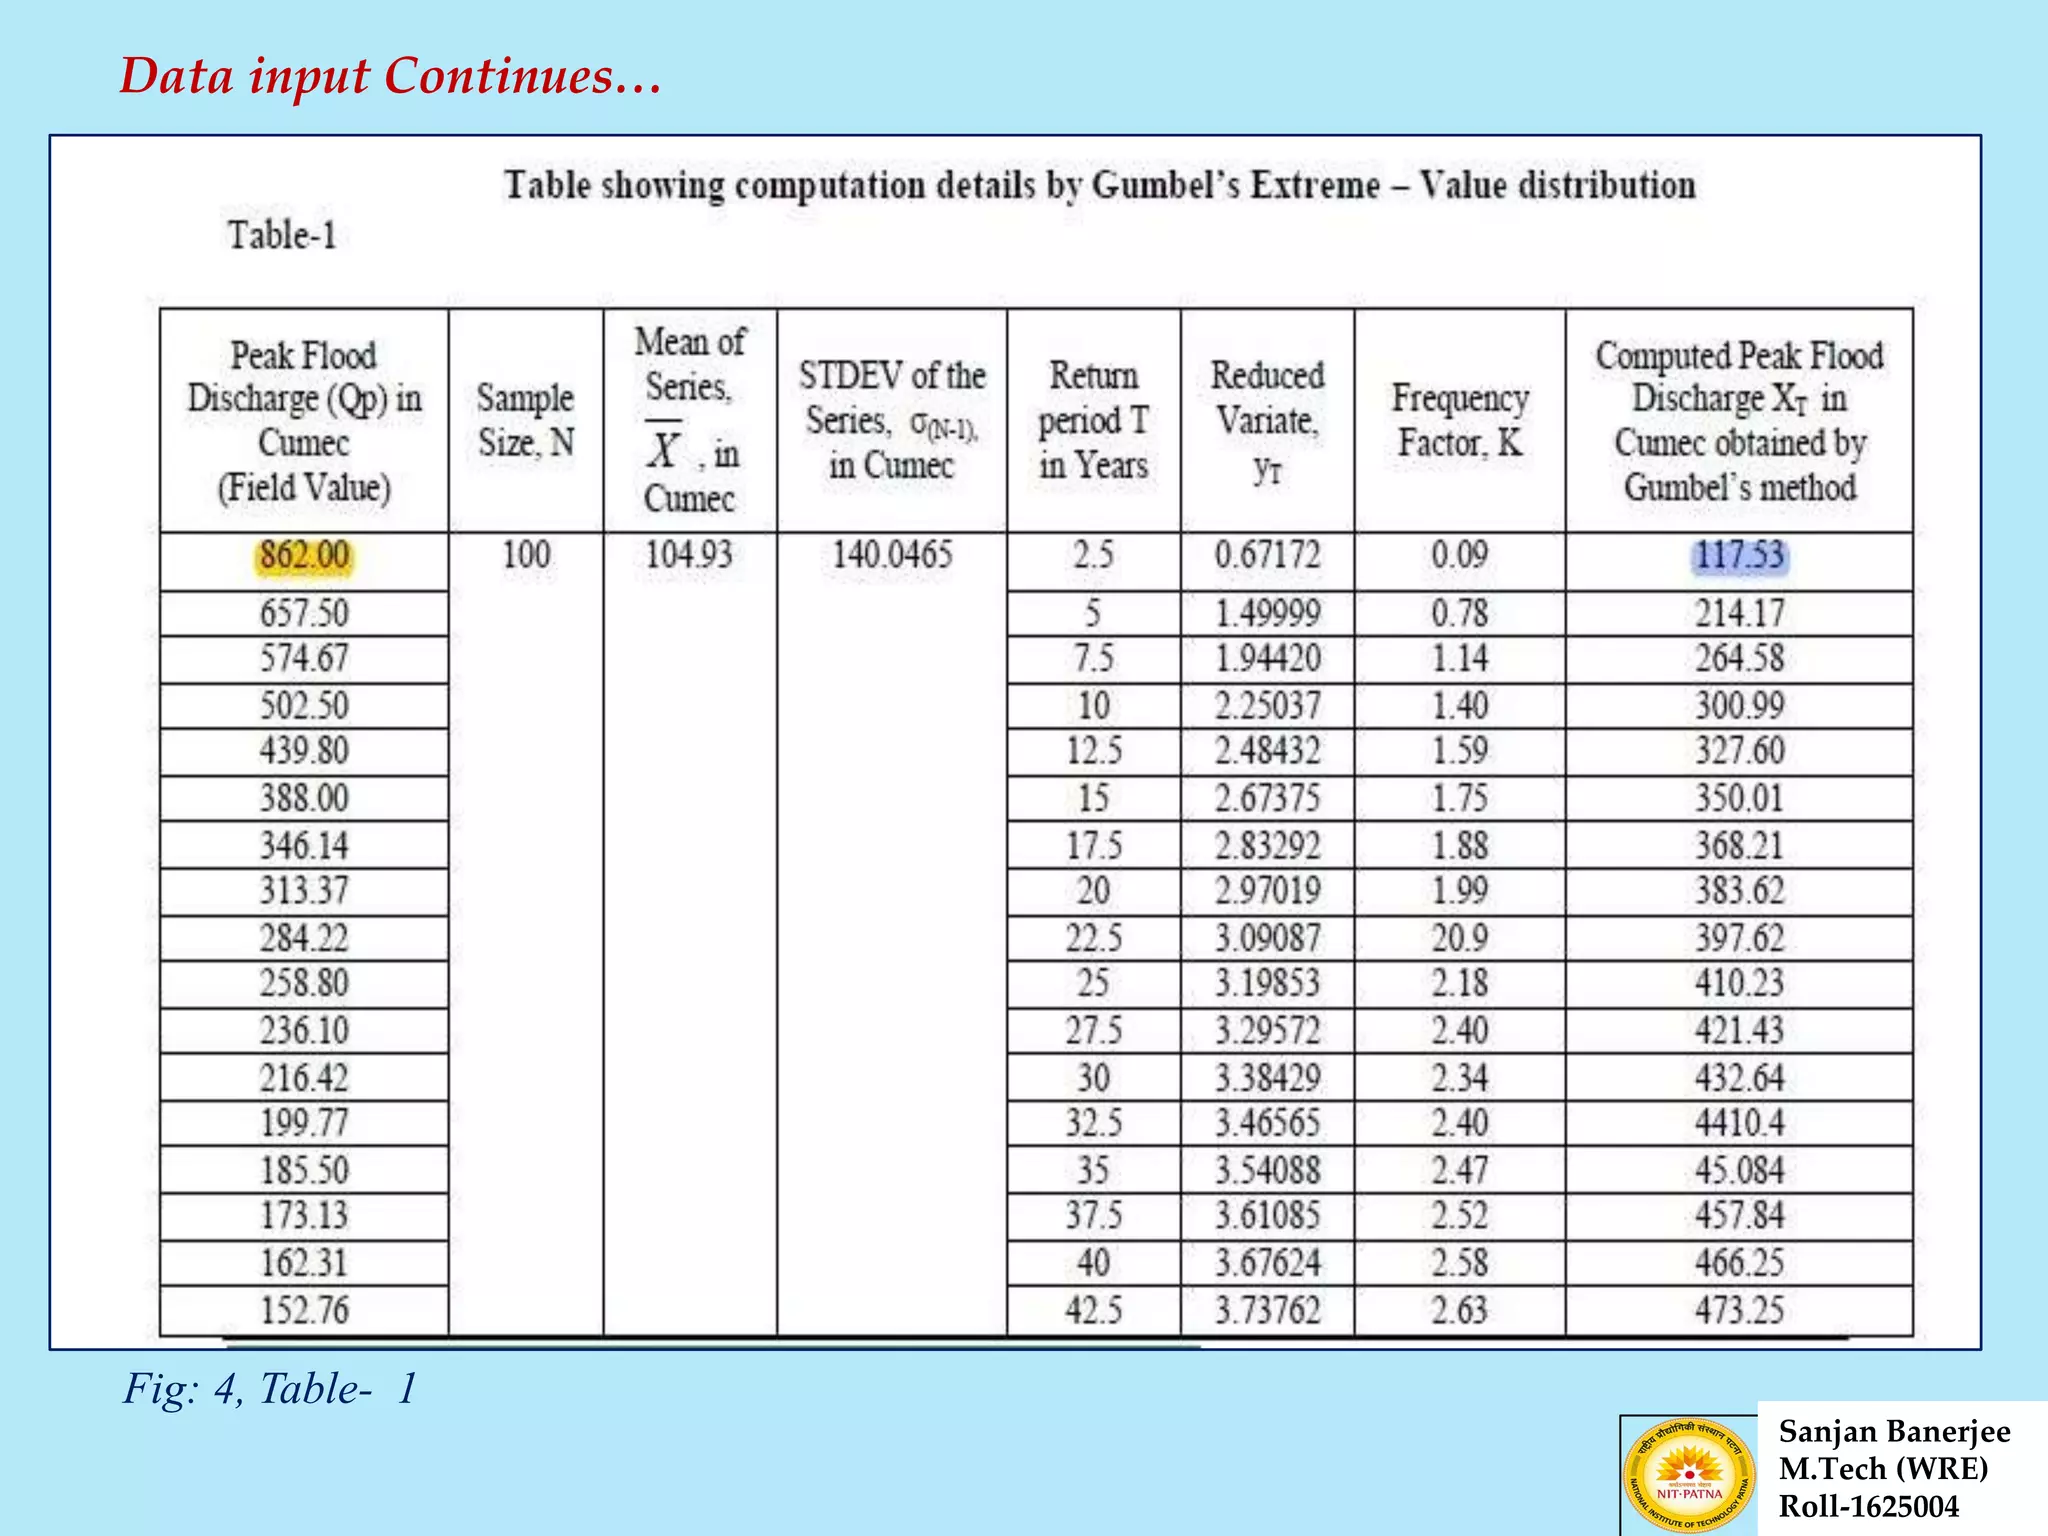
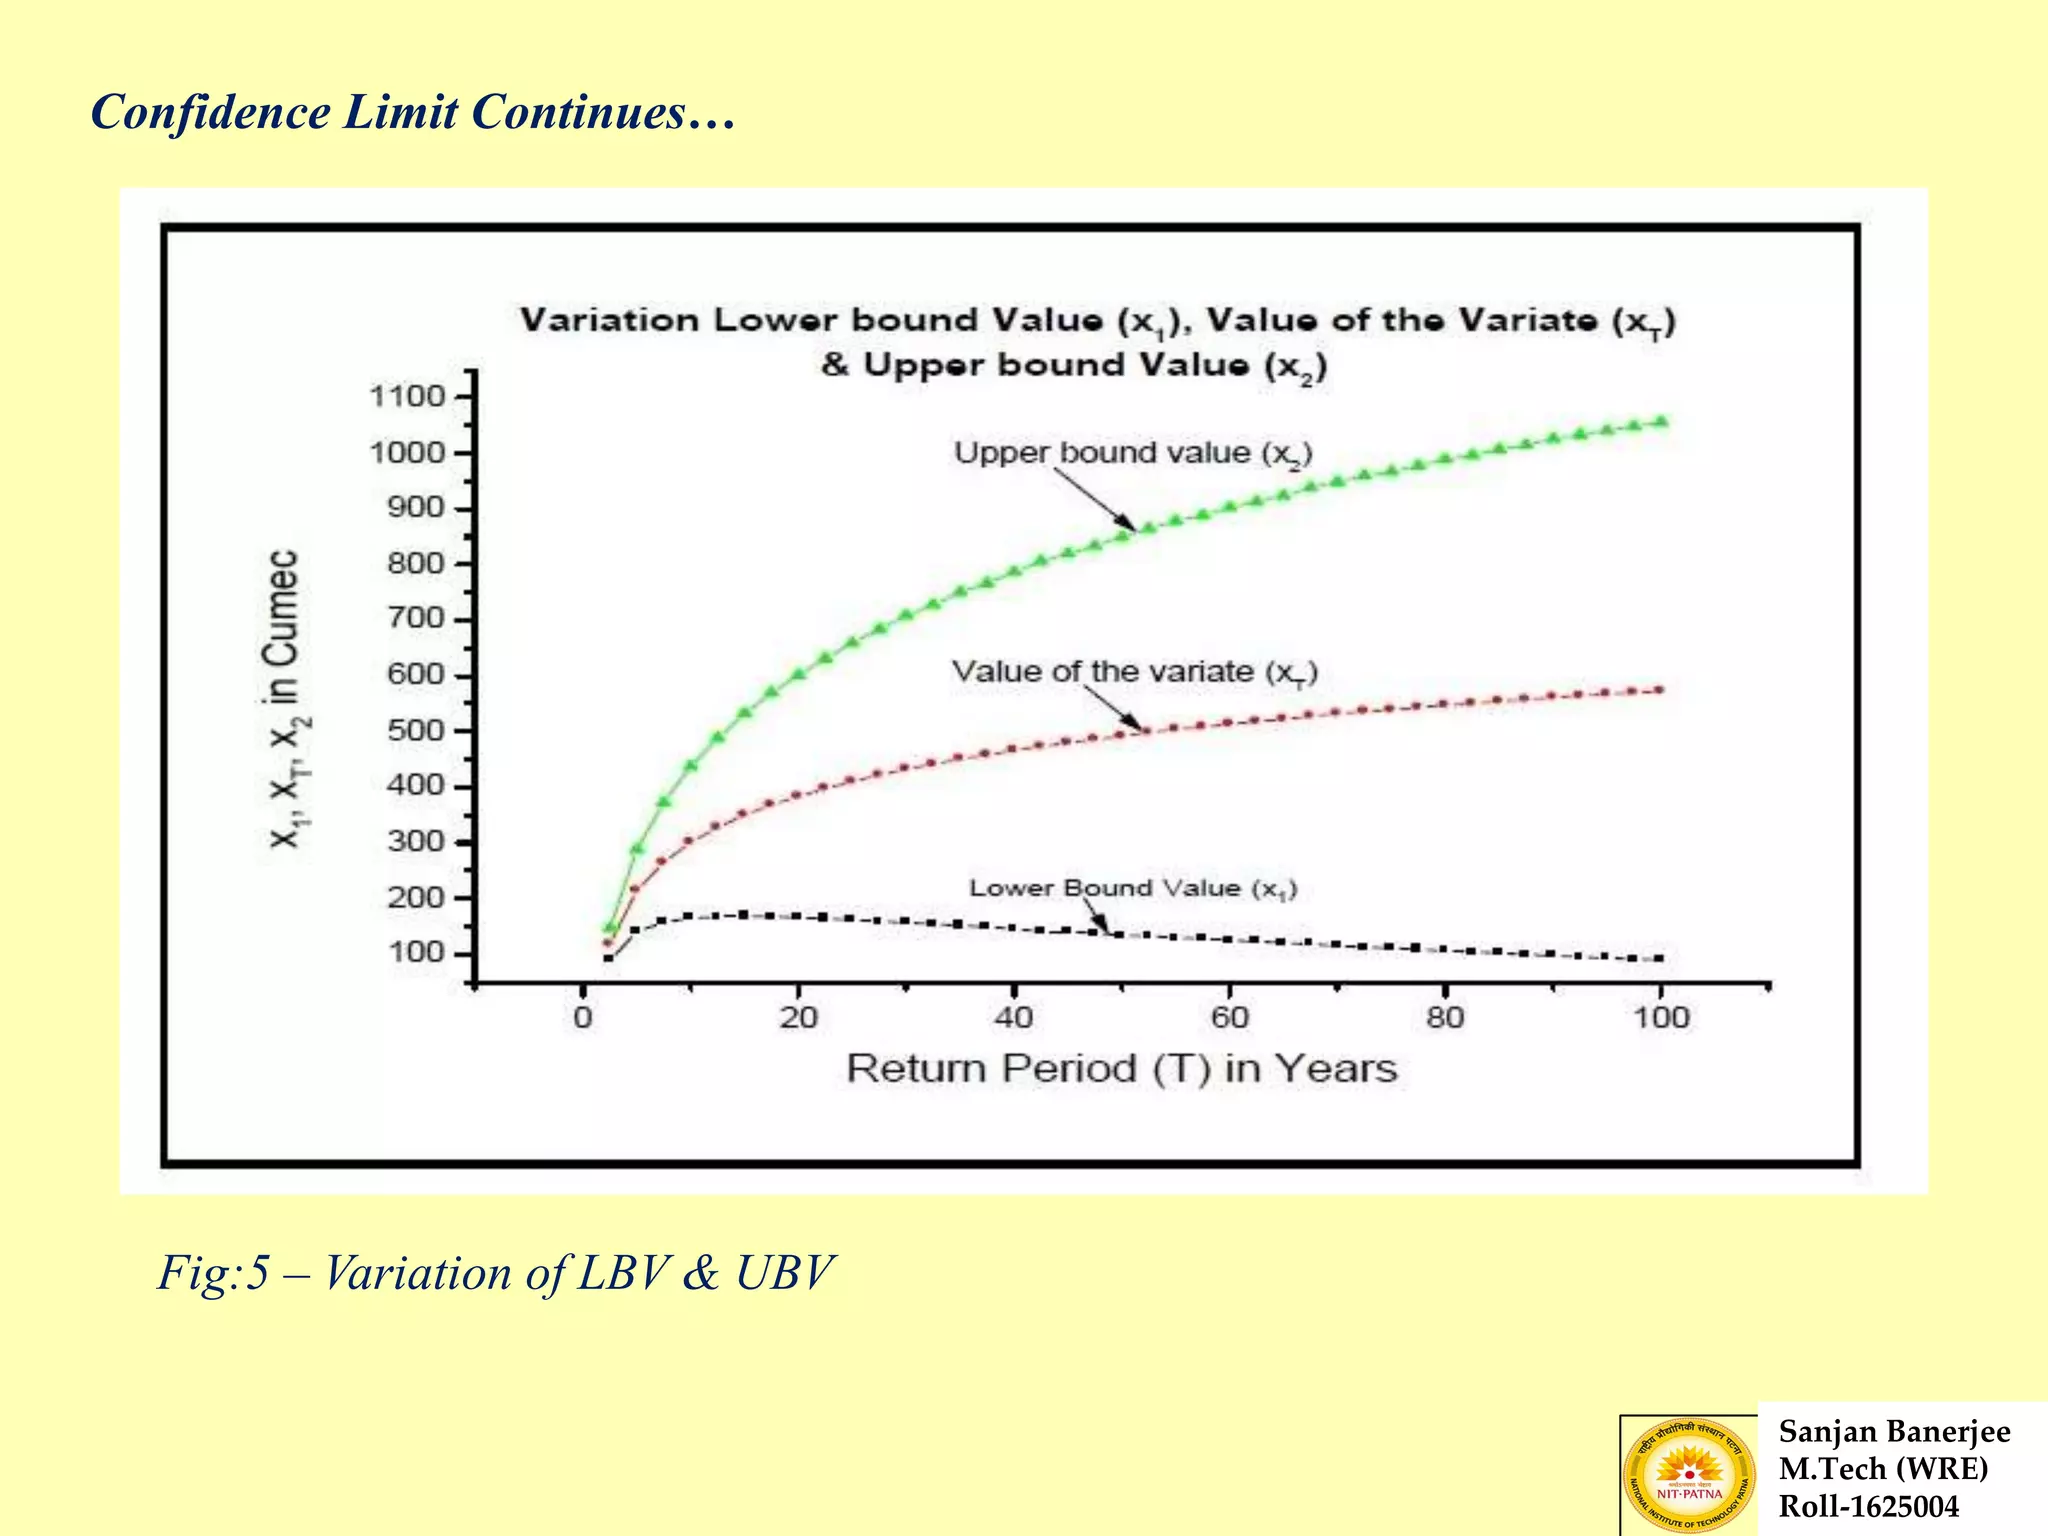
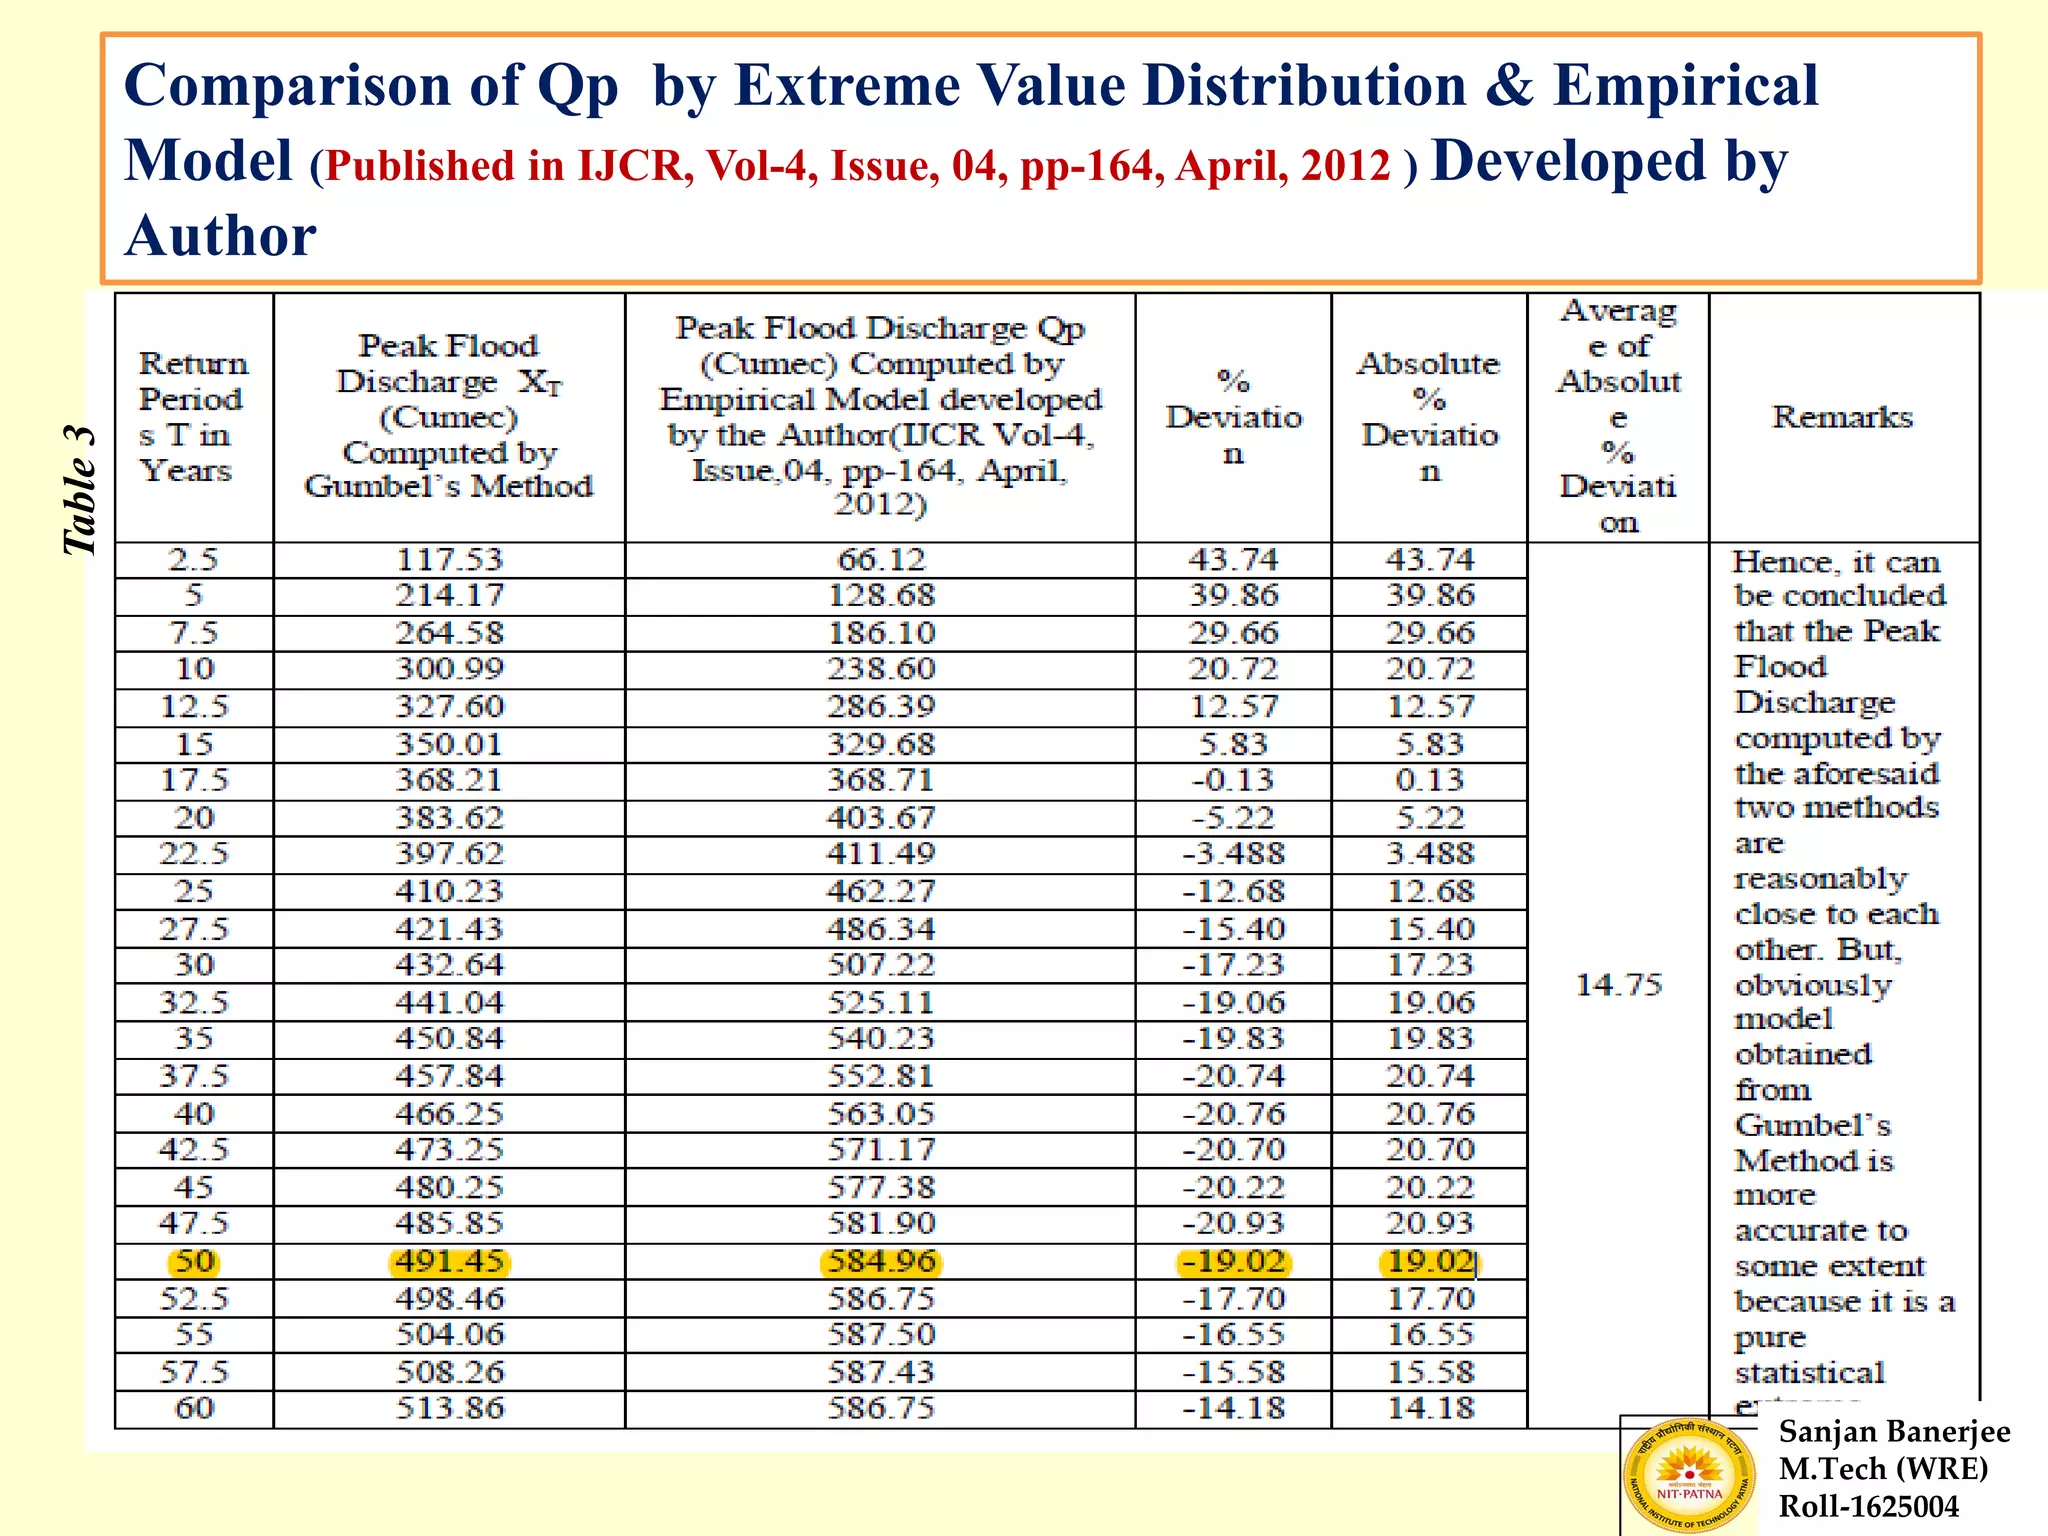
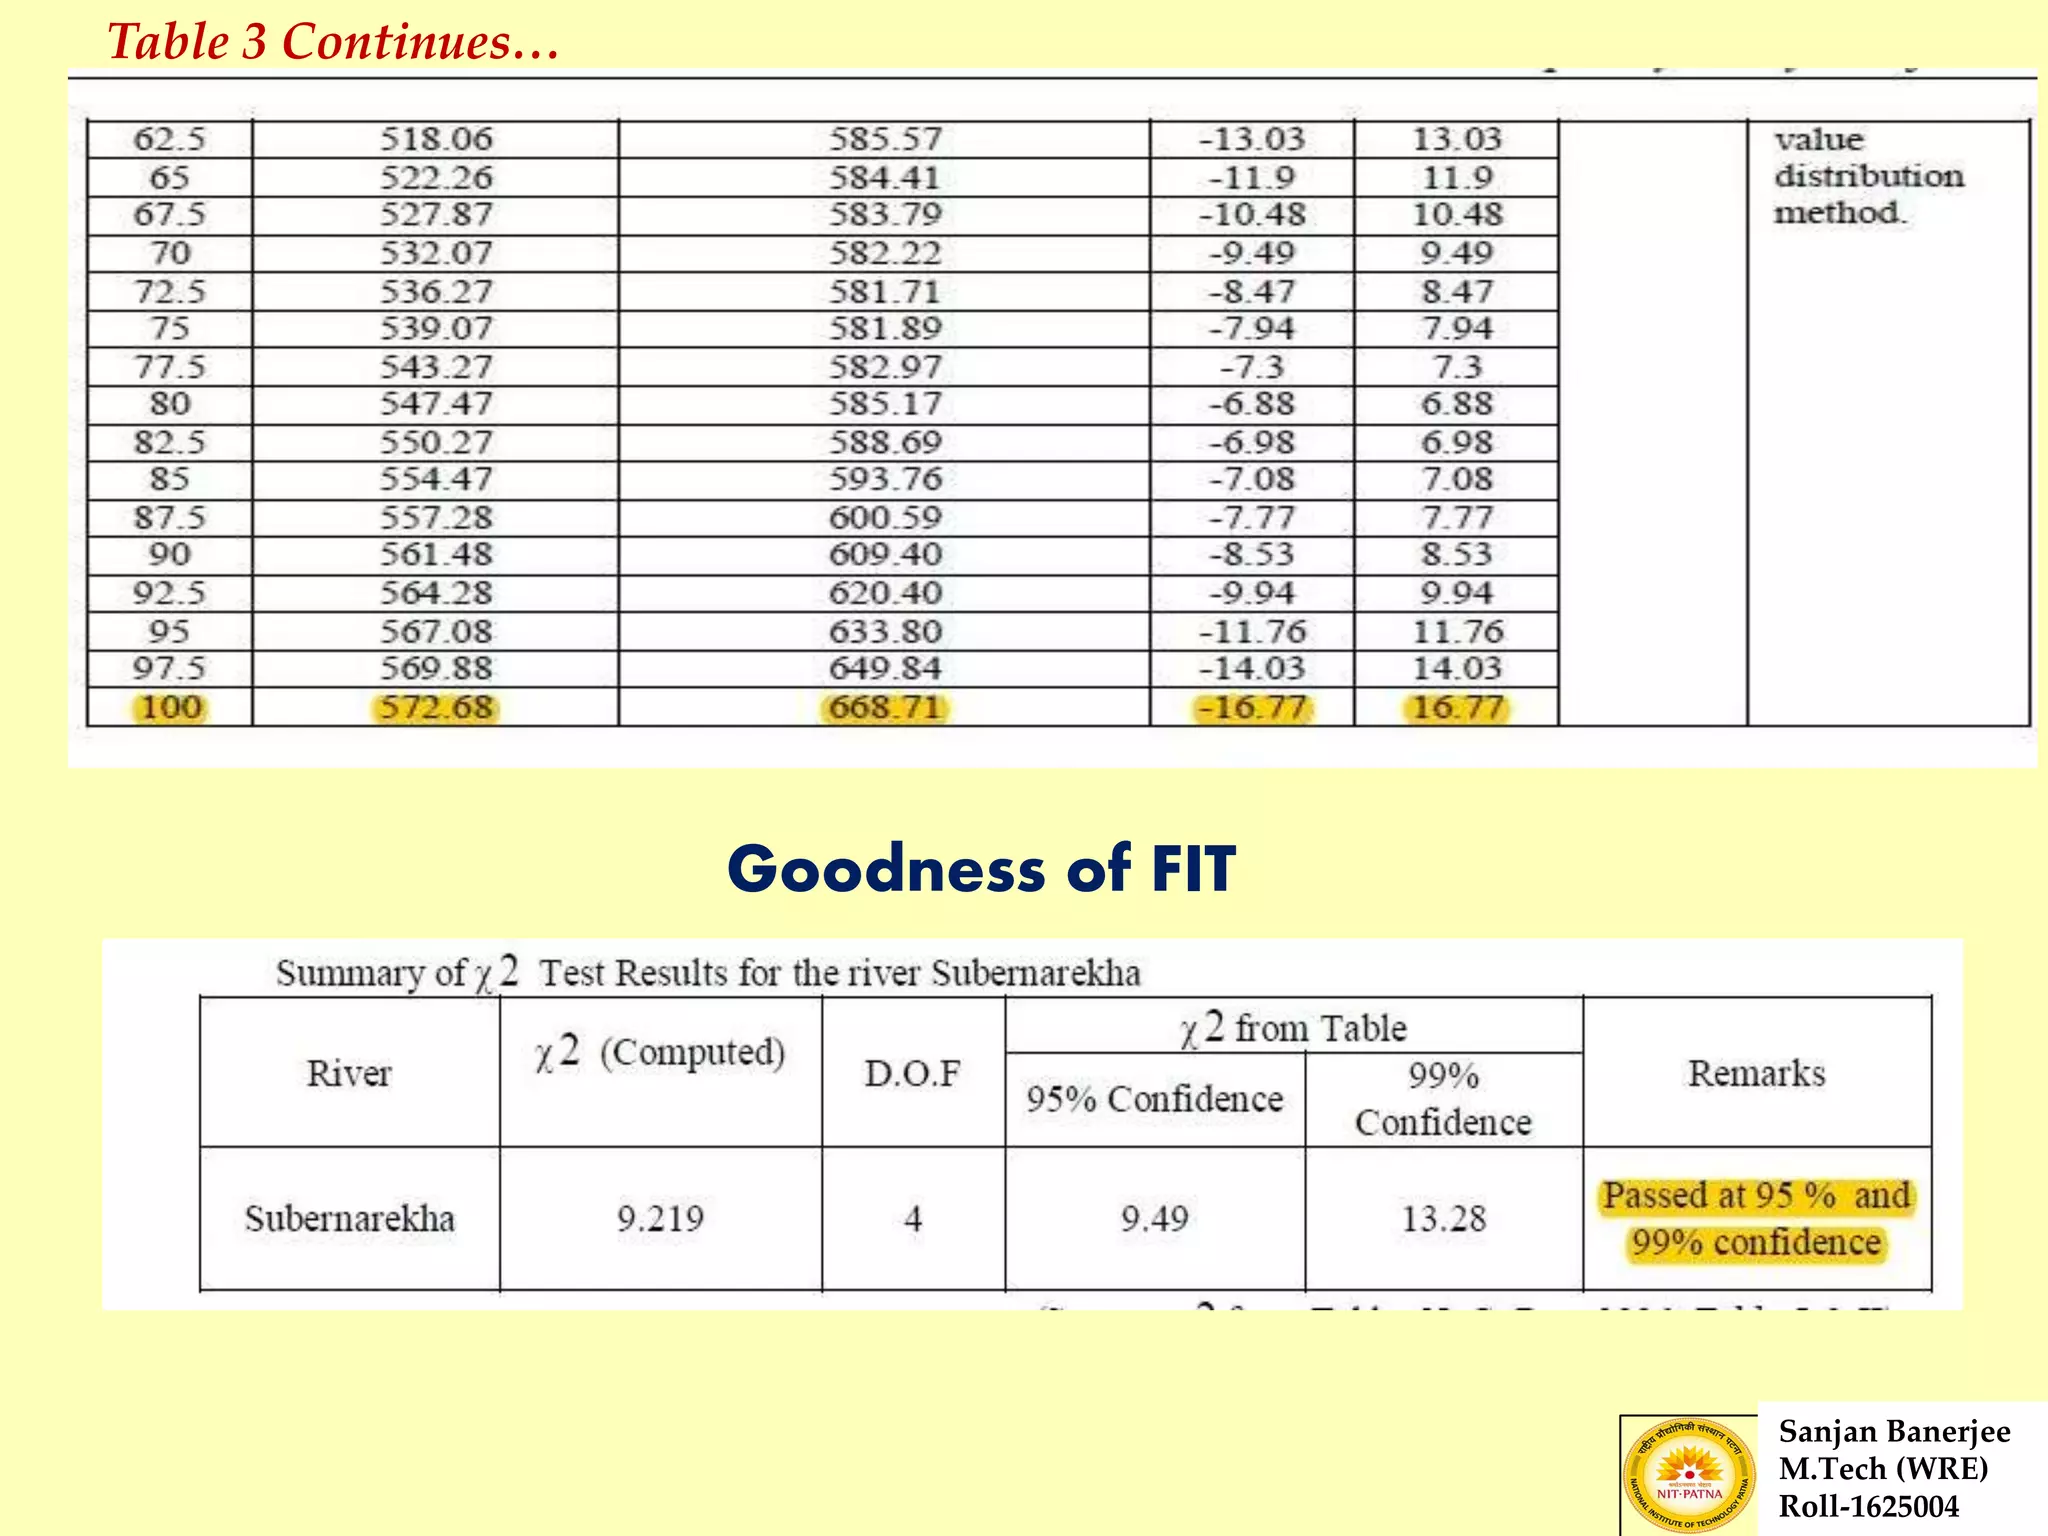
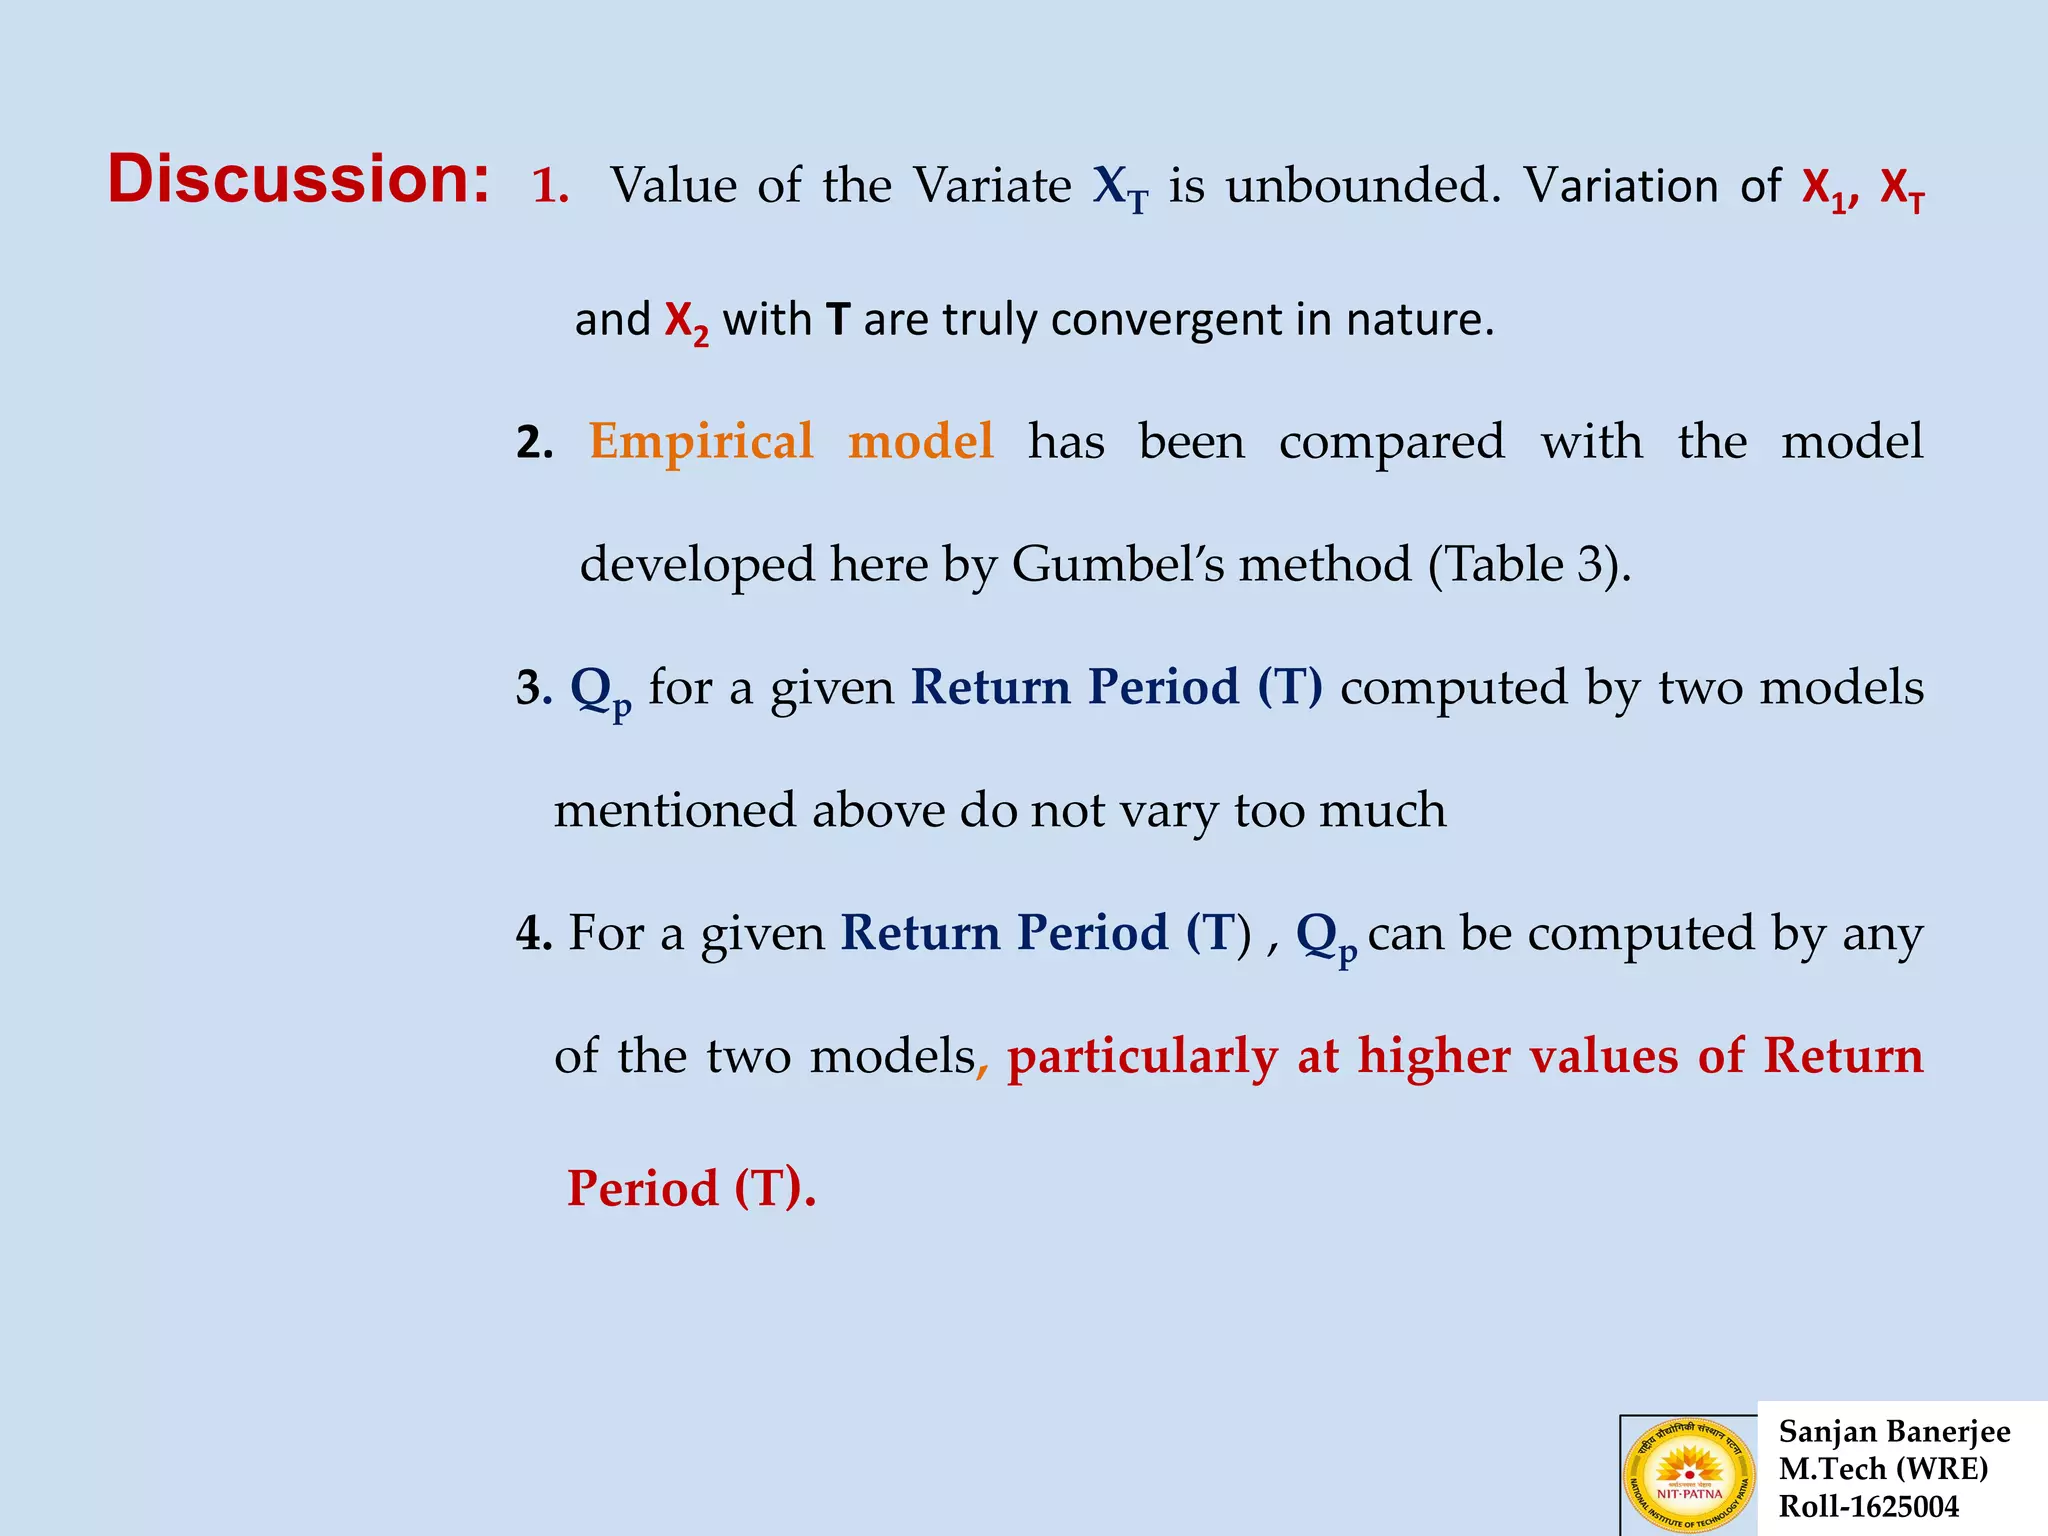
Presentation of Journal Paper
on
“Flood Frequency Analysis of River Subernarekha, India ,Using
Gumbel’s Extreme Value Distribution”
WATER RESOURCE ENGINEERING
DEPARTMENT OF CIVIL ENGINEERING
NATIONAL INSTITUTE OF TECHNOLOGY , PATNA
Presented By:
Sanjan Banerjee
M.Tech (WRE)
Roll-1625004
What is FLOOD FREQUENCY ANALYSIS ?
Sanjan Banerjee
M.Tech (WRE)
Roll-1625004
Flood: Situation having excessive Stage of a river
generally above Full River Level(FRL).
Frequency: Number of time that a given magnitude of event
may occur in a given Return Period.
Analysis: Procedure adopt for evaluation.
REASONS
 Estimation of Flow i.e. Possible Flood Magnitude.
 Safe design of Hydraulic Structures i.e. Dams, Culverts etc.
 More Reliable and Logical approach.
 Knowledge Flood insurance and Flood zoning.
Sanjan Banerjee
M.Tech (WRE)
Roll-1625004
Statistical Analysis
Annual Maximum Series Partial Duration
Series
One Discharge i.e. Peak per Year
N>20, AMS is adopted
More than one Discharge/Year
Used for Independent Event
N<5,PDS is adopted
Time Series
Flow represented by Series of ordinates
at equally interval of Times.
Day unit is taken rather than month or
year.
Sanjan Banerjee
M.Tech (WRE)
Roll-1625004
Annual Maximum Series
Calculation of Frequency:
Sanjan Banerjee
M.Tech (WRE)
Roll-1625004
AMS Continues…
Calculation of Flood Magnitude: T Xx x K 
XT = Desired Flood after T years.
X = Mean Flood in Flood Series
K = Frequency Factor
= Standard DeviationX
Approaches:
1. Gumbel’s Method & Confidence Limits
2. Log Pearson Type III
3. Log Normal Method
4. Gamma Distribution
5. Extreme Value Distribution……..
Sanjan Banerjee
M.Tech (WRE)
Roll-1625004
Introduction
Peak Flood Magnitude is prerequisite for Planning ,Operation and Post
Commissioning of Hydraulic Structures.
Gumbel’s Distribution is adopted only because of Peak Flow Data are
Homogeneous & Independent hence lack long term trends, the river is less
regulated ,flow data cover a long record and is of good quality.
Objectives
 To develop a Mathematical Model between Peak Flood
Discharge & Return Period from a given 6-hr UH.
 To estimate of Qp (Peak Flood Discharge) at any
desired value of T (Return Period).
Sanjan Banerjee
M.Tech (WRE)
Roll-1625004
Fig 2A: Subarnarekha Basin Fig 2B: FCC image
Sanjan Banerjee
M.Tech (WRE)
Roll-1625004
Satellite Imageries of the Basin
Sanjan Banerjee
M.Tech (WRE)
Roll-1625004
Fig2C:
Subarnarekha
Drainage
Basin & Study
Site
Basin Information
SL
No.
Features Description
1 . Basin Extent 85° 8' to 87° 32' E
21° 15' to 23° 34' N
2. Area (Sq.km) 29,196 (as reported by CWC)
25,792.17 (Geographically calculated)
3. Mean Annual Rainfall
(mm)
1458.61 (0.5° grid for 1971-2005)
1383.35 (1° grid for 1969-2004)
4. Mean Maximum
Temperature (°C)
31.46
5. Mean Minimum
Temperature (°C)
20.50
6. Highest Elevation (m) 1166
7. Number of Sub Basins
Number of Watershed
1
45
Sanjan Banerjee
M.Tech (WRE)
Roll-1625004
Table A:
Basin
Information
Data Collection: 6-h unit hydrograph for Kharkai Barrage Site was used. No
other datas (Qp ,Stream Order, Stream Density…) are presently
available.
Data Source: Irrigation International Building , Salt Lake, Kolkata, Govt. of
West Bengal.
Data Processing: D-hr UH nD hr UH
A computer Program has been derived for this purpose.
The Computer Output, UH for each duration is developed.
From UH, Qp and D has been indentified.
Sanjan Banerjee
M.Tech (WRE)
Roll-1625004
Gumbel’s Distribution in Kharkai Catchment
(ln(ln( ))
1
T X
t n
n
t
x x k
y y
k
s
T
y
T
  


 

XT = Desired Flood
X = Mean Flood
K = Frequency Factor
σ = Standard Deviation
Yt = Reduced Variate
Yn = Reduced Mean
Sn = Reduced SD
Data Input: Sample Size = 100
Mean of Series = 104.93 cumec
Standard Deviation = 140.0465 cumec
Return Period = 100 Yr
Interval Taken = 2.5yr
Sanjan Banerjee
M.Tech (WRE)
Roll-1625004
Data input Continues…
Sanjan Banerjee
M.Tech (WRE)
Roll-1625004
Fig: 4, Table- 1
Table 1 Continues…
Sanjan Banerjee
M.Tech (WRE)
Roll-1625004
Fig: 4A, Table- 1
Sanjan Banerjee
M.Tech (WRE)
Roll-1625004
Return Period
(Yr.)
Computed Value
(Cumec)
2.5 117.53
10 300.99
20 383.62
50 491.45
75 539.07
100 572.68
Name Field Value
(Cumec)
1.Minimum
Discharge
64.92
2. 66.59
3. 68.34
98. 574.67
99. 657.5
100.Maximum
Discharge
862.00
Comparison Between Field Value and Computed Value
Table 1A: Comparison chart
Sanjan Banerjee
M.Tech (WRE)
Roll-1625004
Confidence Limits
Sanjan Banerjee
M.Tech (WRE)
Roll-1625004
Table- 2 : Upper & Lower Bound Values
Confidence Limit Continues…
Fig:5 – Variation of LBV & UBV
Sanjan Banerjee
M.Tech (WRE)
Roll-1625004
Comparison of Qp by Extreme Value Distribution & Empirical
Model (Published in IJCR, Vol-4, Issue, 04, pp-164, April, 2012 ) Developed by
Author
Sanjan Banerjee
M.Tech (WRE)
Roll-1625004
Table3
Table 3 Continues…
Goodness of FIT
Sanjan Banerjee
M.Tech (WRE)
Roll-1625004
Discussion: 1. Value of the Variate XT is unbounded. Variation of X1, XT
and X2 with T are truly convergent in nature.
2. Empirical model has been compared with the model
developed here by Gumbel’s method (Table 3).
3. Qp for a given Return Period (T) computed by two models
mentioned above do not vary too much
4. For a given Return Period (T) , Qp can be computed by any
of the two models, particularly at higher values of Return
Period (T).
Sanjan Banerjee
M.Tech (WRE)
Roll-1625004
Conclusion: 1. The entire water resource of river Subernarekha is largely
untapped. Hence, construction of hydraulic structures will be
helpful for resource generation also.
2. For any anticipated T, XT can readily be estimated from the
developed model as shown in the Figure-3 and corresponding
equation has also been furnished there.
3. The Stage (G), corresponding to XT can be estimated.These
Stages may be obtained from Stage-Discharge (G-Q) model.
4. If presently adopted Danger level for ‘Flood’ for the river
Subernarekha at the gauging site, is lower than the stage
computed from (G-Q) model, then there is no problem and
vice versa. Sanjan Banerjee
M.Tech (WRE)
Roll-1625004
References
Journals:
1. Mukherjee, M.K.2013, ’Flood Frequency Analysis of River Subernarekha,
India, Using Gumbel’s extreme Value Distribution’, IJCER,Vol-3,Issue-7,pp-12-
18.
Sanjan Banerjee
M.Tech (WRE)
Roll-1625004
Online Sources:
1. http://www.india-wris.nrsc.gov.in/subarnarekhabasinreport.html
Flood frequency analysis

Flood frequency analysis

  • 1.
    Presentation of JournalPaper on “Flood Frequency Analysis of River Subernarekha, India ,Using Gumbel’s Extreme Value Distribution” WATER RESOURCE ENGINEERING DEPARTMENT OF CIVIL ENGINEERING NATIONAL INSTITUTE OF TECHNOLOGY , PATNA Presented By: Sanjan Banerjee M.Tech (WRE) Roll-1625004
  • 2.
    What is FLOODFREQUENCY ANALYSIS ? Sanjan Banerjee M.Tech (WRE) Roll-1625004 Flood: Situation having excessive Stage of a river generally above Full River Level(FRL). Frequency: Number of time that a given magnitude of event may occur in a given Return Period. Analysis: Procedure adopt for evaluation.
  • 3.
    REASONS  Estimation ofFlow i.e. Possible Flood Magnitude.  Safe design of Hydraulic Structures i.e. Dams, Culverts etc.  More Reliable and Logical approach.  Knowledge Flood insurance and Flood zoning. Sanjan Banerjee M.Tech (WRE) Roll-1625004
  • 4.
    Statistical Analysis Annual MaximumSeries Partial Duration Series One Discharge i.e. Peak per Year N>20, AMS is adopted More than one Discharge/Year Used for Independent Event N<5,PDS is adopted Time Series Flow represented by Series of ordinates at equally interval of Times. Day unit is taken rather than month or year. Sanjan Banerjee M.Tech (WRE) Roll-1625004
  • 5.
    Annual Maximum Series Calculationof Frequency: Sanjan Banerjee M.Tech (WRE) Roll-1625004
  • 6.
    AMS Continues… Calculation ofFlood Magnitude: T Xx x K  XT = Desired Flood after T years. X = Mean Flood in Flood Series K = Frequency Factor = Standard DeviationX Approaches: 1. Gumbel’s Method & Confidence Limits 2. Log Pearson Type III 3. Log Normal Method 4. Gamma Distribution 5. Extreme Value Distribution…….. Sanjan Banerjee M.Tech (WRE) Roll-1625004
  • 7.
    Introduction Peak Flood Magnitudeis prerequisite for Planning ,Operation and Post Commissioning of Hydraulic Structures. Gumbel’s Distribution is adopted only because of Peak Flow Data are Homogeneous & Independent hence lack long term trends, the river is less regulated ,flow data cover a long record and is of good quality. Objectives  To develop a Mathematical Model between Peak Flood Discharge & Return Period from a given 6-hr UH.  To estimate of Qp (Peak Flood Discharge) at any desired value of T (Return Period). Sanjan Banerjee M.Tech (WRE) Roll-1625004
  • 8.
    Fig 2A: SubarnarekhaBasin Fig 2B: FCC image Sanjan Banerjee M.Tech (WRE) Roll-1625004 Satellite Imageries of the Basin
  • 9.
  • 10.
    Basin Information SL No. Features Description 1. Basin Extent 85° 8' to 87° 32' E 21° 15' to 23° 34' N 2. Area (Sq.km) 29,196 (as reported by CWC) 25,792.17 (Geographically calculated) 3. Mean Annual Rainfall (mm) 1458.61 (0.5° grid for 1971-2005) 1383.35 (1° grid for 1969-2004) 4. Mean Maximum Temperature (°C) 31.46 5. Mean Minimum Temperature (°C) 20.50 6. Highest Elevation (m) 1166 7. Number of Sub Basins Number of Watershed 1 45 Sanjan Banerjee M.Tech (WRE) Roll-1625004 Table A: Basin Information
  • 11.
    Data Collection: 6-hunit hydrograph for Kharkai Barrage Site was used. No other datas (Qp ,Stream Order, Stream Density…) are presently available. Data Source: Irrigation International Building , Salt Lake, Kolkata, Govt. of West Bengal. Data Processing: D-hr UH nD hr UH A computer Program has been derived for this purpose. The Computer Output, UH for each duration is developed. From UH, Qp and D has been indentified. Sanjan Banerjee M.Tech (WRE) Roll-1625004
  • 12.
    Gumbel’s Distribution inKharkai Catchment (ln(ln( )) 1 T X t n n t x x k y y k s T y T         XT = Desired Flood X = Mean Flood K = Frequency Factor σ = Standard Deviation Yt = Reduced Variate Yn = Reduced Mean Sn = Reduced SD Data Input: Sample Size = 100 Mean of Series = 104.93 cumec Standard Deviation = 140.0465 cumec Return Period = 100 Yr Interval Taken = 2.5yr Sanjan Banerjee M.Tech (WRE) Roll-1625004
  • 13.
    Data input Continues… SanjanBanerjee M.Tech (WRE) Roll-1625004 Fig: 4, Table- 1
  • 14.
    Table 1 Continues… SanjanBanerjee M.Tech (WRE) Roll-1625004 Fig: 4A, Table- 1
  • 15.
  • 16.
    Return Period (Yr.) Computed Value (Cumec) 2.5117.53 10 300.99 20 383.62 50 491.45 75 539.07 100 572.68 Name Field Value (Cumec) 1.Minimum Discharge 64.92 2. 66.59 3. 68.34 98. 574.67 99. 657.5 100.Maximum Discharge 862.00 Comparison Between Field Value and Computed Value Table 1A: Comparison chart Sanjan Banerjee M.Tech (WRE) Roll-1625004
  • 17.
    Confidence Limits Sanjan Banerjee M.Tech(WRE) Roll-1625004 Table- 2 : Upper & Lower Bound Values
  • 18.
    Confidence Limit Continues… Fig:5– Variation of LBV & UBV Sanjan Banerjee M.Tech (WRE) Roll-1625004
  • 19.
    Comparison of Qpby Extreme Value Distribution & Empirical Model (Published in IJCR, Vol-4, Issue, 04, pp-164, April, 2012 ) Developed by Author Sanjan Banerjee M.Tech (WRE) Roll-1625004 Table3
  • 20.
    Table 3 Continues… Goodnessof FIT Sanjan Banerjee M.Tech (WRE) Roll-1625004
  • 21.
    Discussion: 1. Valueof the Variate XT is unbounded. Variation of X1, XT and X2 with T are truly convergent in nature. 2. Empirical model has been compared with the model developed here by Gumbel’s method (Table 3). 3. Qp for a given Return Period (T) computed by two models mentioned above do not vary too much 4. For a given Return Period (T) , Qp can be computed by any of the two models, particularly at higher values of Return Period (T). Sanjan Banerjee M.Tech (WRE) Roll-1625004
  • 22.
    Conclusion: 1. Theentire water resource of river Subernarekha is largely untapped. Hence, construction of hydraulic structures will be helpful for resource generation also. 2. For any anticipated T, XT can readily be estimated from the developed model as shown in the Figure-3 and corresponding equation has also been furnished there. 3. The Stage (G), corresponding to XT can be estimated.These Stages may be obtained from Stage-Discharge (G-Q) model. 4. If presently adopted Danger level for ‘Flood’ for the river Subernarekha at the gauging site, is lower than the stage computed from (G-Q) model, then there is no problem and vice versa. Sanjan Banerjee M.Tech (WRE) Roll-1625004
  • 23.
    References Journals: 1. Mukherjee, M.K.2013,’Flood Frequency Analysis of River Subernarekha, India, Using Gumbel’s extreme Value Distribution’, IJCER,Vol-3,Issue-7,pp-12- 18. Sanjan Banerjee M.Tech (WRE) Roll-1625004 Online Sources: 1. http://www.india-wris.nrsc.gov.in/subarnarekhabasinreport.html