Download to read offline


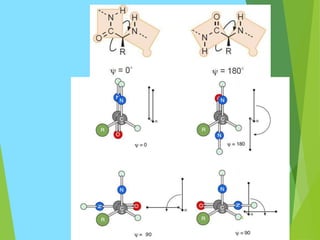

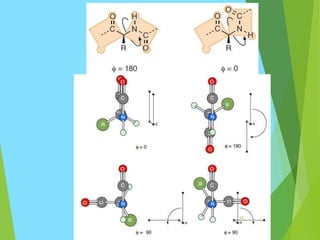
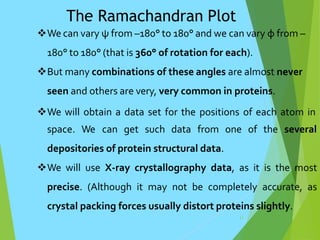

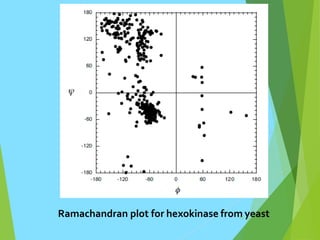

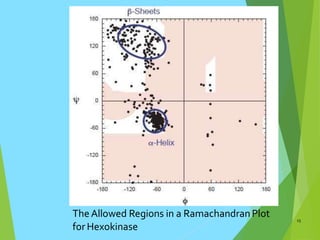
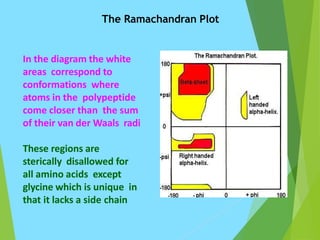
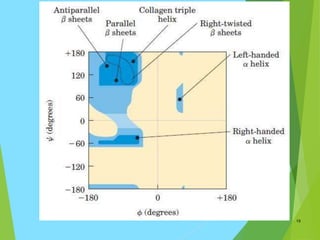


The document discusses the Ramachandran plot, which is a plot of the phi (φ) angle versus the psi (ψ) angle of amino acid residues in protein structures. It explains that these two angles are limited by steric constraints from the atoms in the protein backbone. The allowed and disallowed regions in the Ramachandran plot correspond to conformations where backbone atoms are too close or clashing versus conformations where they have sufficient space. Most protein structures fall within the allowed regions, helping explain their stable secondary structures.