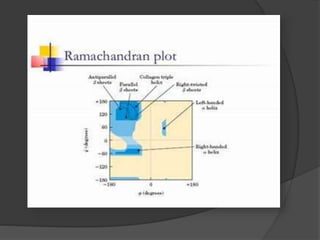
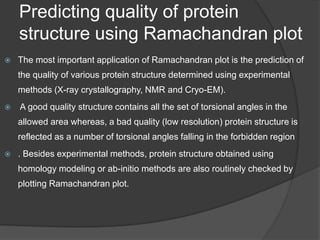
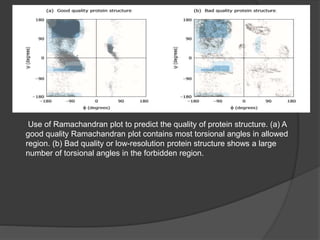
The Ramachandran plot, developed in 1963, is a graphical representation that displays the possible conformations of proteins based on torsion angles, which are crucial for assessing the accuracy of protein structures. The plot distinguishes allowed and disallowed regions of conformations, with allowed regions corresponding to configurations that avoid steric clashes, which are vital for protein stability. It is an essential tool in predicting protein structure quality, as good quality structures exhibit torsion angles within the allowed area, while poor-quality structures show angles in the disallowed region.