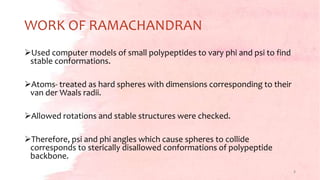
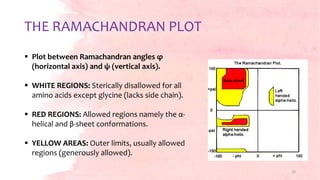
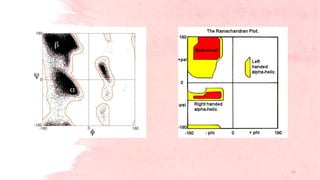
G.N. Ramachandran developed the Ramachandran plot in 1963 to visualize allowed backbone dihedral angles (phi and psi) of amino acid residues in protein structures. The plot shows sterically allowed and disallowed regions for phi-psi torsion angles based on collisions between atoms treated as hard spheres. It has since been used for protein structure validation and improvement of structure determination methods. The favored regions correspond to common secondary structure motifs like alpha helices and beta sheets.
![RAMACHANDRAN PLOT
Presented by,
Sabhyata Chaubey
M.Sc. [Bt] Semester- 1st
Roll No. - 201810901010011
Under the guidance of
Dr. Neeraj Gupta
Associate Professor1](https://image.slidesharecdn.com/sam123-190502002451/85/RAMACHANDRAN-PLOT-1-320.jpg)
![RAMACHANDRAN PLOT
Presented by,
Sabhyata Chaubey
M.Sc. [Bt] Semester- 1st
Roll No. - 201810901010011
Under the guidance of
Dr. Neeraj Gupta
Associate Professor1](https://image.slidesharecdn.com/sam123-190502002451/75/RAMACHANDRAN-PLOT-1-2048.jpg)

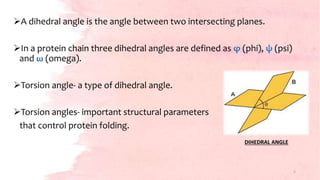
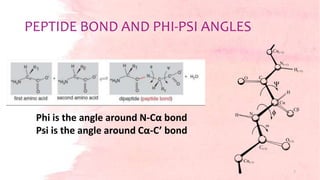
![Torsion angles- φ and ψ provide the flexibility required for the
polypeptide backbone to adopt a certain fold.
Third torsion angle ω- flat and fixed to 180 degrees.
[due to the partial double-bond character of the peptide bond, which
restricts rotation around the C-N bond, placing two successive α-carbons
and C, O, N and H between them in one plane.]
6](https://image.slidesharecdn.com/sam123-190502002451/85/RAMACHANDRAN-PLOT-6-320.jpg)