Downloaded 393 times

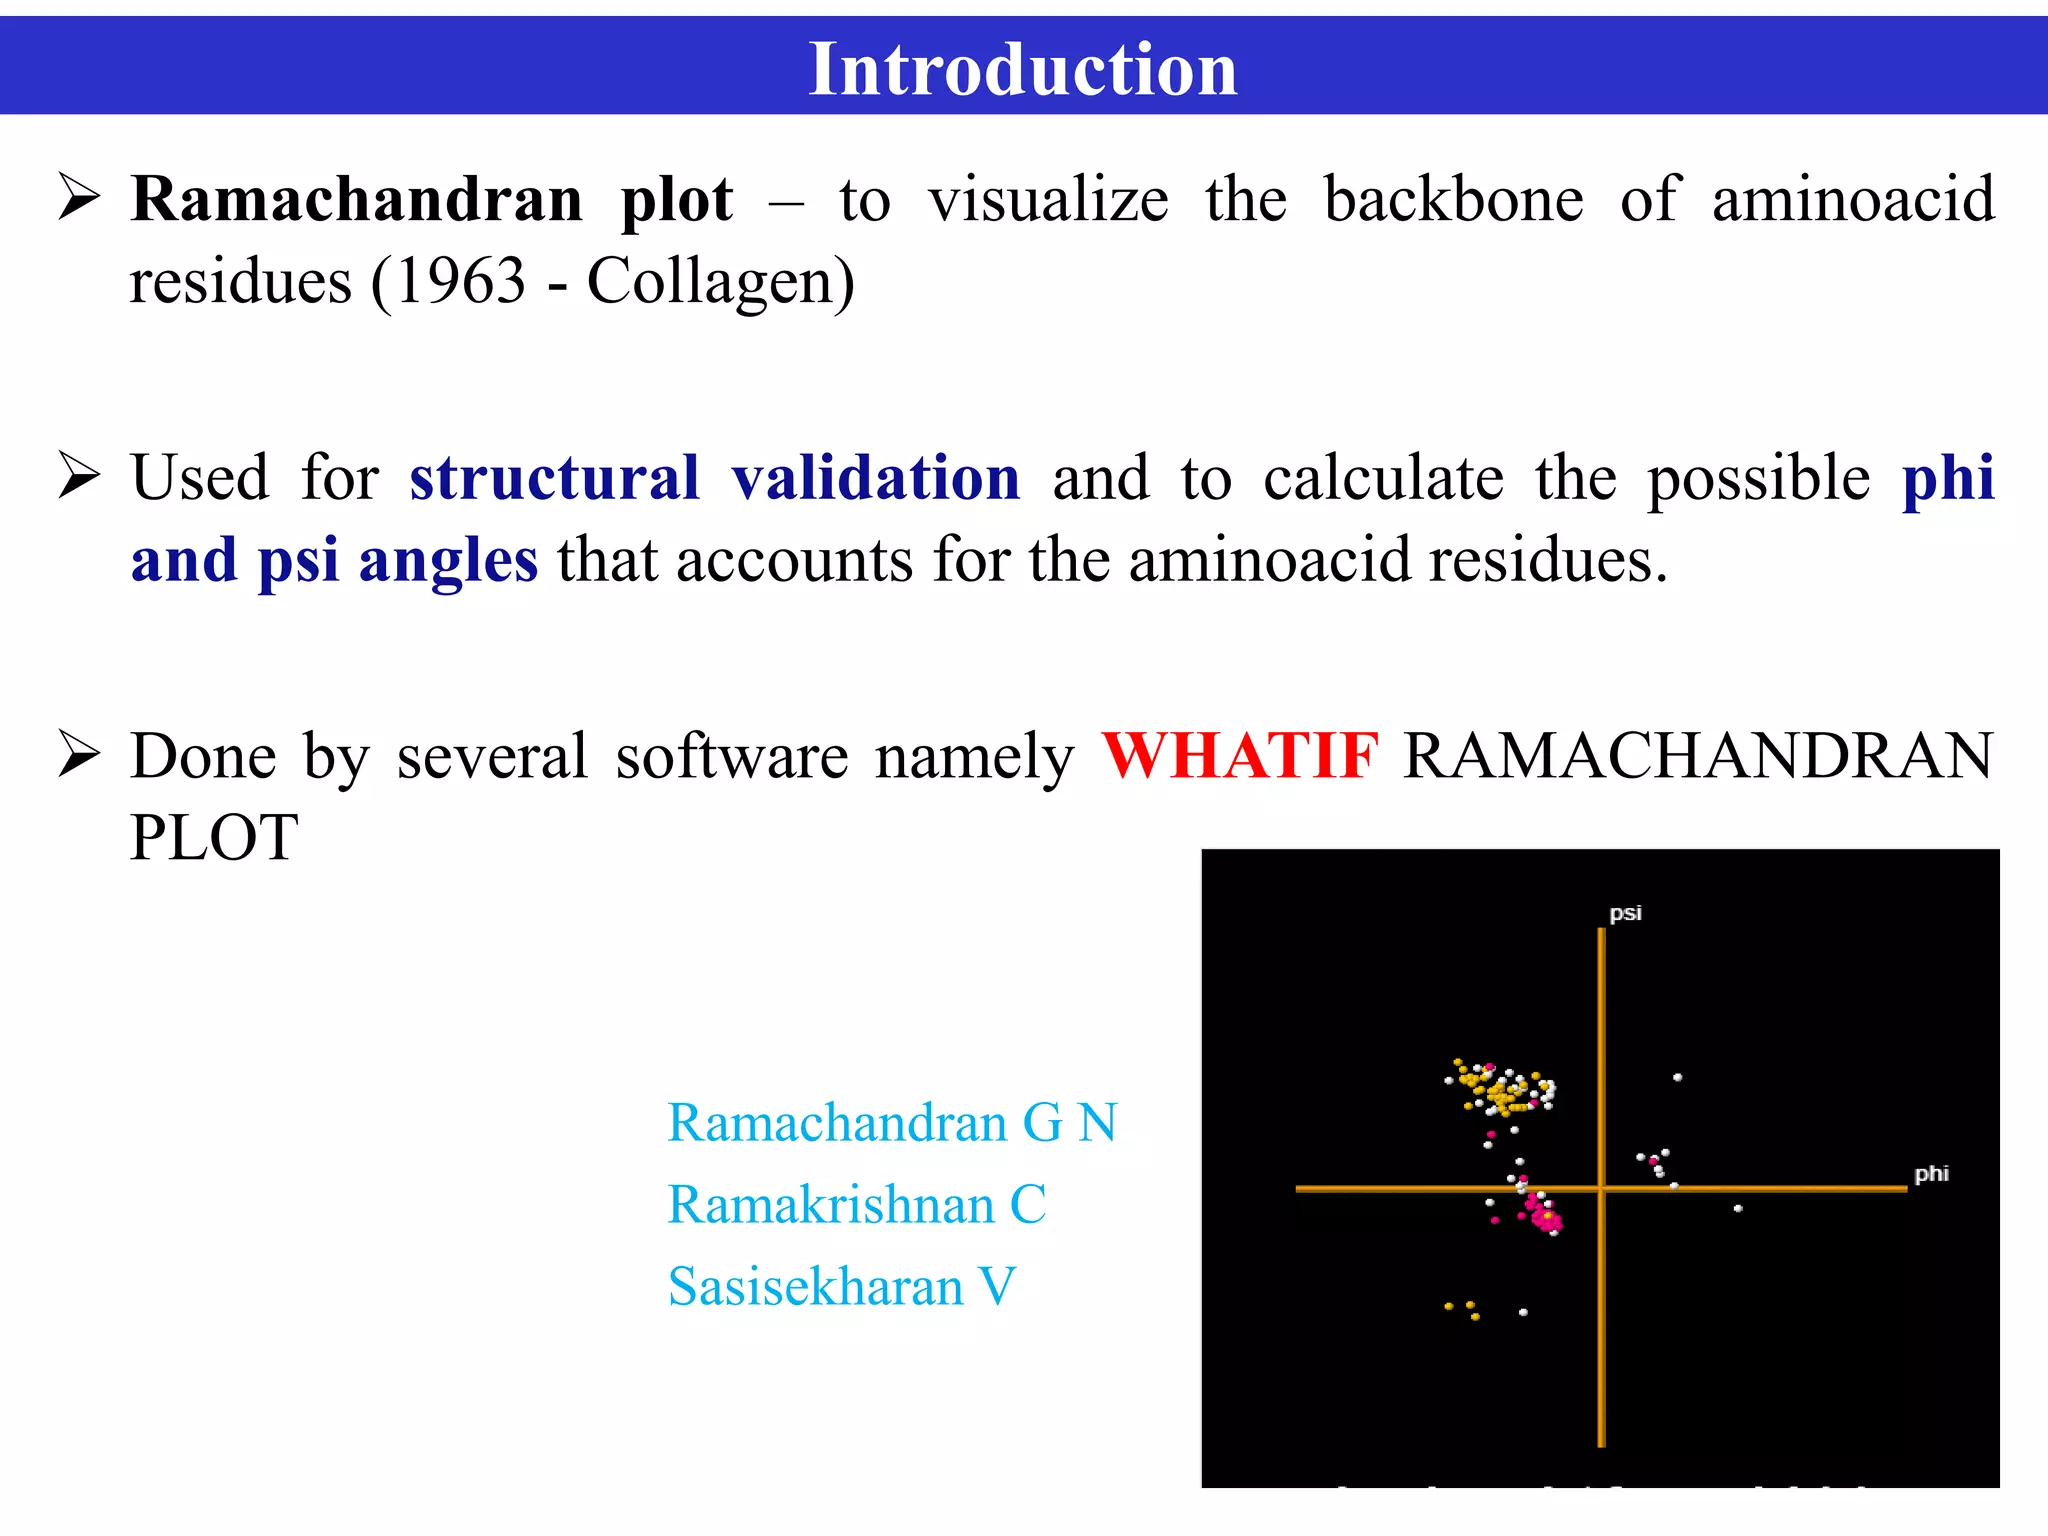

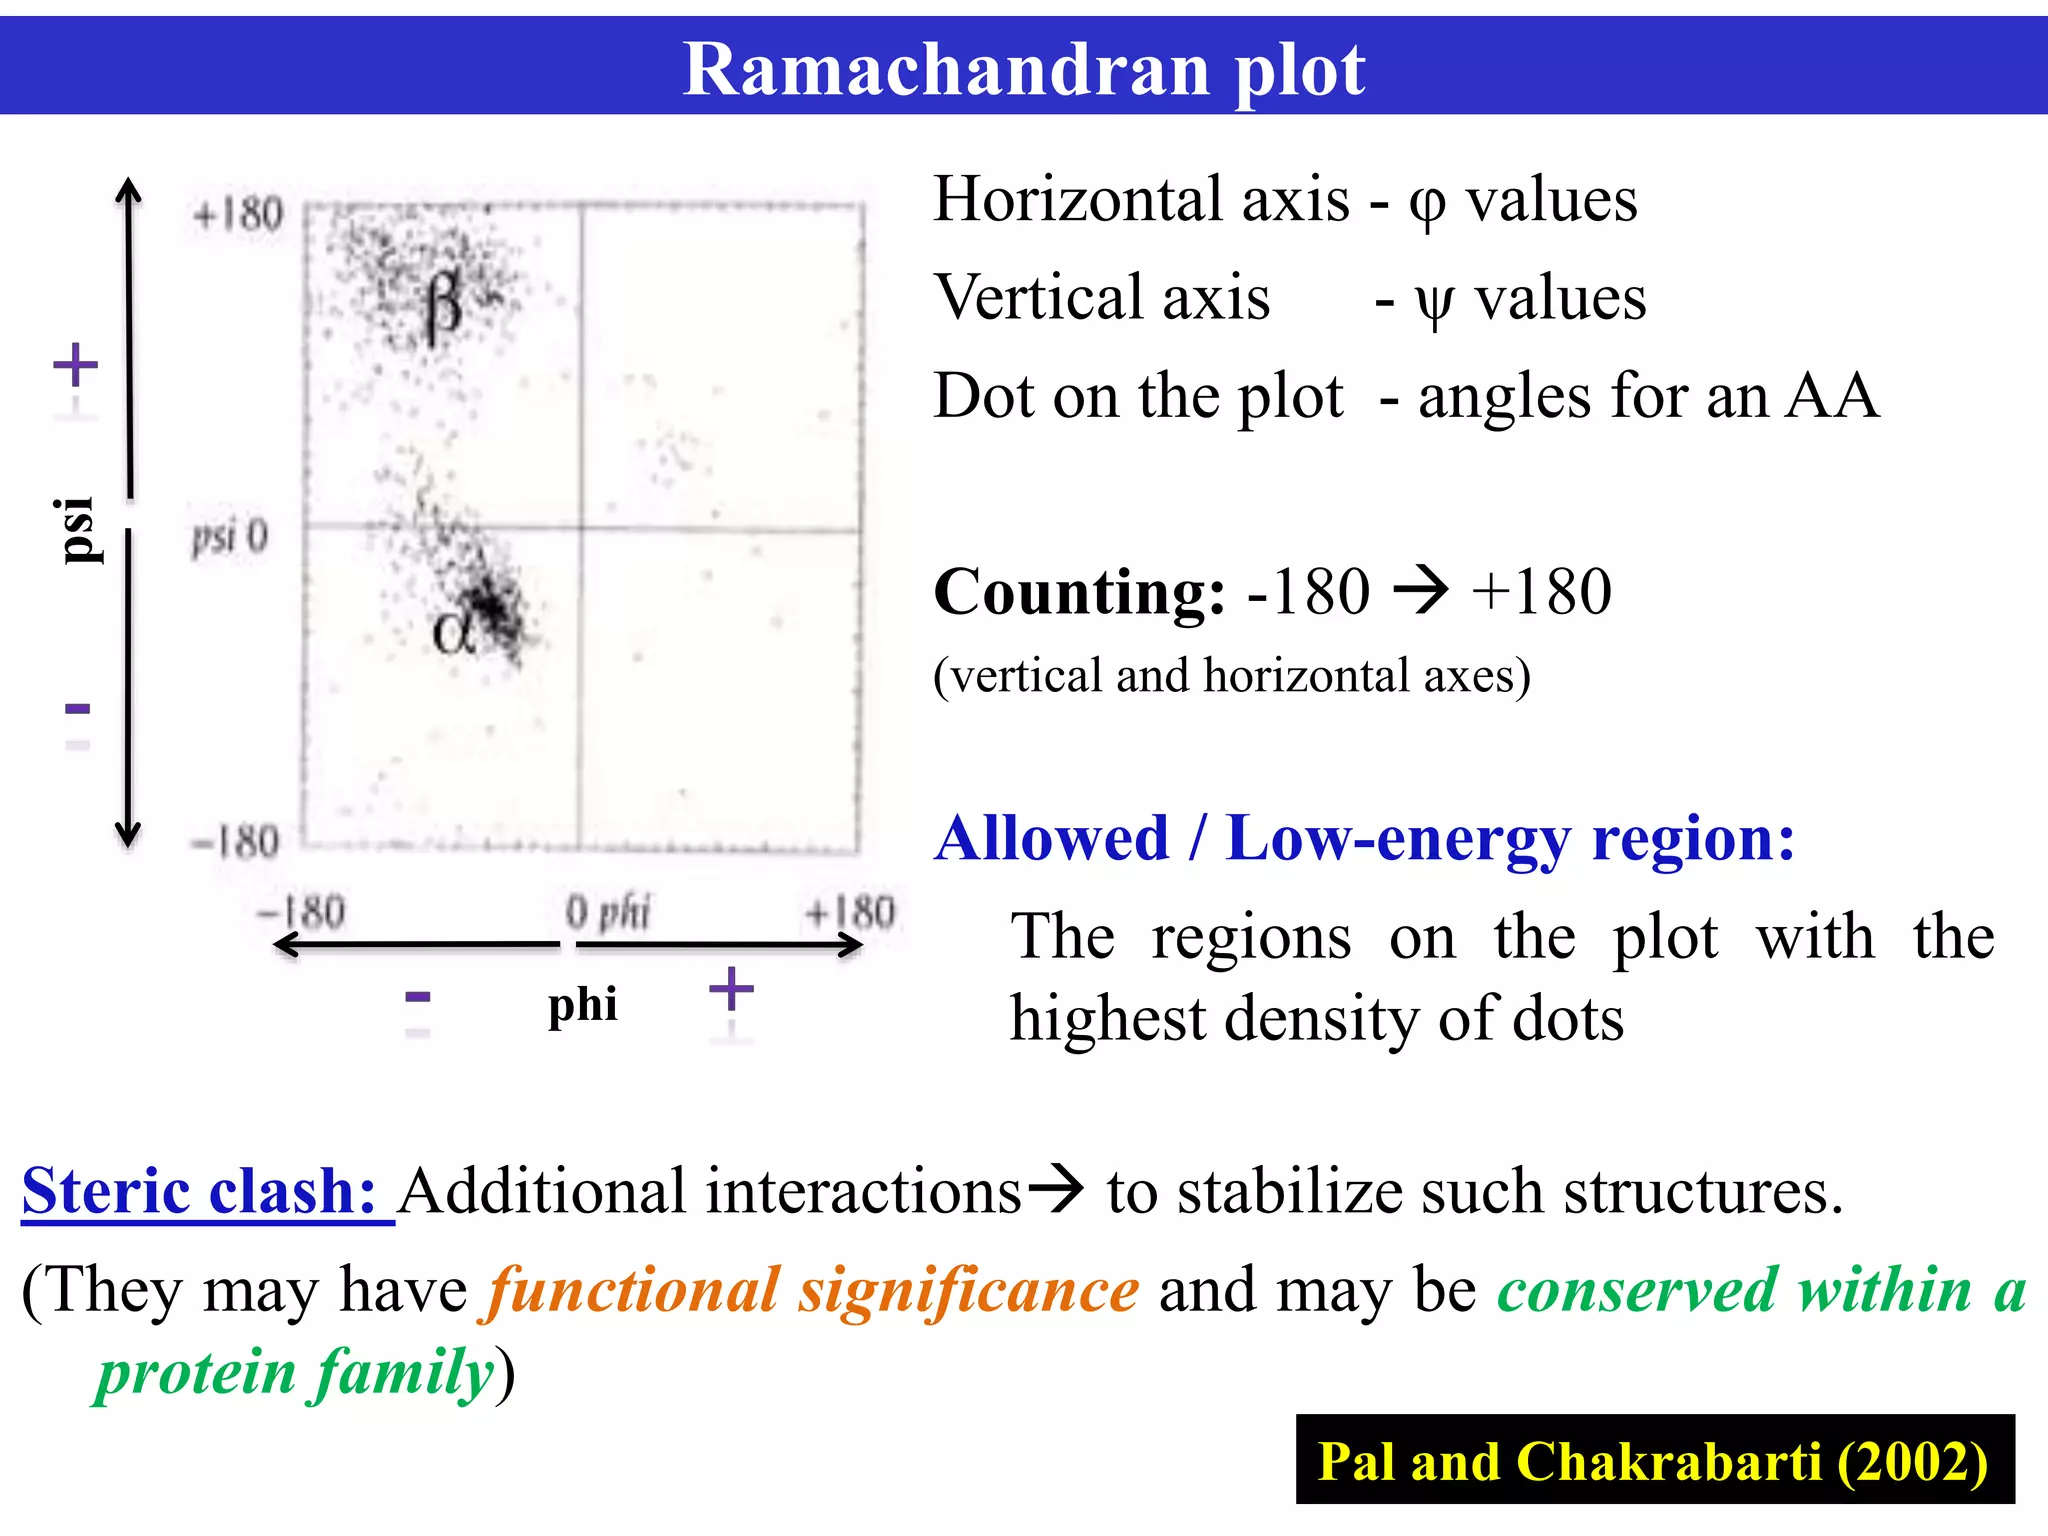


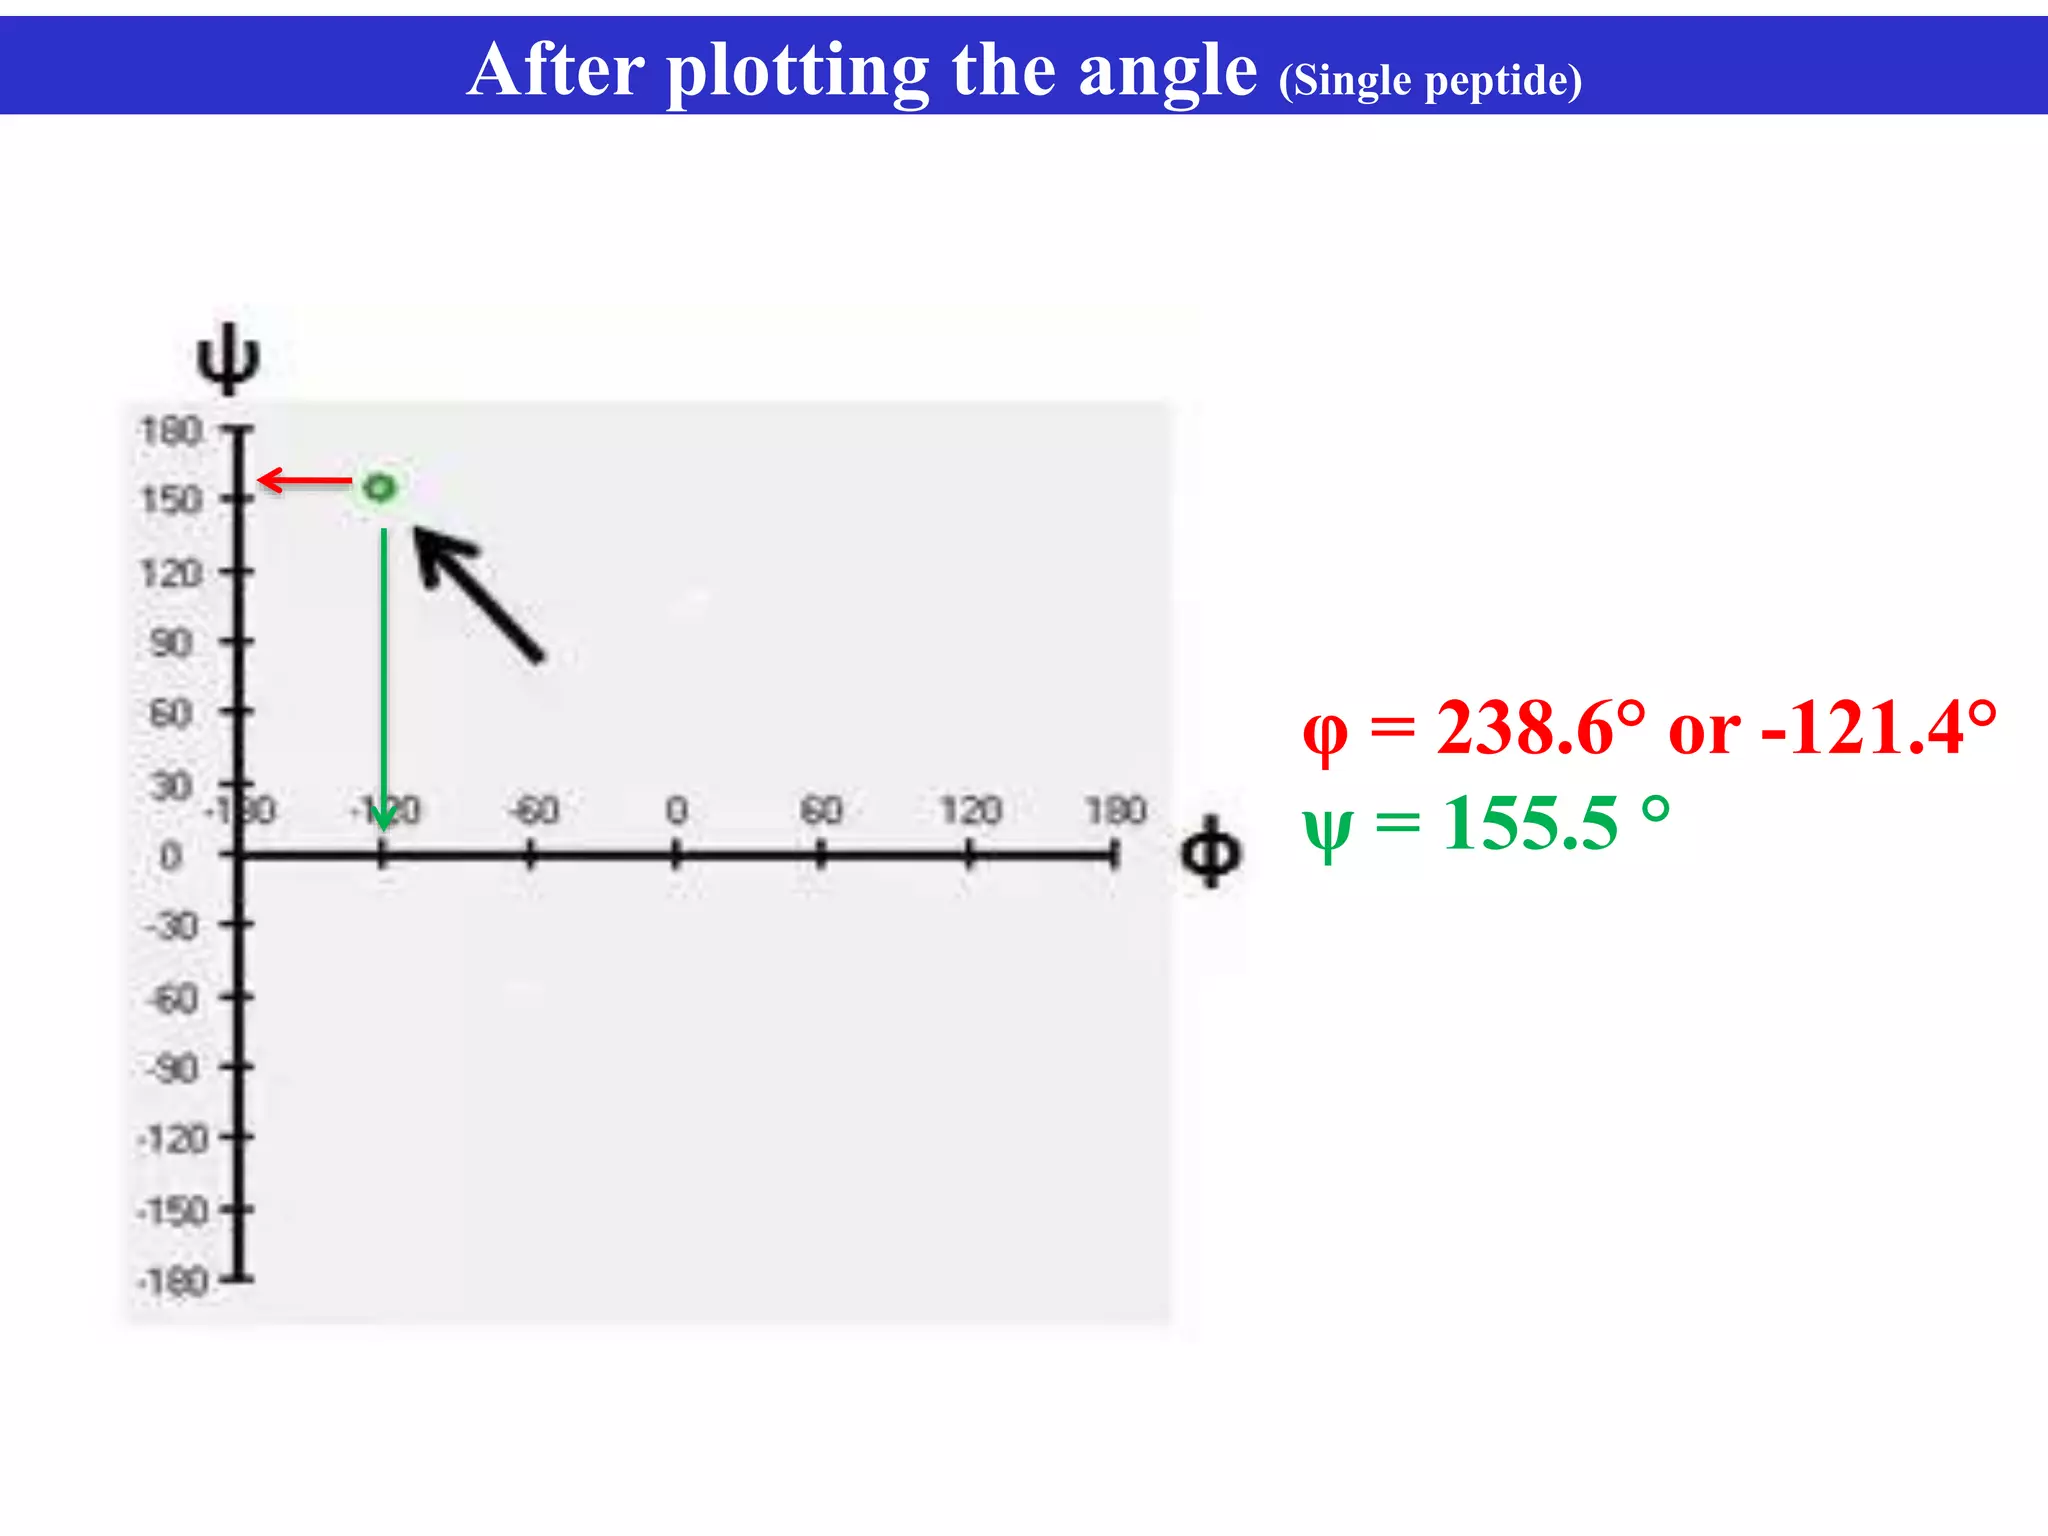
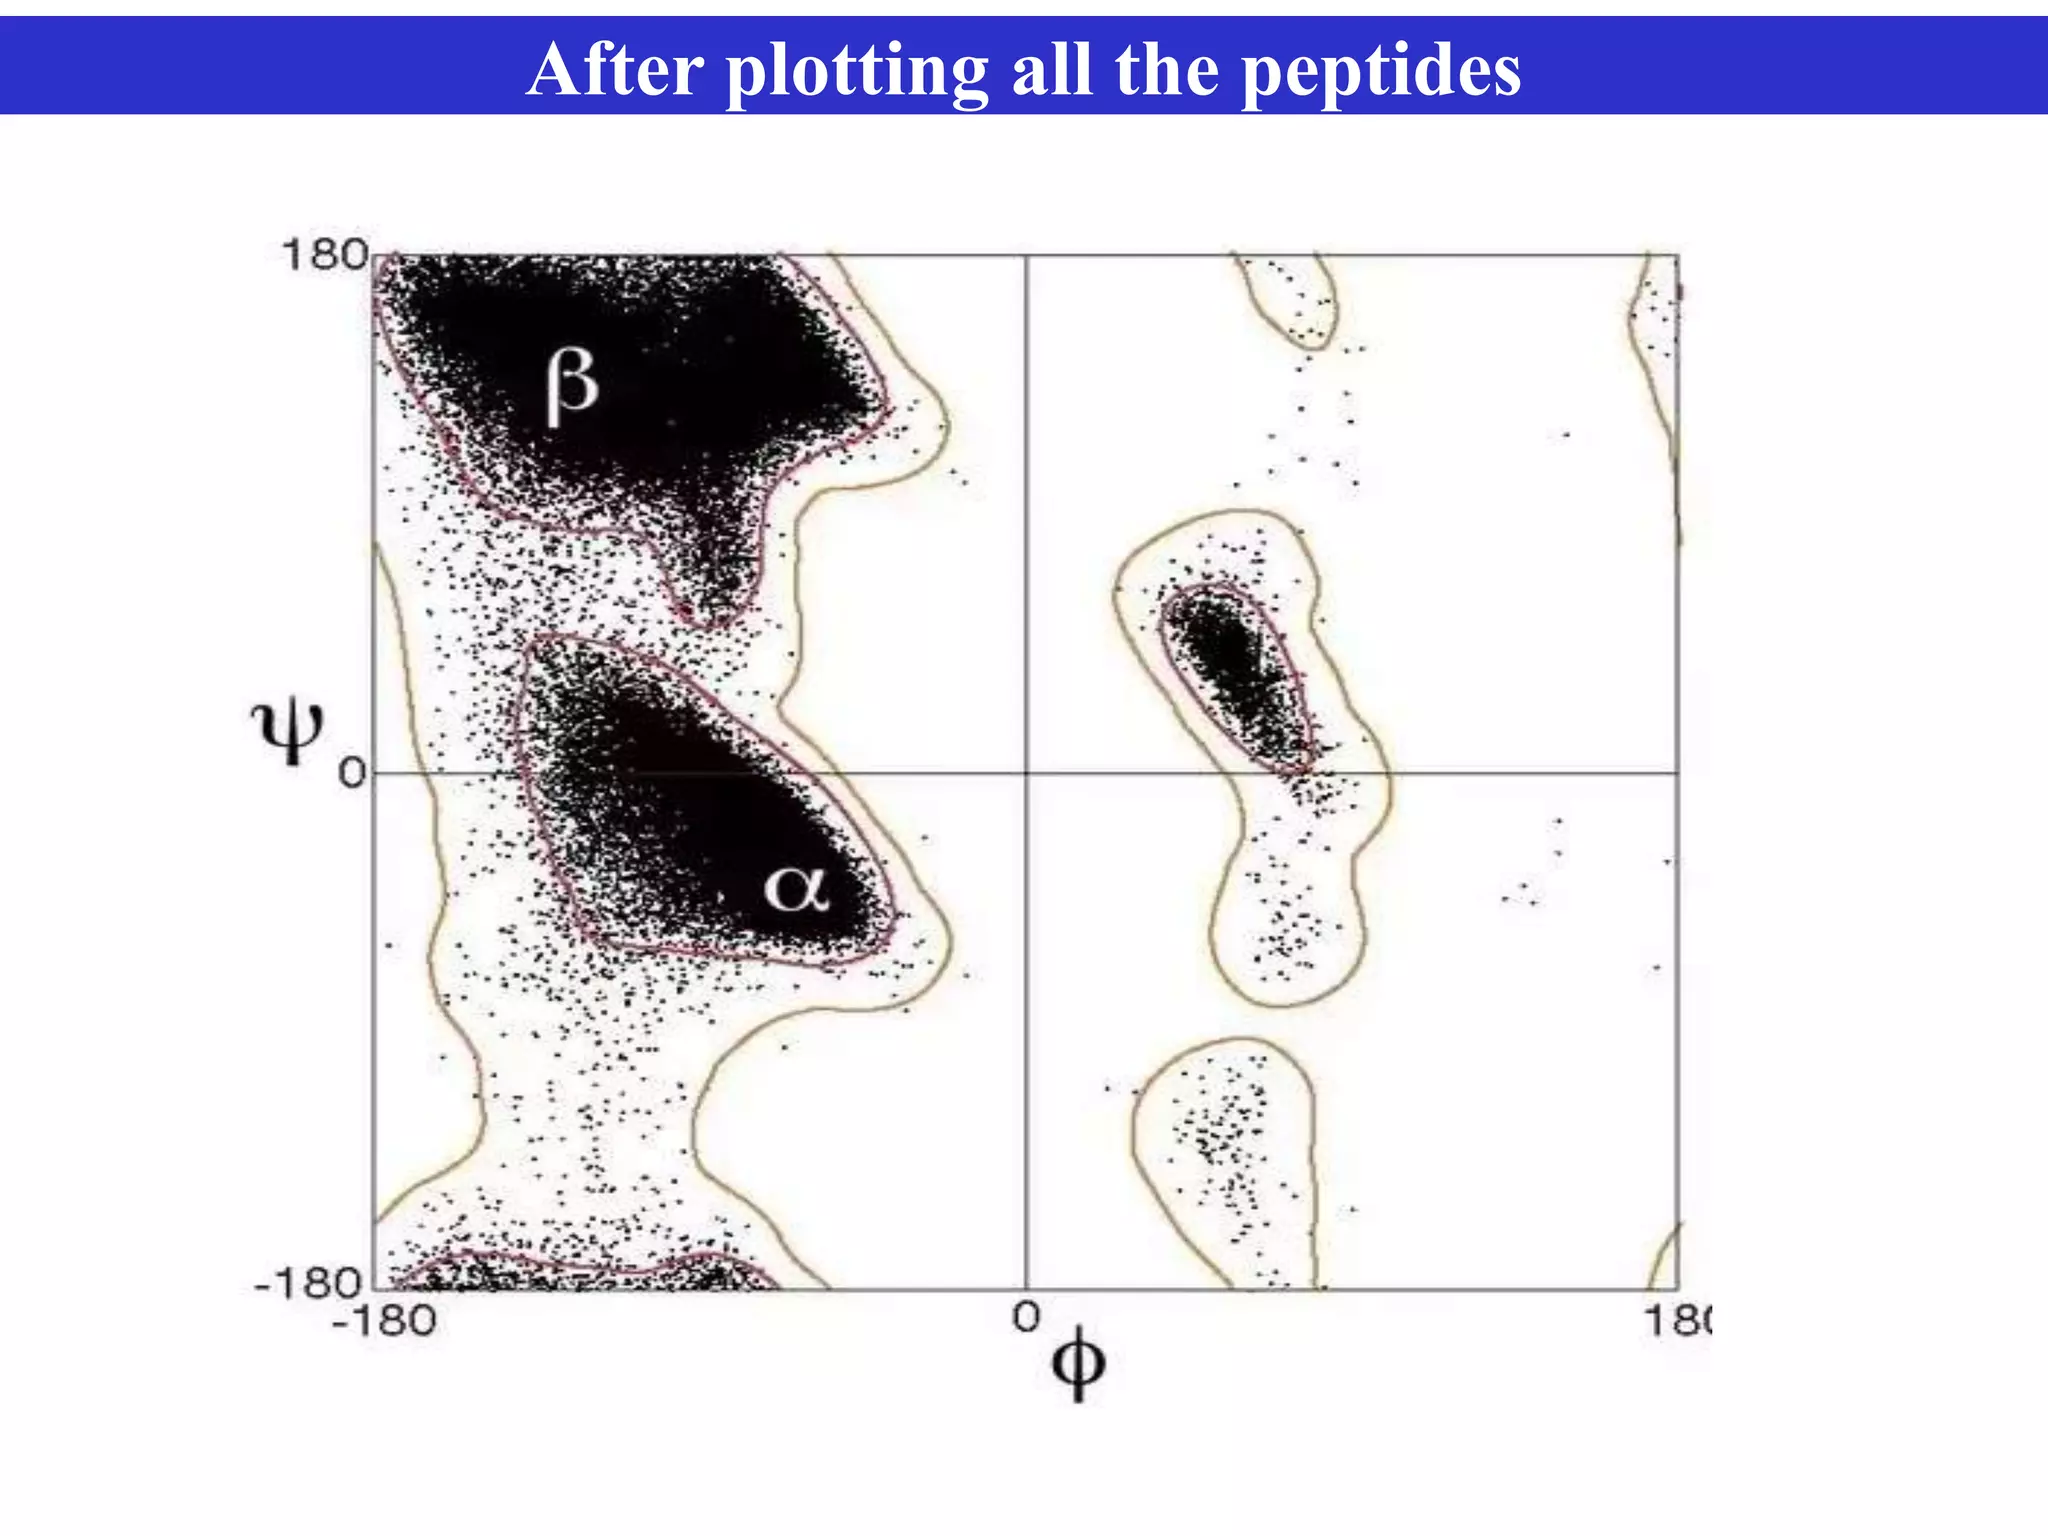

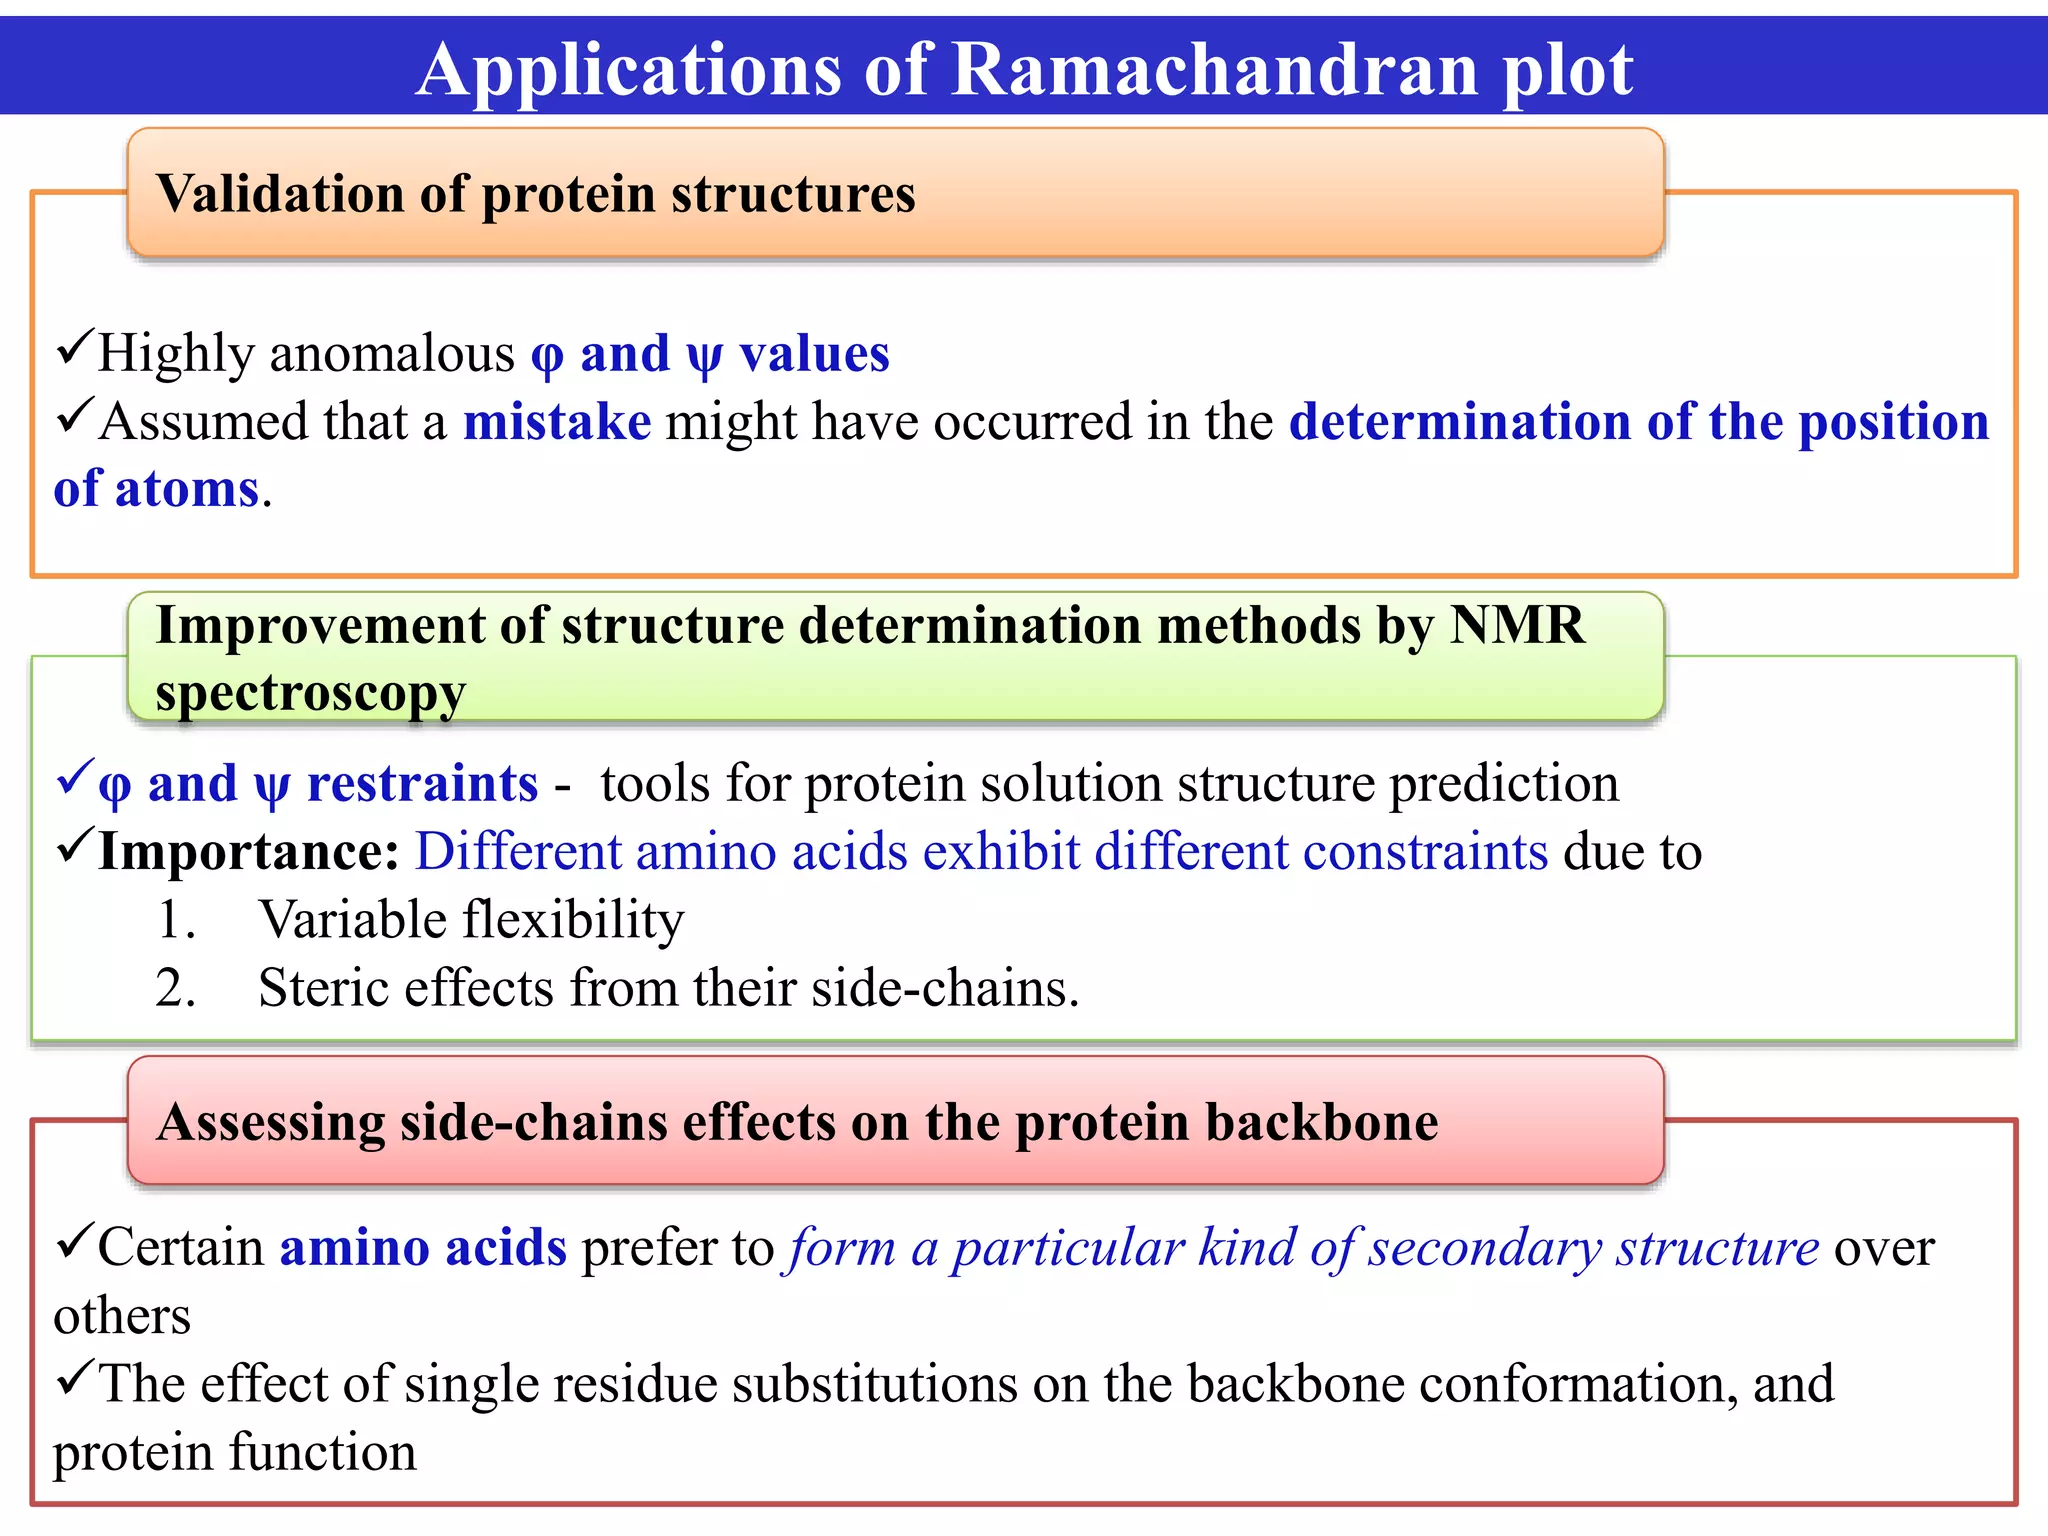
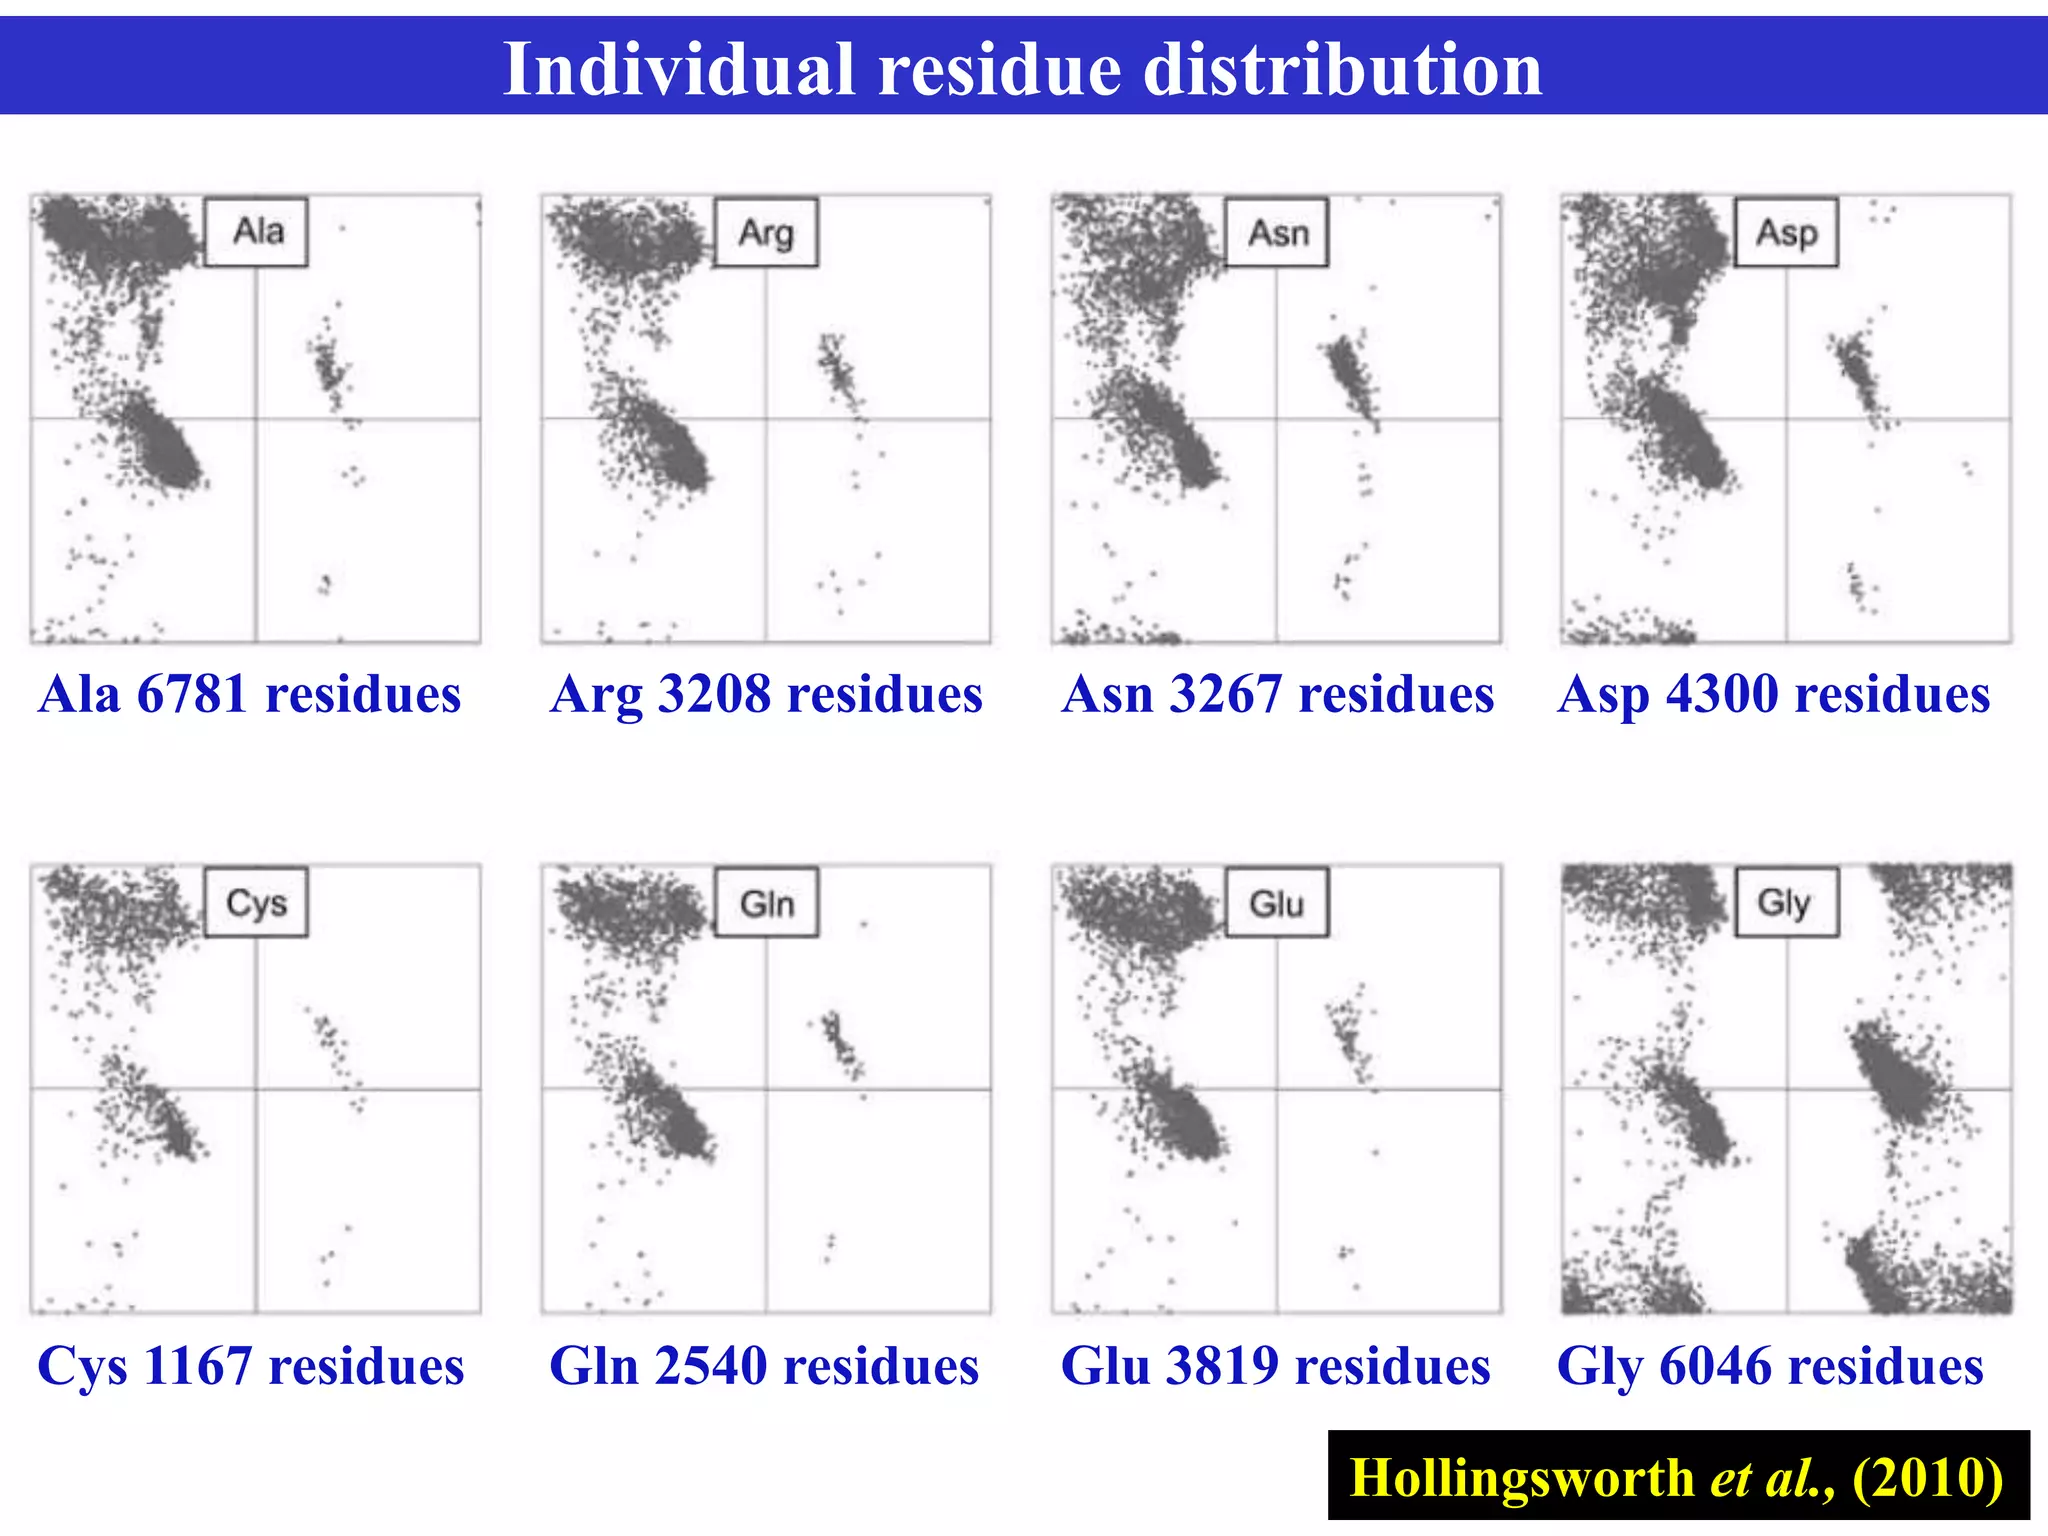


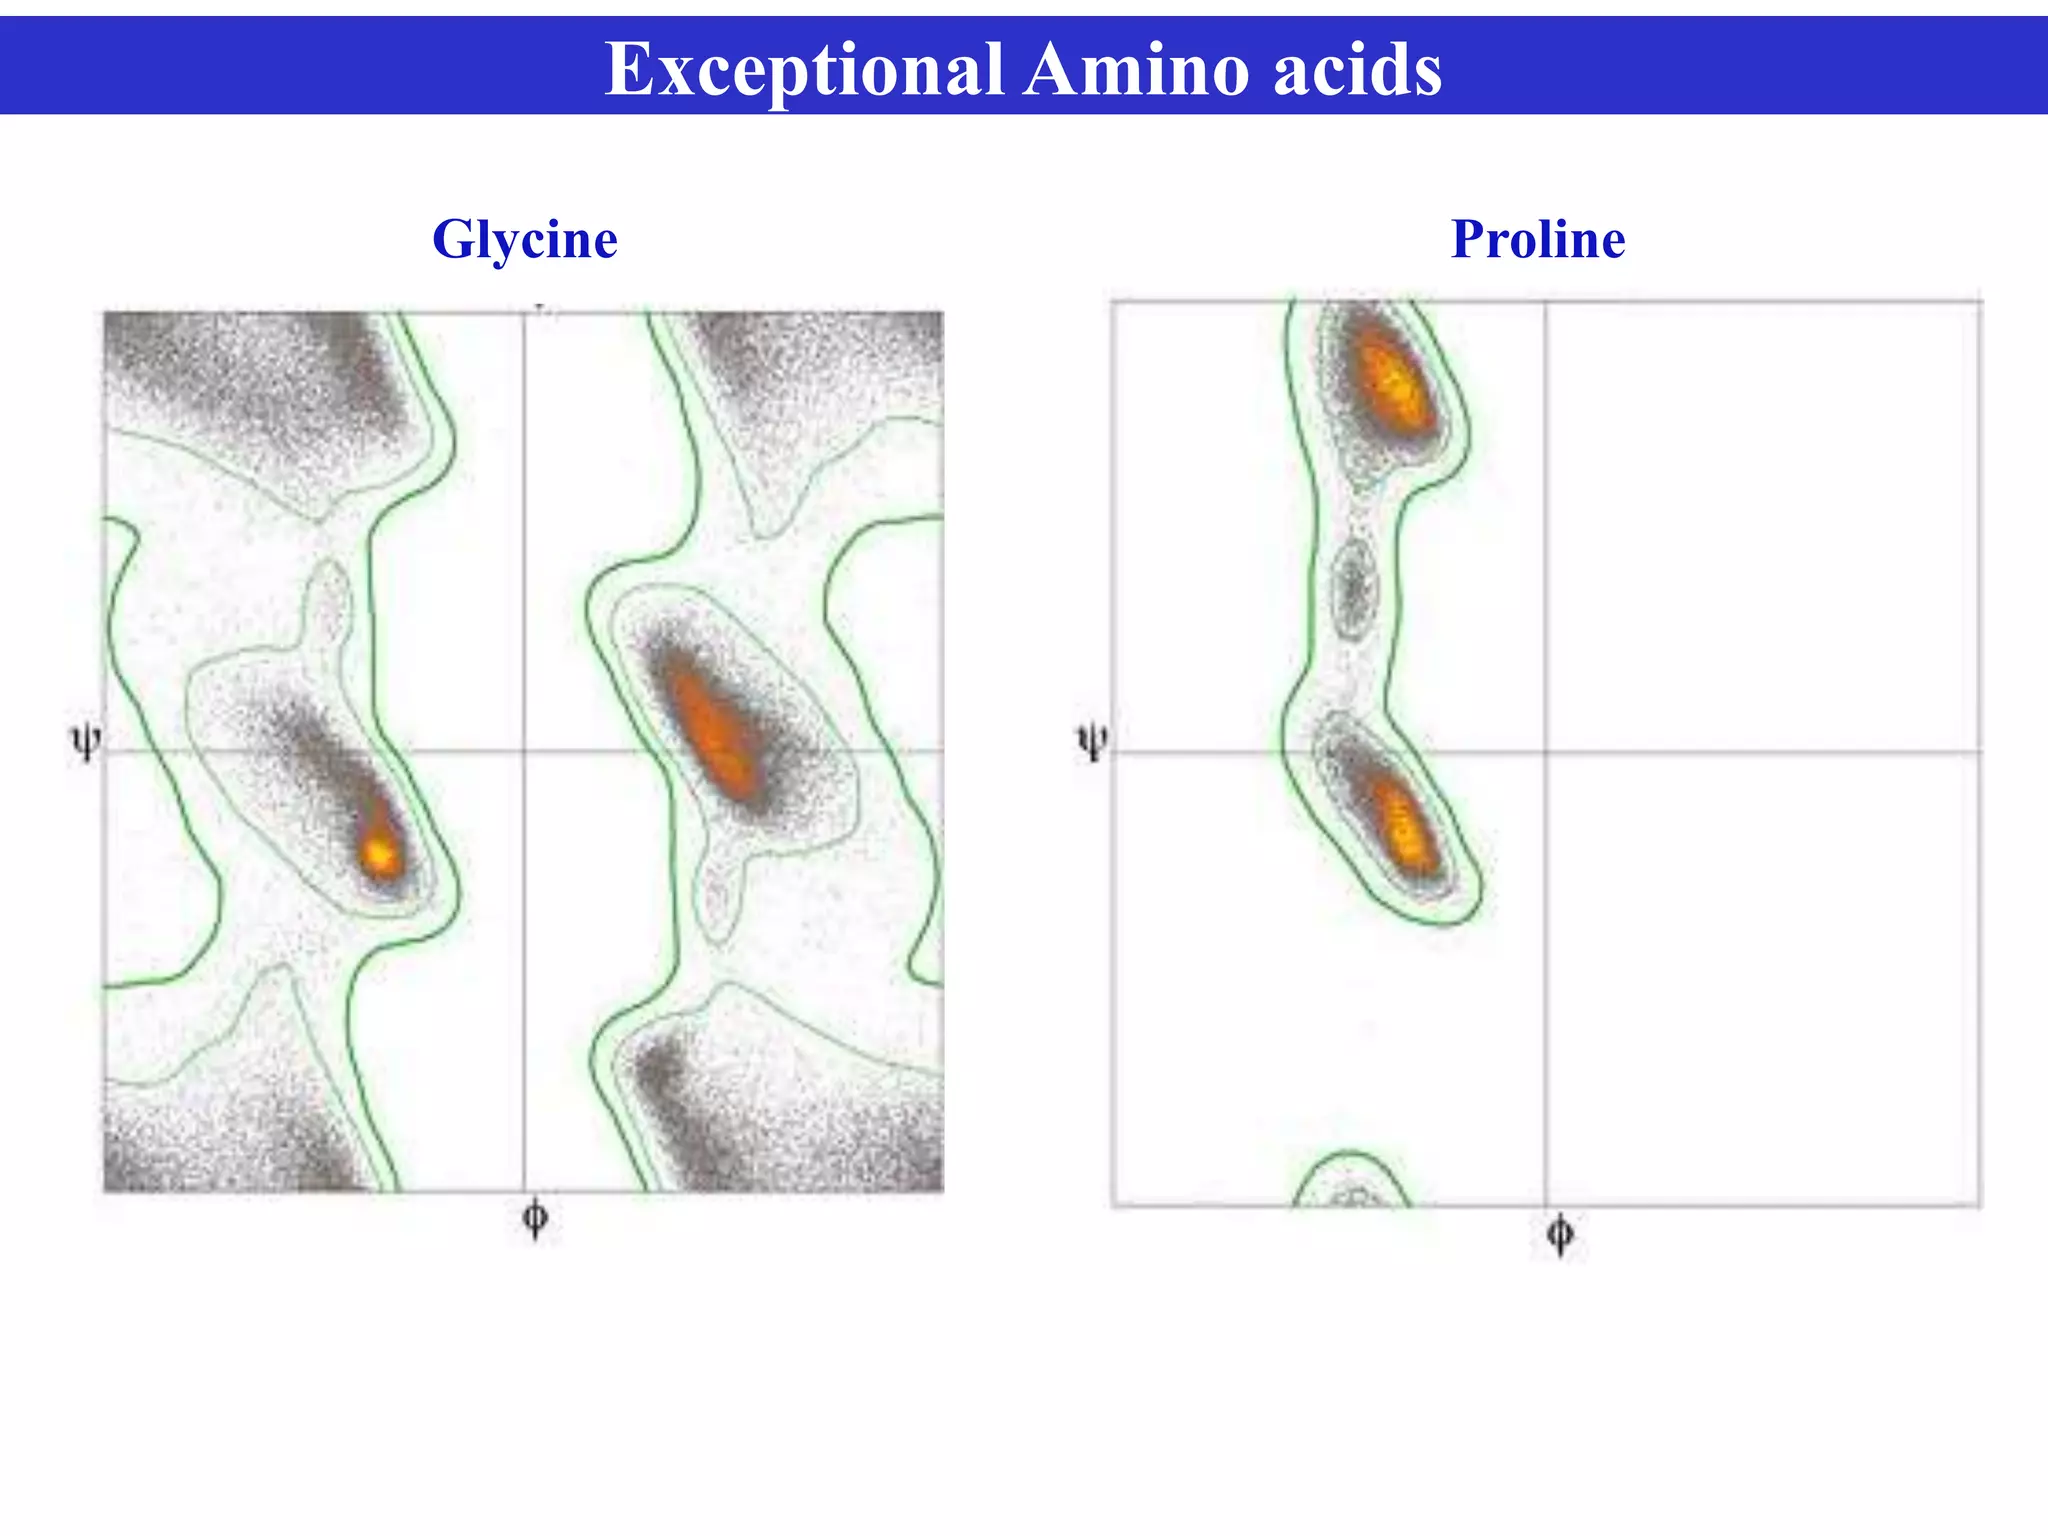
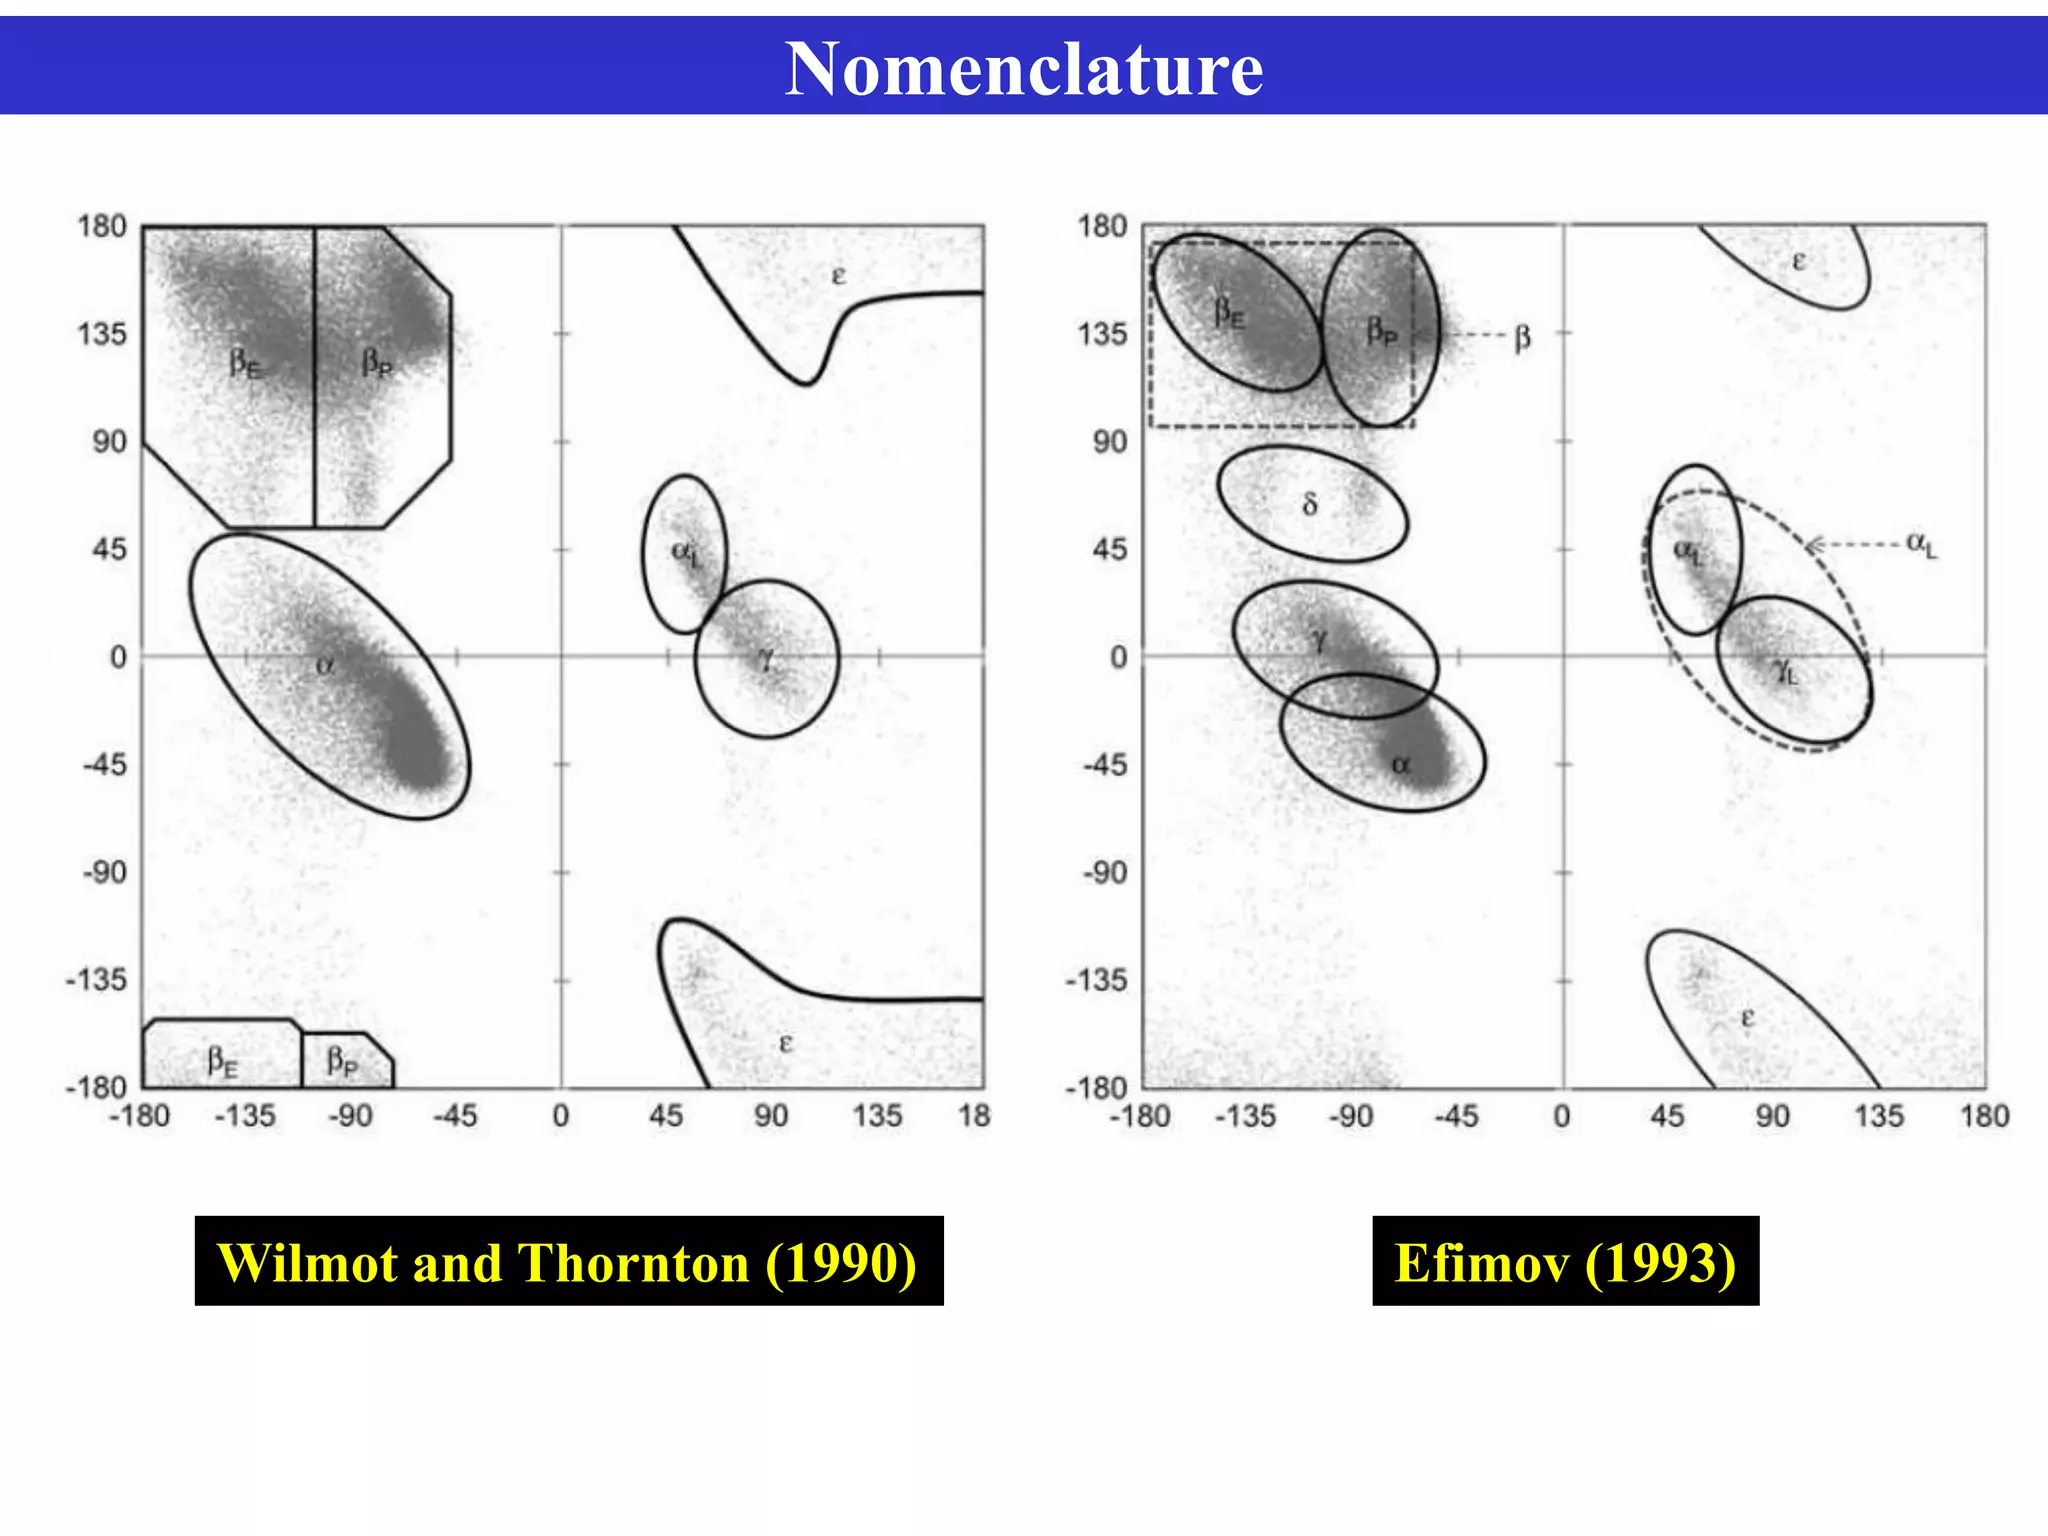


The document discusses Ramachandran plots, which are used to visualize allowed regions of dihedral angles phi and psi in protein backbone structures. Ramachandran plots show amino acid residues as dots in a two-dimensional map based on their phi and psi angles. Most residues cluster in favored regions corresponding to alpha helices and beta sheets. The document outlines how Ramachandran plots are constructed and analyzed using various software, and their applications in validating protein structures and understanding relationships between structure and amino acid sequence.