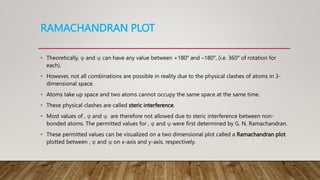
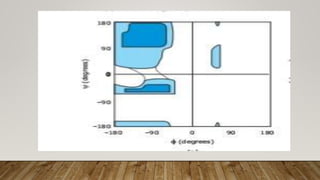
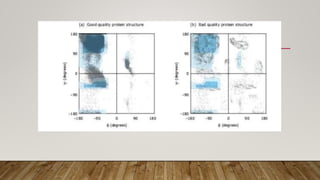
2. INTRODUCTION
• Ramachandran plot also known as a Ramachandran diagram or (φ and ψ ) plot was
originally developed in 1963 by G. N. Ramachandran, C. Ramakrishnan and V.
Sasisekharan.
• Ramachandran plot provides a simple two-dimensional graphic representation of all
possible protein structures in terms of torsion angles.
• Although the plot was developed using theoretical methods, mathematical
calculations and models building, once the protein structure began to discover, the
importance of plot was realized.
• Even after 55 years of its discovery, as more and more protein structures are being
discovered, it remains an important tool to confirm the accuracy of the structures.
3. PLANAR NATURE OF PEPTIDE BOND
• Polypeptides or proteins are most commonly, linear and unbranched polymers
composed of amino acids linked together by peptide bonds.
• Peptide bonds are amide linkages formed between α-amino group of one amino
acid and the α -carboxyl group of adjacent amino acid.
• This reaction is a condensation reaction, in which a water molecule is released and
the linked amino acids are referred to as amino acid residues.
• Thermodynamically, peptide bond formation is an endergonic process, with Δ G0
~ +21 kJ/mol.
4.
5. • The peptide C—N bond has a partial double bond character.
• Consequently, the peptide bond length is only 1.33 Å, which is between the
values expected for a C—N single bond (1.49 Å) and a C = N double bond (1.27
Å).
• The peptide bond appears to have approximately 40 percent double-bonded
character due to resonance.
• The oxygen has a partial negative charge and the nitrogen has a partial positive
charge, setting up a small electric dipole.
6. • The partial double bond character keeps the peptide bond in a rigid planar
configuration.
• Hence, for a pair of amino acids linked by a peptide bond, six atoms (C α, C, O, N,
H and C α) lie in the same plane.
7. TORSION ANGLES AND PEPTIDE BOND
• Torsion angles (or dihedral angles) are defined by four points in space.
• If a system of four atoms A – B – C – D is projected onto a plane normal to B – C,
the angle between the projection of A – B and the projection of C – D is described
as the torsion angle about bond B – C; this angle may also be described as the
angle between the plane containing atoms A, B and C and the plane containing
atoms B, C and D.
8.
9. • A peptide linkage has partial double-bond character, rotation about this bond is
restricted.
• Two possible configurations, cis and trans, are observed for a planar peptide
bond in polypeptides.
• In the cis configuration, successive α -carbon atoms are on the same side of the
peptide bond.
• In the trans configuration, the two successive α -carbon atoms are on opposite
sides of the peptide bond.
10. • The restricted rotation about C—N bond can be specified by torsion angle ω
(omega). In the trans configuration, ω = 180° and in the cis configuration
11. • The bonds between the nitrogen of amino group and the α -carbon atom (i.e. N—C α
bond) and between the α -carbon atom and the carbon of carbonyl group (i.e. C α —
C bond) are pure single bonds.
• The two adjacent rigid peptide units can rotate about these bonds, acquiring various
orientations.
• The rotations about these bonds can be specified by torsion angles φ (phi) and ψ
(psi).
• The torsion angle about the bond between the amino nitrogen and the α -carbon
atoms is called φ whereas, the torsion angle about the bond between the α -carbon
and the carbonyl carbon atoms is called ψ.
12.
13.
14. RAMACHANDRAN PLOT
• Theoretically, φ and ψ can have any value between +180° and –180°, (i.e. 360° of rotation for
each).
• However, not all combinations are possible in reality due to the physical clashes of atoms in 3-
dimensional space.
• Atoms take up space and two atoms cannot occupy the same space at the same time.
• These physical clashes are called steric interference.
• Most values of , φ and ψ are therefore not allowed due to steric interference between non-
bonded atoms. The permitted values for , φ and ψ were first determined by G. N. Ramachandran.
• These permitted values can be visualized on a two dimensional plot called a Ramachandran plot
plotted between , φ and ψ on x-axis and y-axis, respectively.
15. • Polypeptide conformations are defined by the values of φ and ψ.
• Most values of φ and ψ are not allowed due to steric interference between non-
bonded atoms.
• Hence, most areas of the Ramachandran plot (i.e. most combinations of φ and ψ)
represent sterically disallowed conformations of a polypeptide chain because of steric
collisions between side chains and main chain.
• In Ramachandran plot the white areas correspond to sterically disallowed
conformations in which any non-bonding interatomic distance is less than its
corresponding van der Waals radii.
16. • These regions are sterically disallowed for all amino acids except glycine which is
unique as it lacks a side chain.
• The dark blue regions called allowed regions correspond to conformations where
there are no steric interferences.
• Most of φ and ψ values of a polypeptide chain fall within these allowed regions of the
Ramachandran plot.
• There are, however, some notable exceptions.
• Glycine, the amino acid with a smallest side chain, is much less sterically restricted
than the other amino acid residues.
17. • Hence, its allowed range of φ and ψ covers a larger area of the Ramachandran
plot.
• At glycine residues, polypeptide chains often assume conformations that are
sterically disallowed to other residues.
• The cyclic side chain of proline limits its range of φ values to angles of around –
60°, making it most conformationally restricted amino acid residue.
• Light blue regions correspond to conformation having outer limit van der Waals
distances i.e. the atoms are allowed to come a little closer together.
18. • Since the D- and L-form of the amino acids have their side chain oriented
differently with respect to the CO group, hence, they have different allowed φ
and ψ angles.
• If polypeptides built from D-amino acids, they have different φ and ψ angles than
those that are exclusively made up of L-amino acids.
• For example, a β -sheet made up of L-amino acids occupies upper left quadrant
whereas, β -sheet made up of same amino acids of D-enantiomeric form would
occupy lower right quadrant.
19.
20. REGIONS OF RAMACHANDRAN PLOT
• Quadrant 1: Quadrant 1 is the area of confirmations, where all the confirmations
are allowed. In this, we can find left handed alpha.
• Quadrant 2: Quadrant 2 is the bigger region in the whole graph. Particularly, this
region has better conditions for the confirmation of atoms.
• Quadrant 3: Quadrant 3 is the biggest region after Quadrant 2. In this region, we
can find right handed alpha.
• Quadrant 4: Quadrant 4 has particularly no framed locale. This conformation (ψ
around 180 to 0 degrees, φ around 0 – 180 degrees) is disfavoured due to steric
conflict.
21. PREDICTING SECONDARY STRUCTURE FROM
RAMACHANDRAN PLOT
• Every amino acid residue in a polypeptide can have specific set of φ and ψ
angles, therefore, each residue can be represented as a point on Ramachandran
plot with corresponding φ and ψ angles as x and y coordinates, respectively.
• Polypeptides, when adopting secondary structures, rotate at specific torsional
angles each time so as to form regular repetitive structures such as α -helix and β
-sheet.
• Therefore, on plotting these torsional angles to Ramachandran plot, we obtain, a
very restricted area on the plot which can be used to identify and check the
secondary structure in a given polypeptide.
22. • The backbone torsion angles for right-handed α -helix are approximately φ = –
57° and ψ = –47° and therefore, occupies small area on lower-left quadrant. β -
sheet is made up of almost fully extended strands, with φ and ψ angles falling in
the upper-left quadrant of the Ramachandran plot.
23.
24. • Table 1 enlists dihedral angles of some commonly known secondary structures.
Several non-repetitive secondary structures such as random coil can be adopted
various torsional angles, therefore, can occupy variable regions in the allowed
area of Ramachandran plot.
• Table 1 Idealized φ and ψ angles for common secondary structures in protein
25. PREDICTING QUALITY OF PROTEIN STRUCTURE
USING RAMACHANDRAN PLOT
• The most important application of Ramachandran plot is the prediction of the
quality of various protein structure determined using experimental methods (X-
ray crystallography, NMR and Cryo-EM).
• A good quality structure contains all the set of torsional angles in the allowed
area whereas, a bad quality (low resolution) protein structure is reflected as a
number of torsional angles falling in the forbidden region.
• Besides experimental methods, protein structure obtained using homology
modeling or ab-initio methods are also routinely checked by plotting
Ramachandran plot
26.
27. UTILITY OF RAMACHANDRAN PLOT
• Theoretically, in this plot allowed region shows the value of phi/psi angle that are possible for
amino acid. Practically phi/psi value distribution is observed and used as structure validation of
protein.
• It visualizes the energetically allowed and forbidden region for the dihedral angles. Many
dihedral angles are found in the forbidden region of the Ramachandran plot for poor quality
homology models. These type of deviations indicate the problem with structure of polypeptide.
• Earlier because of several angles, confirmation of residue was not possible to determine because
of steric hindrance. By using Ramachandran plot scientists could determine protein structure,
which torsional angle are permitted in plot and obtain the right insight into the peptide
structure.