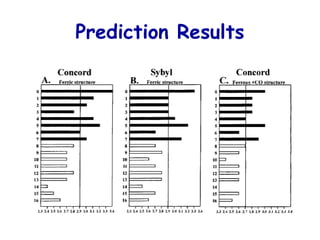
Activity RelationshipsActivity Relationships
Quantitative StructureQuantitative Structure--
Saramita ChakravartiSaramita Chakravarti
Research Scientist II (iResearch Scientist II (i((
Chembiotech LaboratoriesChembiotech Laboratories
Why QSAR?
The number of compounds required for
synthesis in order to place 10 different groups
in 4 positions of benzene ring is 104
Solution: synthesize a small number of
compounds and from their data derive rules to
predict the biological activity of other
compounds.
QSAR and Drug Design
Compounds + biological activity
New compounds with
improved biological activity
QSAR
What is QSAR?
A QSAR is a mathematical relationship
between a biological activity of a molecular
system and its geometric and chemical
characteristics.
QSAR attempts to find consistent relationship
between biological activity and molecular
properties, so that these “rules” can be used to
evaluate the activity of new compounds.
Statistical Concepts
Input: n descriptors P1,..Pn and the value of
biological activity (EC50 for example) for
m compounds.
Bio P1 P2 ... Pn
Cpd1 0.7 3.7
Cpd2 3.2 0.4
…
Cpdm
Statistical Concepts
The problem of QSAR is to find coefficients
C0,C1,...Cn such that:
Biological activity = C0+(C1*P1)+...+(Cn*Pn)
and the prediction error is minimized for a list of
given m compounds.
Partial least squares (PLS) is a technique used for
computation of the coefficients of structural
descriptors.
3D-QSAR
Structural descriptors are of immense importance in
every QSAR model.
Common structural descriptors are pharmacophores
and molecular fields.
Superimposition of the molecules is necessary.
3D data has to be converted to 1D in order to use
PLS.
3D-QSAR Assumptions
The effect is produced by modeled compound and not it’s
metabolites.
The proposed conformation is the bioactive one.
The binding site is the same for all modeled compounds.
The biological activity is largely explained by enthalpic
processes.
Entropic terms are similar for all the compounds.
The system is considered to be at equilibrium, and
kinetics aspects are usually not considered.
Pharmacokinetics: solvent effects, diffusion, transport are
not included.
QSAR and 3D-QSAR
Software
Tripos – CoMFA, VolSurf
MSI – Catalyst, Serius
Docking Software
DOCK – Kuntz
Flex – Lengauer
LigandFit – MSI Catalyst
3D molecular fields
A molecular field may be represented by 3D
grid.
Each voxel represents attractive and repulsive
forces between an interacting partner and a
target molecule.
An interacting partner can be water, octanol or
other solvents.
Common 3D molecular fields
MEP – Molecular Electrostatic Potential (unit positive
charge probe).
MLP – Molecular Lipophilicity Potential (no probe
necessary).
GRID – total energy of interaction: the sum of steric
(Lennard-Jones), H-bonding and electrostatics (any
probe can be used).
CoMFA – standard: steric and electrostatic, additional:
H-bonding, indicator, parabolic and others.
Comparative Molecular Field
Analysis (CoMFA) - 1988
Compute molecular fields grid
Extract 3D descriptors
Compute coefficients of QSAR equation
CoMFA molecular fields
A grid wit energy fields is calculated by placing
a probe atom at each voxel.
The molecular fields are:
Steric (Lennard-Jones) interactions
Electrostatic (Coulombic) interactions
A probe is sp3
carbon atom with charge of +1.0
CoMFA 3D-QSAR
Each grid voxel corresponds to two variables
in QSAR equation: steric and electrostatic.
The PLS technique is applied to compute the
coefficients.
Problems:
Superposition: the molecules must be
optimally aligned.
Flexibility of the molecules.
3D-QSAR of CYP450cam
with CoMFA
• Training dataset from 15 complexes of
CYP450 with different compounds was used.
• The alignment of the compounds was done by
aligning of the CYP450
proteins from the
complexes.
3D-QSAR of CYP450cam
with CoMFA
Maps of electrostatic
fields:
BLUE - positive charges
RED - negative charges
Maps of steric fields:
GREEN - space filling
areas for best Kd
YELLOW - space
conflicting areas
VOLSURF
The VolSurf program predicts a variety of
ADME properties based on pre-calculated
models. The models included are:
• drug solubility
• Caco-2 cell absorption
• blood-brain barrier permeation
• distribution
VOLSURF
VolSurf reads or computes molecular
fields, translates them to simple molecular
descriptors by image processing techniques.
These descriptors quantitatively
characterize size, shape, polarity, and
hydrophobicity of molecules, and the balance
between them.
VOLSURF Descriptors
Size and shape: volume V, surface area S, ratio volume
surface V/S, globularity S/Sequiv (Sequiv is the surface area of a
sphere of volume V).
Hydrophilic: hydrophilic surface area HS, capacity factor
HS/S.
Hydrophobic: like hydrophilic LS, LS/S.
Interaction energy moments: vectors pointing from the
center of the mass to the center of hydrophobic/hydrophilic
regions.
Mixed: local interaction energy minima, energy minima
distances, hydrophilic-lipophilic balance HS/LS, amphiphilic
moments, packing parameters, H-bonding, polarisability.
VOLSURF
hydrophobic (blue) and hydrophilic (red) surface
area of diazepam.
Catalyst
Catalyst develops 3D models (pharmacophores) from a
collection of molecules possessing a range of diversity in
both structures and activities.
Catalyst specifies hypotheses in terms of chemical
features that are likely to be important for binding to the
active site.
Each feature consists of four parts:
Chemical function
Location and orientation in 3D space
Tolerance in location
Weight
Catalyst Features
• HB Acceptor and Acceptor-Lipid
• HB Donor
• Hydrophobic
• Hydrophobic aliphatic
• Hydrophobic aromatic
• Positive charge/Pos. Ionizable
• Negative charge/Neg. Ionizable
• Ring Aromatic
Catalyst HipHop
Feature-based pharmacophore modeling:
uses ONLY active ligands
no activity data required
identifies binding features for drug-receptor
interactions
generates alignment of active leads
the flexibility is achieved by using multiple
conformers
alignment can be used for 3D-QSAR analysis
Catalyst HipoGen
Activity-based pharmacophore modeling:
uses active + inactive ligands
activity data required (concentration)
identifies features common to actives missed by
inactives
used to “predict” or estimate activity of new ligands
Catalyst CYP3A4
substrates pharmacophore
Hydrophobic area, h-bond
donor, 2 h-bond acceptors
Saquinavir (most active compound)
fitted to pharmacophore
Catalyst CYP2B6
substrates pharmacophore
3hydrophobic areas, h-bond
acceptor
7-ethoxy-4-trifluoromethylcoumarin
fitted to pharmacophore
Catalyst Docking – Ligand Fit
Active site finding
Conformation search of ligand against site
Rapid shape filter
determines which
conformations should be
scored
Grid-based scoring for those
conformations passing the filter
Catalyst Docking – Ligand
Flexibility
Monte Carlo search in torsional space
Multiple torsion changes simultaneously
The random window size depends on the
number of rotating atoms
Catalyst Docking – Scoring
pKi = – c – x (vdW_Exact/ Grid_Soft)
+ y (C+_pol)
– z (Totpol^ 2)
• vdW = softened Lennard-Jones 6-9 potential
• C+_pol = buried polar surface area involved in attractive
ligand-protein interactions
• Totpol^ 2 = buried polar surface area involved in both
attractive and repulsive protein-ligand interactions
3D-QSAR of CYP450cam
with DOCK
Goal:
• Test the ability of DOCK to discriminate between
substrates and non-substrates.
Assumption:
• Non-substrate candidate is a compound that
doesn’t fit to the active site of CYP, but fits to the
site of it’s L244A mutant.
Methods
Docking of 20,000 compounds to ‘bound’ structure of
CYP and L244A mutant.
11 substrate candidates were selected from 500 high
scoring compounds for CYP.
6 non-substrate candidates were selected from a
difference list of L244A and CYP.
Optimization of compounds 3D structures by SYBYL
molecular mechanics program and re-docking. As a result 2
compounds move from “non-substrate” list to “substrate”
list and one in the opposite direction.
Prediction Results
All compounds predicted as “non-substrates” shown no
biological activity.
4 of the 11 molecules predicted as “substrates” were
found as non-substrates.
The predictions of DOCK are sensitive to the parameter
of minimum distance allowed between an atom of the
ligand and the receptor (penetration constrains).
Prediction Results
References
Cruciani et al., Molecular fields in quantitative structure-permeation
relationships: the VolSurf approach, J. Mol. Struct. (Theochem), 2000,
503:17-30
Cramer et al.,Comparative Molecular Field Analysis (CoMFA). 1. Effect of
shape on Binding of steroids to Carrier proteins, J. Am. Chem. Soc. 1988,
110:5959-5967
Ekins et al., Progress in predicting human ADME parameters in silico, J.
Pharmacological and Toxicological Methods 2000, 44:251-272
De Voss et al., Substrate Docking Algorithms and Prediction of the
Substrate Specifity of Cytochrome P450cam and its L244A Mutant, J. Am.
Chem. Soc. 1997, 119:5489-5498
Ekins et al., Three-Dimensional Quantative Structure Activity Relationship
Analyses of Substrates for CYP2B6, J. Pharmacology and Experimental
Therapeutics, 1999, 288:21-29

QSAR : Activity Relationships Quantitative Structure

  • 1.
    Activity RelationshipsActivity Relationships QuantitativeStructureQuantitative Structure-- Saramita ChakravartiSaramita Chakravarti Research Scientist II (iResearch Scientist II (i(( Chembiotech LaboratoriesChembiotech Laboratories
  • 2.
    Why QSAR? The numberof compounds required for synthesis in order to place 10 different groups in 4 positions of benzene ring is 104 Solution: synthesize a small number of compounds and from their data derive rules to predict the biological activity of other compounds.
  • 3.
    QSAR and DrugDesign Compounds + biological activity New compounds with improved biological activity QSAR
  • 4.
    What is QSAR? AQSAR is a mathematical relationship between a biological activity of a molecular system and its geometric and chemical characteristics. QSAR attempts to find consistent relationship between biological activity and molecular properties, so that these “rules” can be used to evaluate the activity of new compounds.
  • 5.
    Statistical Concepts Input: ndescriptors P1,..Pn and the value of biological activity (EC50 for example) for m compounds. Bio P1 P2 ... Pn Cpd1 0.7 3.7 Cpd2 3.2 0.4 … Cpdm
  • 6.
    Statistical Concepts The problemof QSAR is to find coefficients C0,C1,...Cn such that: Biological activity = C0+(C1*P1)+...+(Cn*Pn) and the prediction error is minimized for a list of given m compounds. Partial least squares (PLS) is a technique used for computation of the coefficients of structural descriptors.
  • 7.
    3D-QSAR Structural descriptors areof immense importance in every QSAR model. Common structural descriptors are pharmacophores and molecular fields. Superimposition of the molecules is necessary. 3D data has to be converted to 1D in order to use PLS.
  • 8.
    3D-QSAR Assumptions The effectis produced by modeled compound and not it’s metabolites. The proposed conformation is the bioactive one. The binding site is the same for all modeled compounds. The biological activity is largely explained by enthalpic processes. Entropic terms are similar for all the compounds. The system is considered to be at equilibrium, and kinetics aspects are usually not considered. Pharmacokinetics: solvent effects, diffusion, transport are not included.
  • 9.
    QSAR and 3D-QSAR Software Tripos– CoMFA, VolSurf MSI – Catalyst, Serius Docking Software DOCK – Kuntz Flex – Lengauer LigandFit – MSI Catalyst
  • 10.
    3D molecular fields Amolecular field may be represented by 3D grid. Each voxel represents attractive and repulsive forces between an interacting partner and a target molecule. An interacting partner can be water, octanol or other solvents.
  • 11.
    Common 3D molecularfields MEP – Molecular Electrostatic Potential (unit positive charge probe). MLP – Molecular Lipophilicity Potential (no probe necessary). GRID – total energy of interaction: the sum of steric (Lennard-Jones), H-bonding and electrostatics (any probe can be used). CoMFA – standard: steric and electrostatic, additional: H-bonding, indicator, parabolic and others.
  • 12.
    Comparative Molecular Field Analysis(CoMFA) - 1988 Compute molecular fields grid Extract 3D descriptors Compute coefficients of QSAR equation
  • 13.
    CoMFA molecular fields Agrid wit energy fields is calculated by placing a probe atom at each voxel. The molecular fields are: Steric (Lennard-Jones) interactions Electrostatic (Coulombic) interactions A probe is sp3 carbon atom with charge of +1.0
  • 15.
    CoMFA 3D-QSAR Each gridvoxel corresponds to two variables in QSAR equation: steric and electrostatic. The PLS technique is applied to compute the coefficients. Problems: Superposition: the molecules must be optimally aligned. Flexibility of the molecules.
  • 16.
    3D-QSAR of CYP450cam withCoMFA • Training dataset from 15 complexes of CYP450 with different compounds was used. • The alignment of the compounds was done by aligning of the CYP450 proteins from the complexes.
  • 17.
    3D-QSAR of CYP450cam withCoMFA Maps of electrostatic fields: BLUE - positive charges RED - negative charges Maps of steric fields: GREEN - space filling areas for best Kd YELLOW - space conflicting areas
  • 18.
    VOLSURF The VolSurf programpredicts a variety of ADME properties based on pre-calculated models. The models included are: • drug solubility • Caco-2 cell absorption • blood-brain barrier permeation • distribution
  • 19.
    VOLSURF VolSurf reads orcomputes molecular fields, translates them to simple molecular descriptors by image processing techniques. These descriptors quantitatively characterize size, shape, polarity, and hydrophobicity of molecules, and the balance between them.
  • 20.
    VOLSURF Descriptors Size andshape: volume V, surface area S, ratio volume surface V/S, globularity S/Sequiv (Sequiv is the surface area of a sphere of volume V). Hydrophilic: hydrophilic surface area HS, capacity factor HS/S. Hydrophobic: like hydrophilic LS, LS/S. Interaction energy moments: vectors pointing from the center of the mass to the center of hydrophobic/hydrophilic regions. Mixed: local interaction energy minima, energy minima distances, hydrophilic-lipophilic balance HS/LS, amphiphilic moments, packing parameters, H-bonding, polarisability.
  • 21.
    VOLSURF hydrophobic (blue) andhydrophilic (red) surface area of diazepam.
  • 22.
    Catalyst Catalyst develops 3Dmodels (pharmacophores) from a collection of molecules possessing a range of diversity in both structures and activities. Catalyst specifies hypotheses in terms of chemical features that are likely to be important for binding to the active site. Each feature consists of four parts: Chemical function Location and orientation in 3D space Tolerance in location Weight
  • 23.
    Catalyst Features • HBAcceptor and Acceptor-Lipid • HB Donor • Hydrophobic • Hydrophobic aliphatic • Hydrophobic aromatic • Positive charge/Pos. Ionizable • Negative charge/Neg. Ionizable • Ring Aromatic
  • 24.
    Catalyst HipHop Feature-based pharmacophoremodeling: uses ONLY active ligands no activity data required identifies binding features for drug-receptor interactions generates alignment of active leads the flexibility is achieved by using multiple conformers alignment can be used for 3D-QSAR analysis
  • 25.
    Catalyst HipoGen Activity-based pharmacophoremodeling: uses active + inactive ligands activity data required (concentration) identifies features common to actives missed by inactives used to “predict” or estimate activity of new ligands
  • 26.
    Catalyst CYP3A4 substrates pharmacophore Hydrophobicarea, h-bond donor, 2 h-bond acceptors Saquinavir (most active compound) fitted to pharmacophore
  • 27.
    Catalyst CYP2B6 substrates pharmacophore 3hydrophobicareas, h-bond acceptor 7-ethoxy-4-trifluoromethylcoumarin fitted to pharmacophore
  • 28.
    Catalyst Docking –Ligand Fit Active site finding Conformation search of ligand against site Rapid shape filter determines which conformations should be scored Grid-based scoring for those conformations passing the filter
  • 29.
    Catalyst Docking –Ligand Flexibility Monte Carlo search in torsional space Multiple torsion changes simultaneously The random window size depends on the number of rotating atoms
  • 30.
    Catalyst Docking –Scoring pKi = – c – x (vdW_Exact/ Grid_Soft) + y (C+_pol) – z (Totpol^ 2) • vdW = softened Lennard-Jones 6-9 potential • C+_pol = buried polar surface area involved in attractive ligand-protein interactions • Totpol^ 2 = buried polar surface area involved in both attractive and repulsive protein-ligand interactions
  • 31.
    3D-QSAR of CYP450cam withDOCK Goal: • Test the ability of DOCK to discriminate between substrates and non-substrates. Assumption: • Non-substrate candidate is a compound that doesn’t fit to the active site of CYP, but fits to the site of it’s L244A mutant.
  • 32.
    Methods Docking of 20,000compounds to ‘bound’ structure of CYP and L244A mutant. 11 substrate candidates were selected from 500 high scoring compounds for CYP. 6 non-substrate candidates were selected from a difference list of L244A and CYP. Optimization of compounds 3D structures by SYBYL molecular mechanics program and re-docking. As a result 2 compounds move from “non-substrate” list to “substrate” list and one in the opposite direction.
  • 33.
    Prediction Results All compoundspredicted as “non-substrates” shown no biological activity. 4 of the 11 molecules predicted as “substrates” were found as non-substrates. The predictions of DOCK are sensitive to the parameter of minimum distance allowed between an atom of the ligand and the receptor (penetration constrains).
  • 34.
  • 35.
    References Cruciani et al.,Molecular fields in quantitative structure-permeation relationships: the VolSurf approach, J. Mol. Struct. (Theochem), 2000, 503:17-30 Cramer et al.,Comparative Molecular Field Analysis (CoMFA). 1. Effect of shape on Binding of steroids to Carrier proteins, J. Am. Chem. Soc. 1988, 110:5959-5967 Ekins et al., Progress in predicting human ADME parameters in silico, J. Pharmacological and Toxicological Methods 2000, 44:251-272 De Voss et al., Substrate Docking Algorithms and Prediction of the Substrate Specifity of Cytochrome P450cam and its L244A Mutant, J. Am. Chem. Soc. 1997, 119:5489-5498 Ekins et al., Three-Dimensional Quantative Structure Activity Relationship Analyses of Substrates for CYP2B6, J. Pharmacology and Experimental Therapeutics, 1999, 288:21-29