Downloaded 1,104 times


![QSAR date back to the 19th century
A.F.A. Cros (University of Strasbourg; 1863)
Increased toxicity of alcohols with decrease in water solubility
H. H. Meyer (University of Marburg; 1890’s) and Charles Ernest
Overton (University of Zurich; 1890’s) [working independently]
Toxicity of organic compounds depended on their lipophilicity
Crum-Brown and Fraser
the physiological action of a substance was a function of its chemical
composition and constitution
Richet
inverse relationship between the cytotoxicities of a diverse set of simple
organic molecules with water solubilities](https://image.slidesharecdn.com/qsar1-151001023622-lva1-app6891/75/QSAR-6-2048.jpg)


![› Log 1/C = S ai + m
where C=predicted activity,
ai= contribution per group, and
m=activity of reference
Free-Wilson Analysis
Log 1/C = -0.30 [m-F] + 0.21 [m-Cl] + 0.43 [m-Br]
+ 0.58 [m-I] + 0.45 [m-Me] + 0.34 [p-F] + 0.77 [p-Cl]
+ 1.02 [p-Br] + 1.43 [p-I] + 1.26 [p-Me] + 7.82
N
Br
X
Y HCl](https://image.slidesharecdn.com/qsar1-151001023622-lva1-app6891/75/QSAR-20-2048.jpg)


![b0
b1
y=b0+b1x+e
x
y
Least squares (LS) used
for estimation of regression coefficients
Simple linear regression
])(][)([
))((
22
yyxx
yyxx
b
Error](https://image.slidesharecdn.com/qsar1-151001023622-lva1-app6891/75/QSAR-27-2048.jpg)


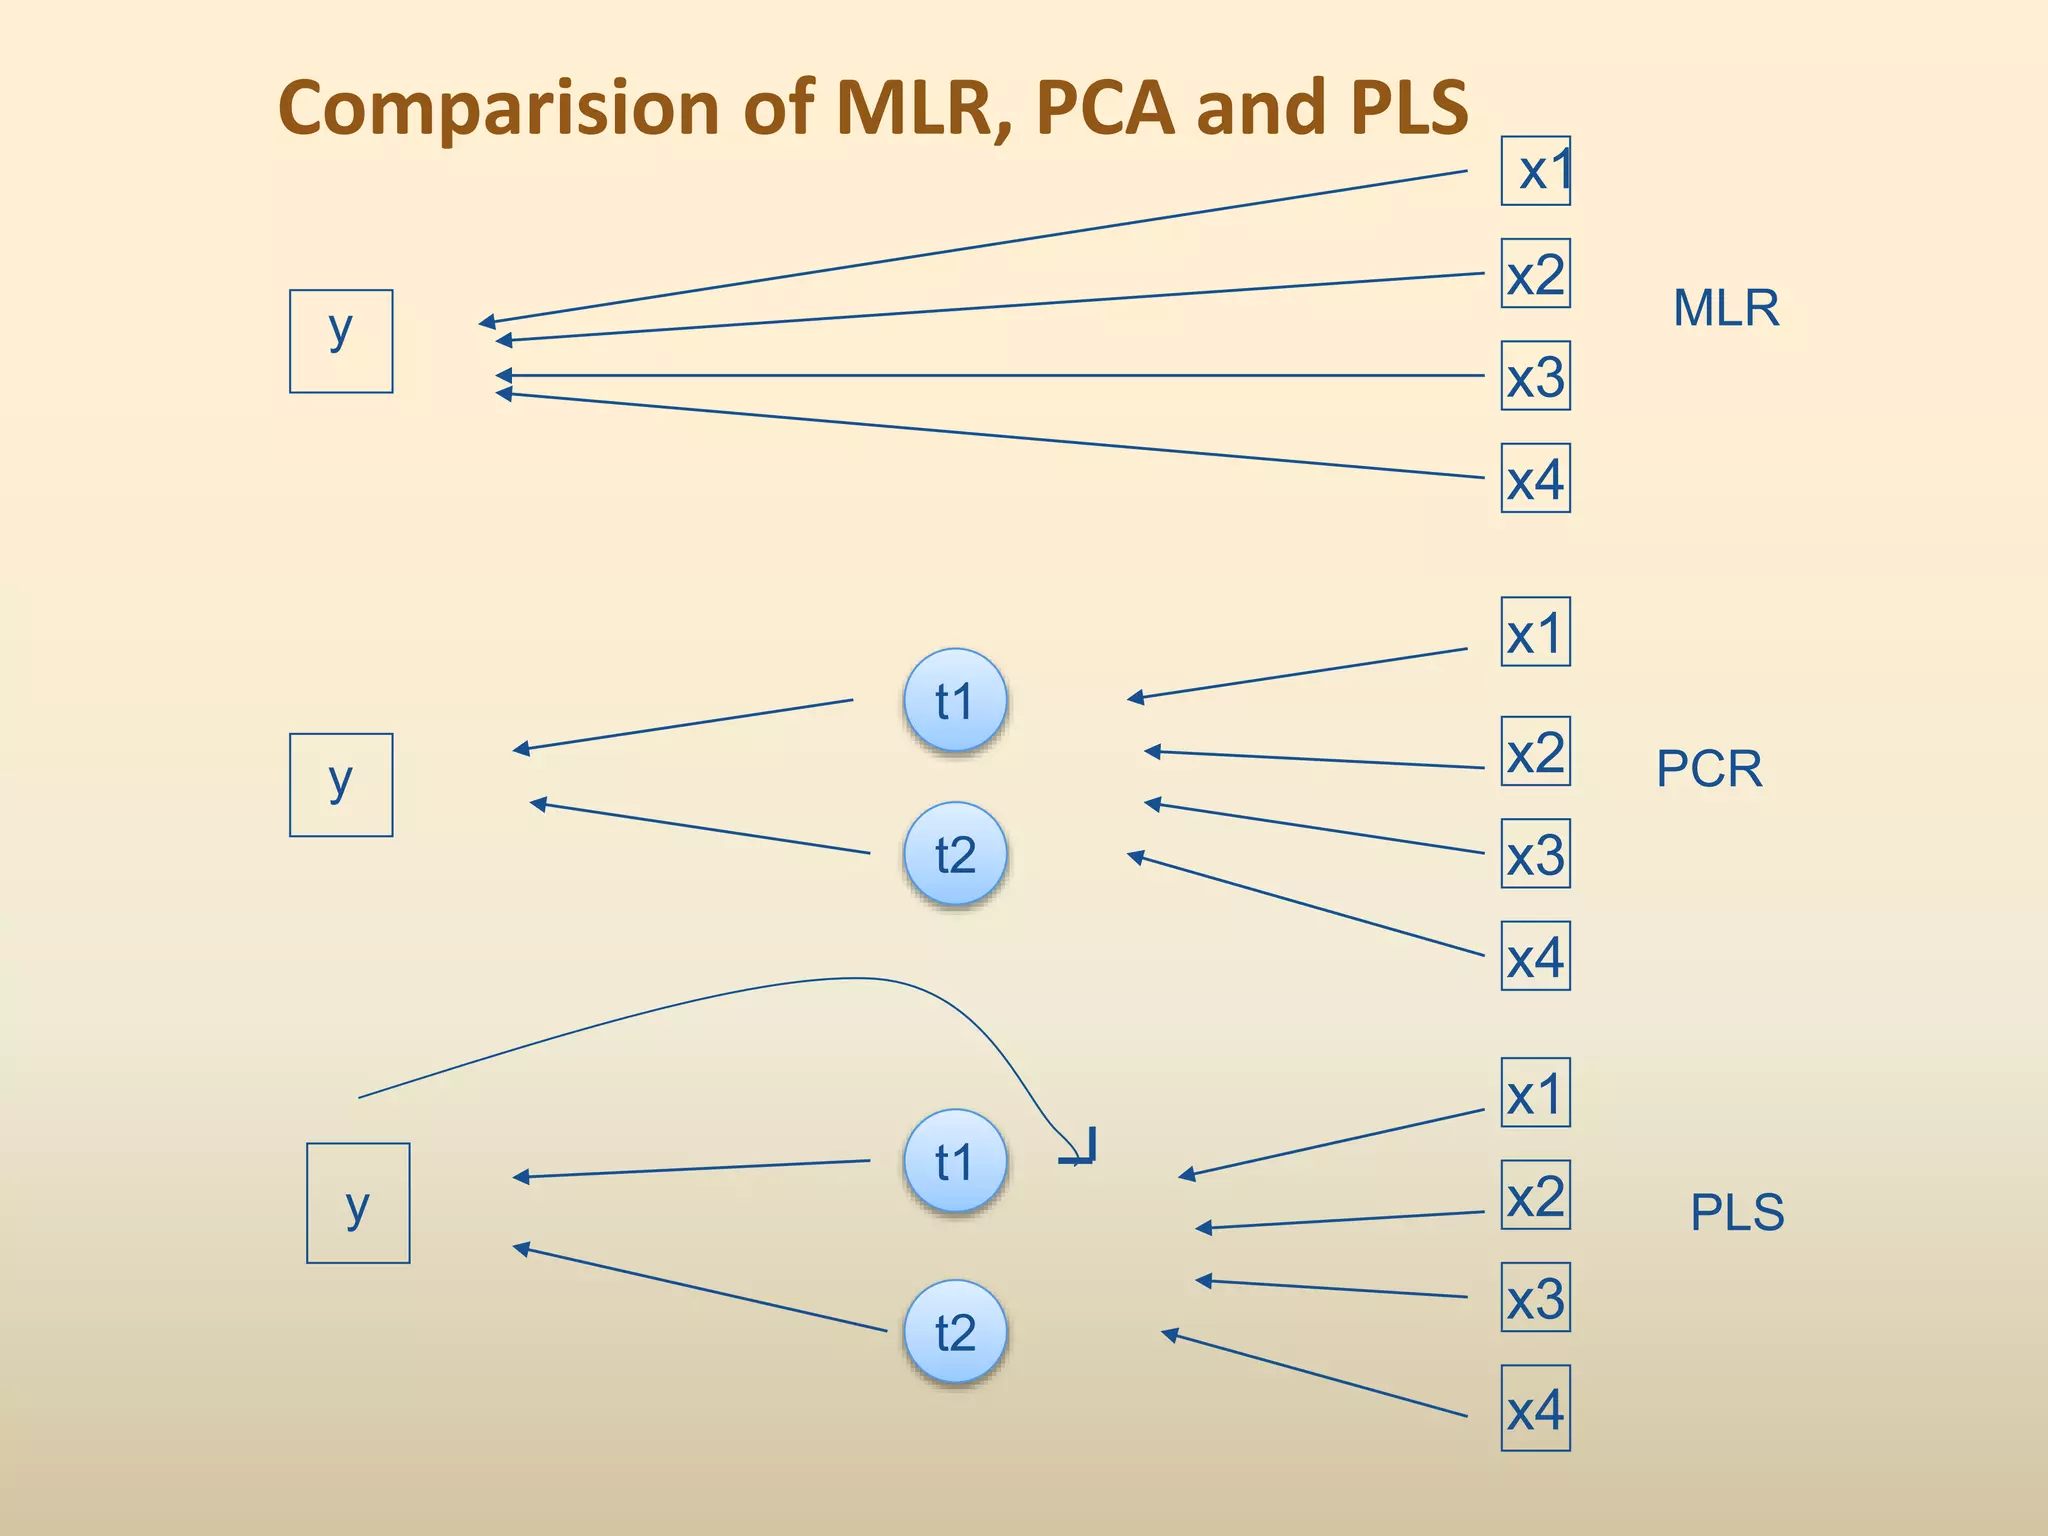


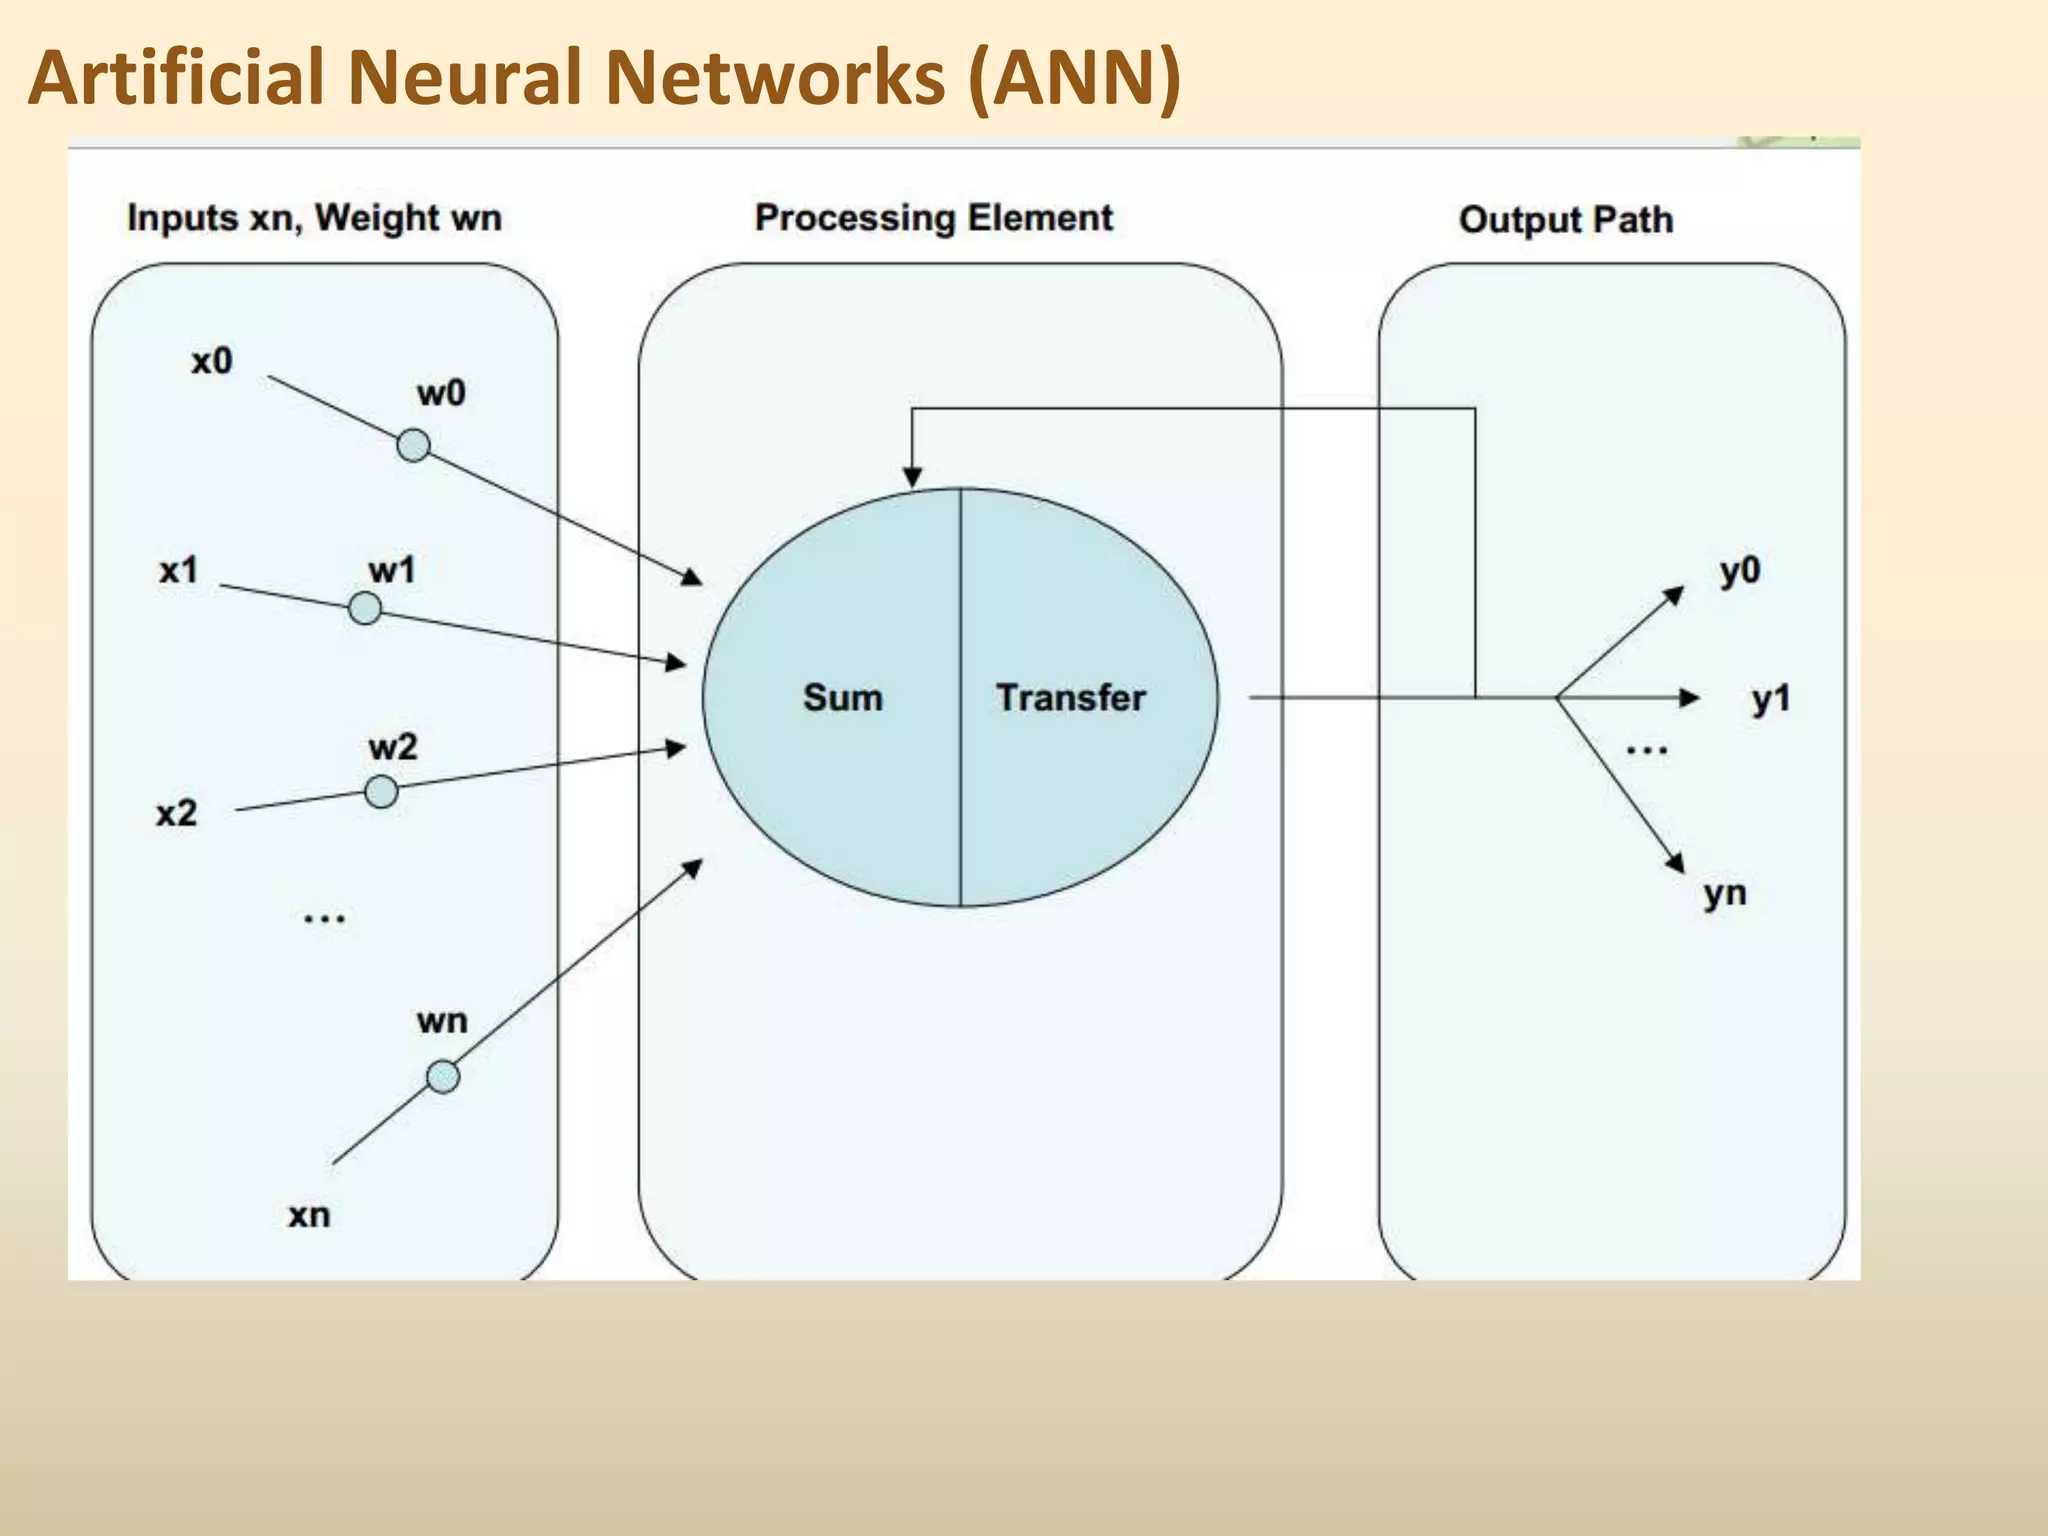

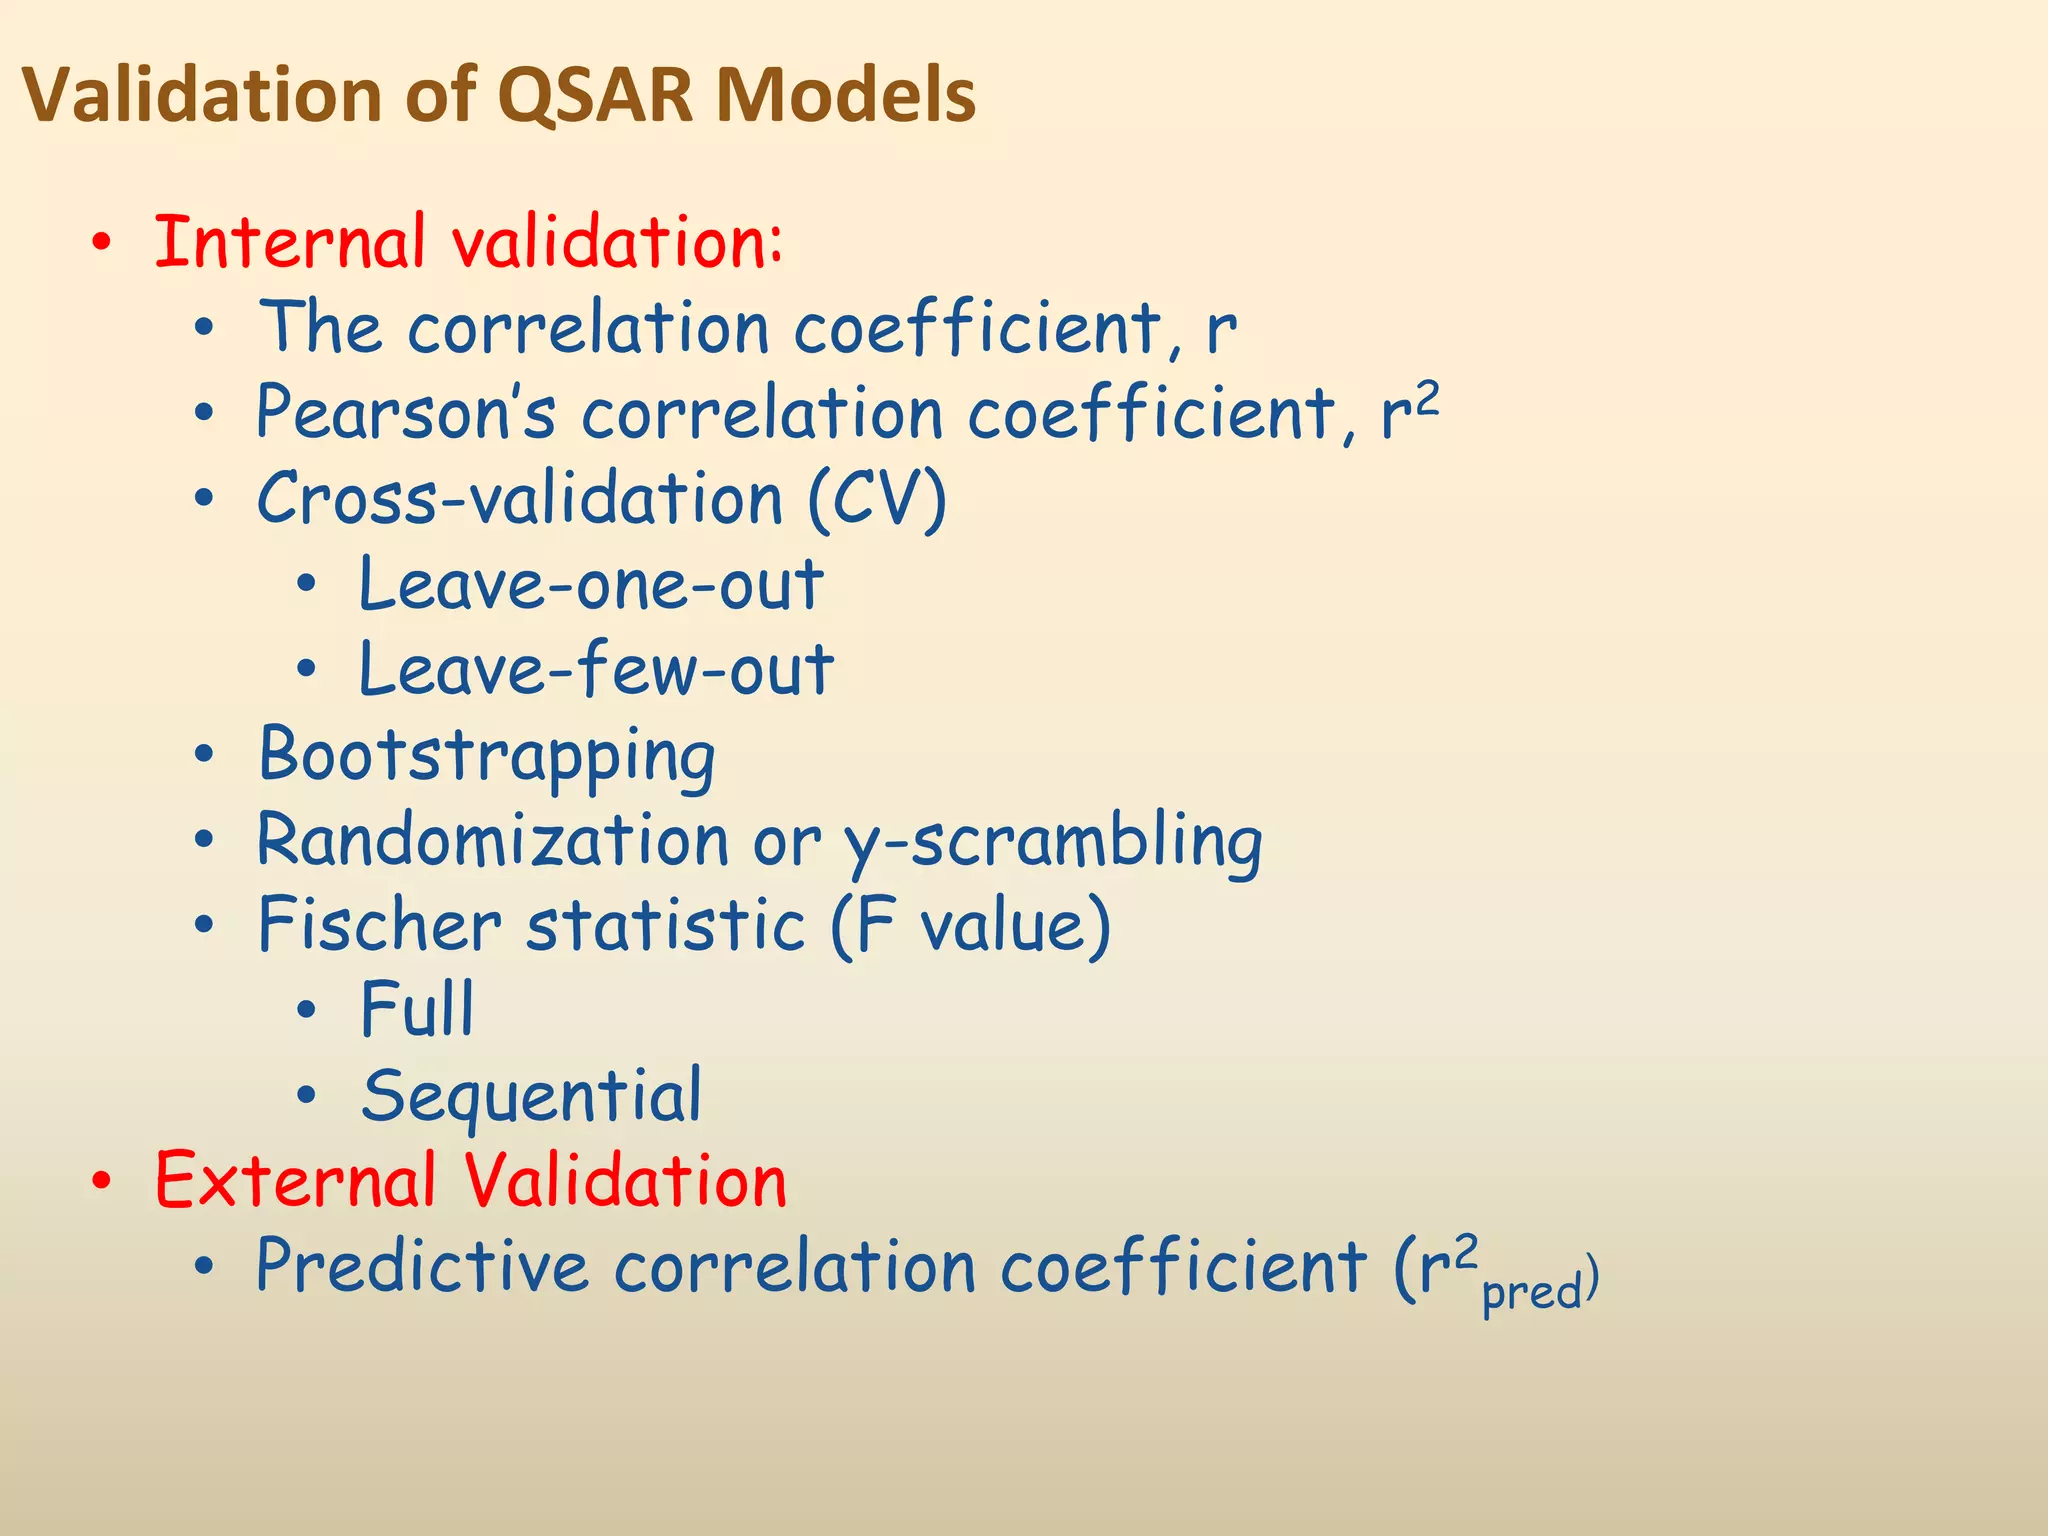


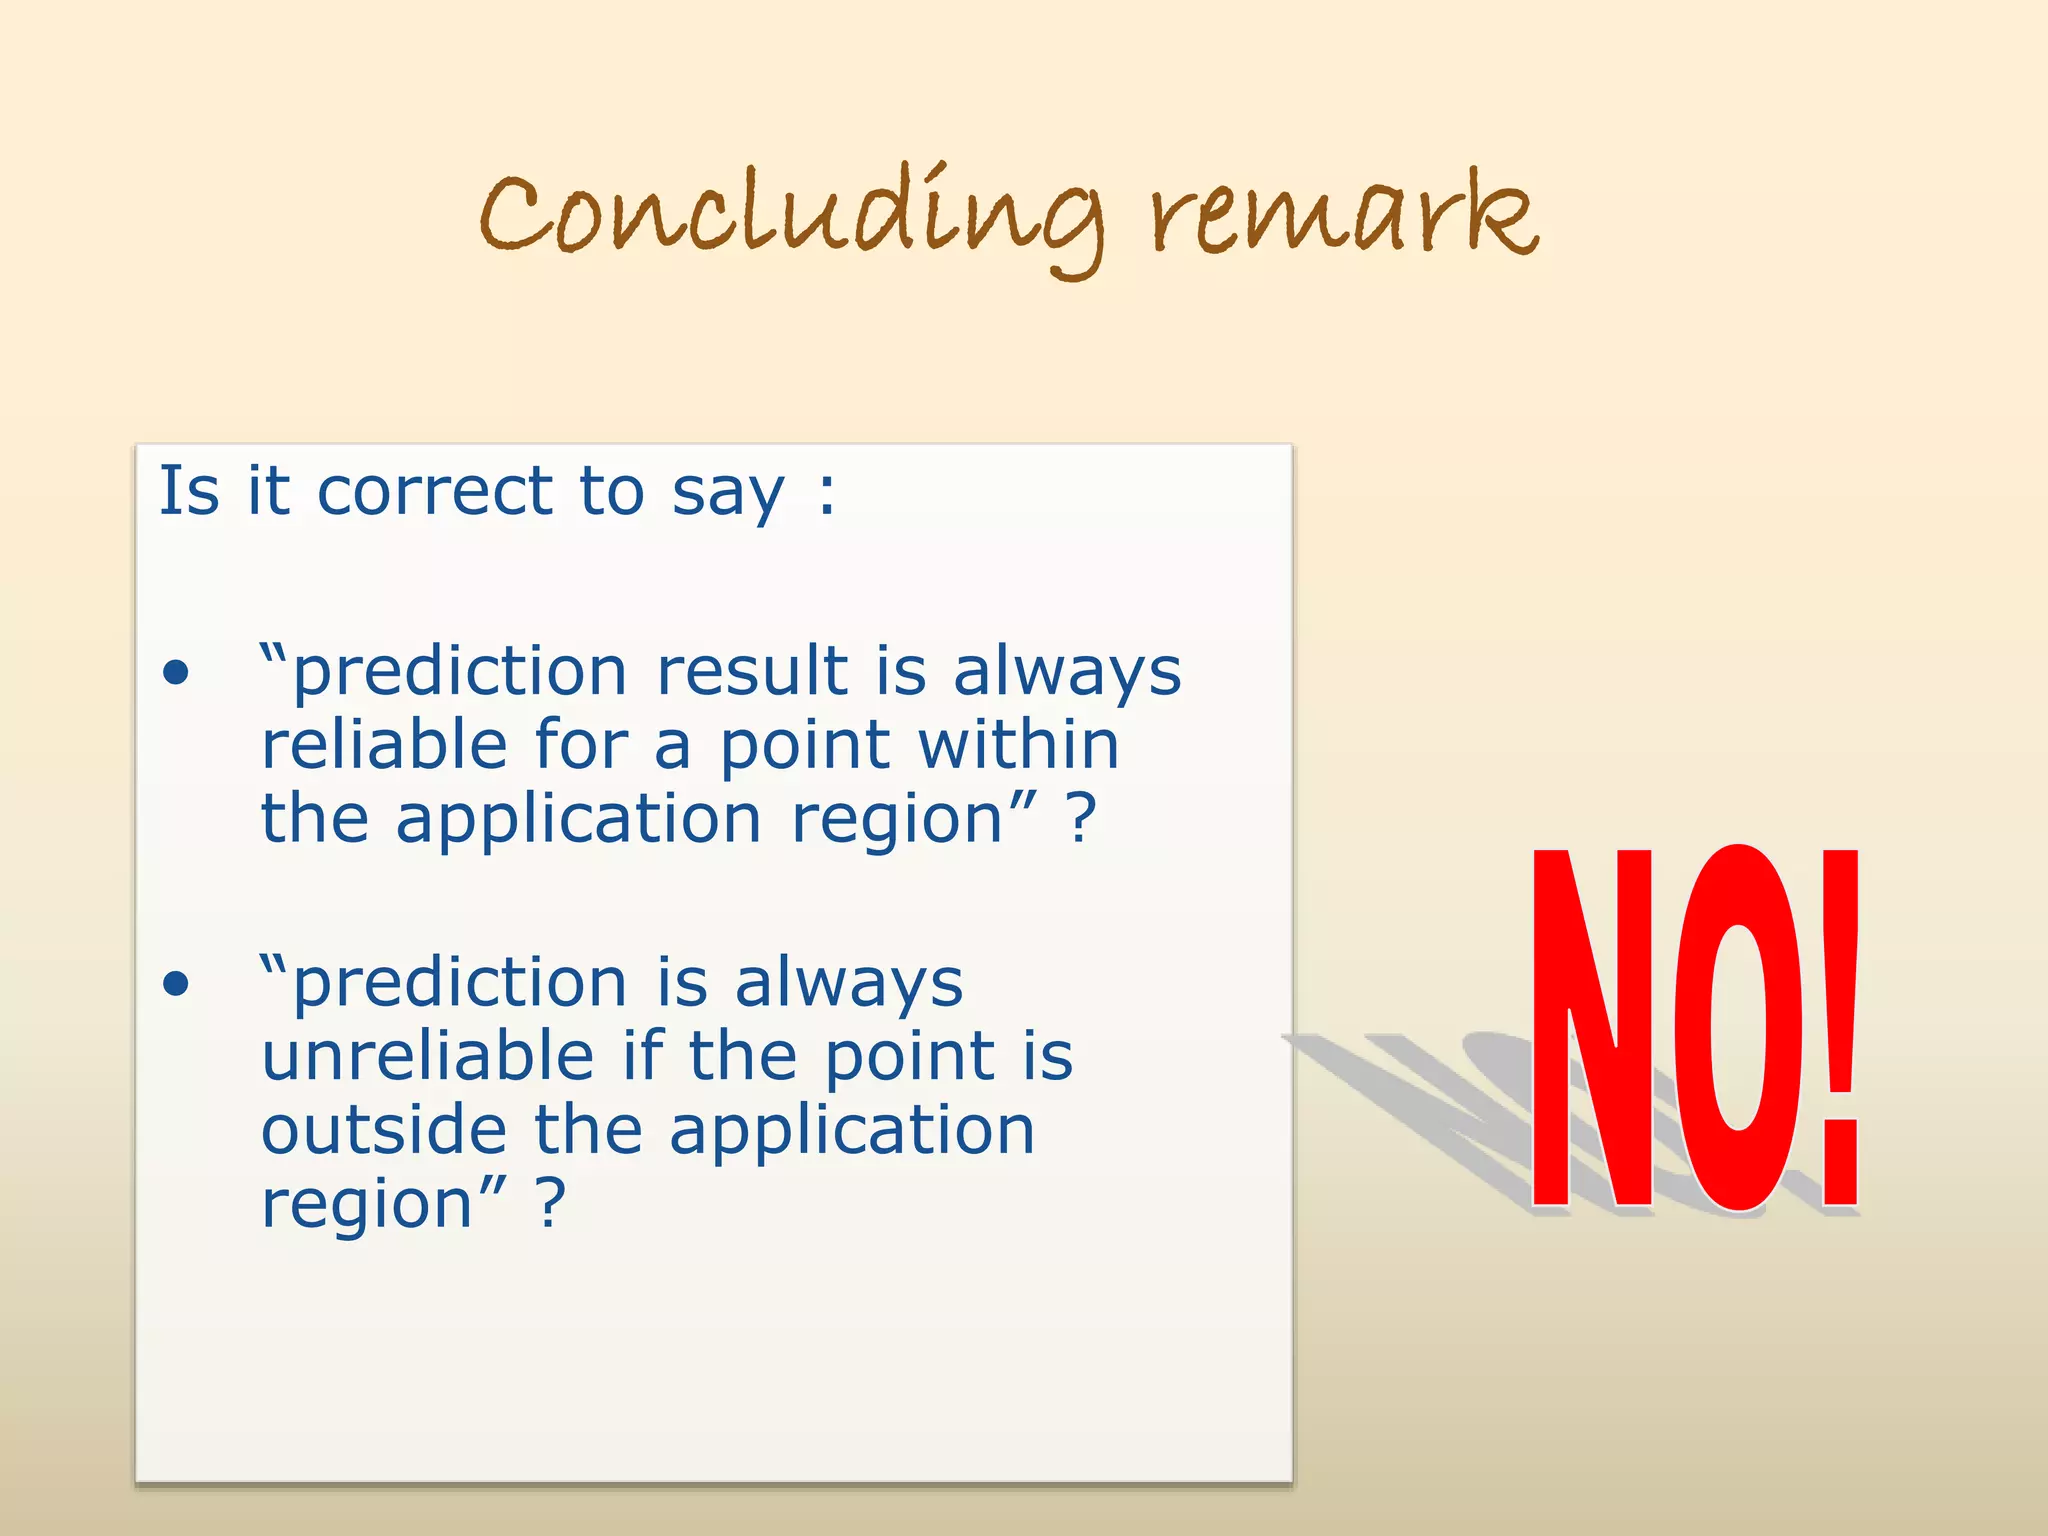


This document provides an overview of quantitative structure-activity relationship (QSAR) modeling techniques. It discusses: 1) The history and background of QSAR, dating back to the 19th century, and key contributors like Hammett who developed linear free energy relationships. 2) Common QSAR methodologies like multiple linear regression, principal component analysis, partial least squares, artificial neural networks, and genetic algorithm-based approaches. 3) Steps for validating QSAR models, including correlation coefficients, cross-validation, and assessing the applicability domain for making predictions.


![PEPTIDOMIMETICS [M.PHARM, BSC, MSC, B.PHARM]](https://cdn.slidesharecdn.com/ss_thumbnails/53-191219102328-thumbnail.jpg?width=640&height=640&fit=bounds)


