


![ More potent and selective PDE4 inhibitors, a series of 5,6-dihydro-(9H) -
pyrazolo[3,4-c] -1,2,4-triazolo [4,3R]pyridine, were improved and synthesized
based on the structures of 7-oxo-4,5,6,7-tetrahydro-1H-pyrazolo[3,4-c]
pyridine.
In order to study the interaction mechanism of PDE4 with 31 new
compounds, the QSAR model was built by using the CoMFA. 5,6-dihydro-
(9H) -pyrazolo[3,4- c] -1,2,4-triazolo [4,3R]pyridine
Structures of 5, 6-Dihydro-(9H)-pyrazolo[3,4-c]-
1,2,4-triazolo[4,3-a]pyridines.
The superstition of 31structures of
5,6-Dihydro-(9H)-pyrazolo[3,4-c]-1,2,4-
triazolo[4,3-α] pyridines.](https://image.slidesharecdn.com/3dqsar-210522132750/75/3-D-QSAR-Approaches-and-Contour-Map-Analysis-14-2048.jpg)


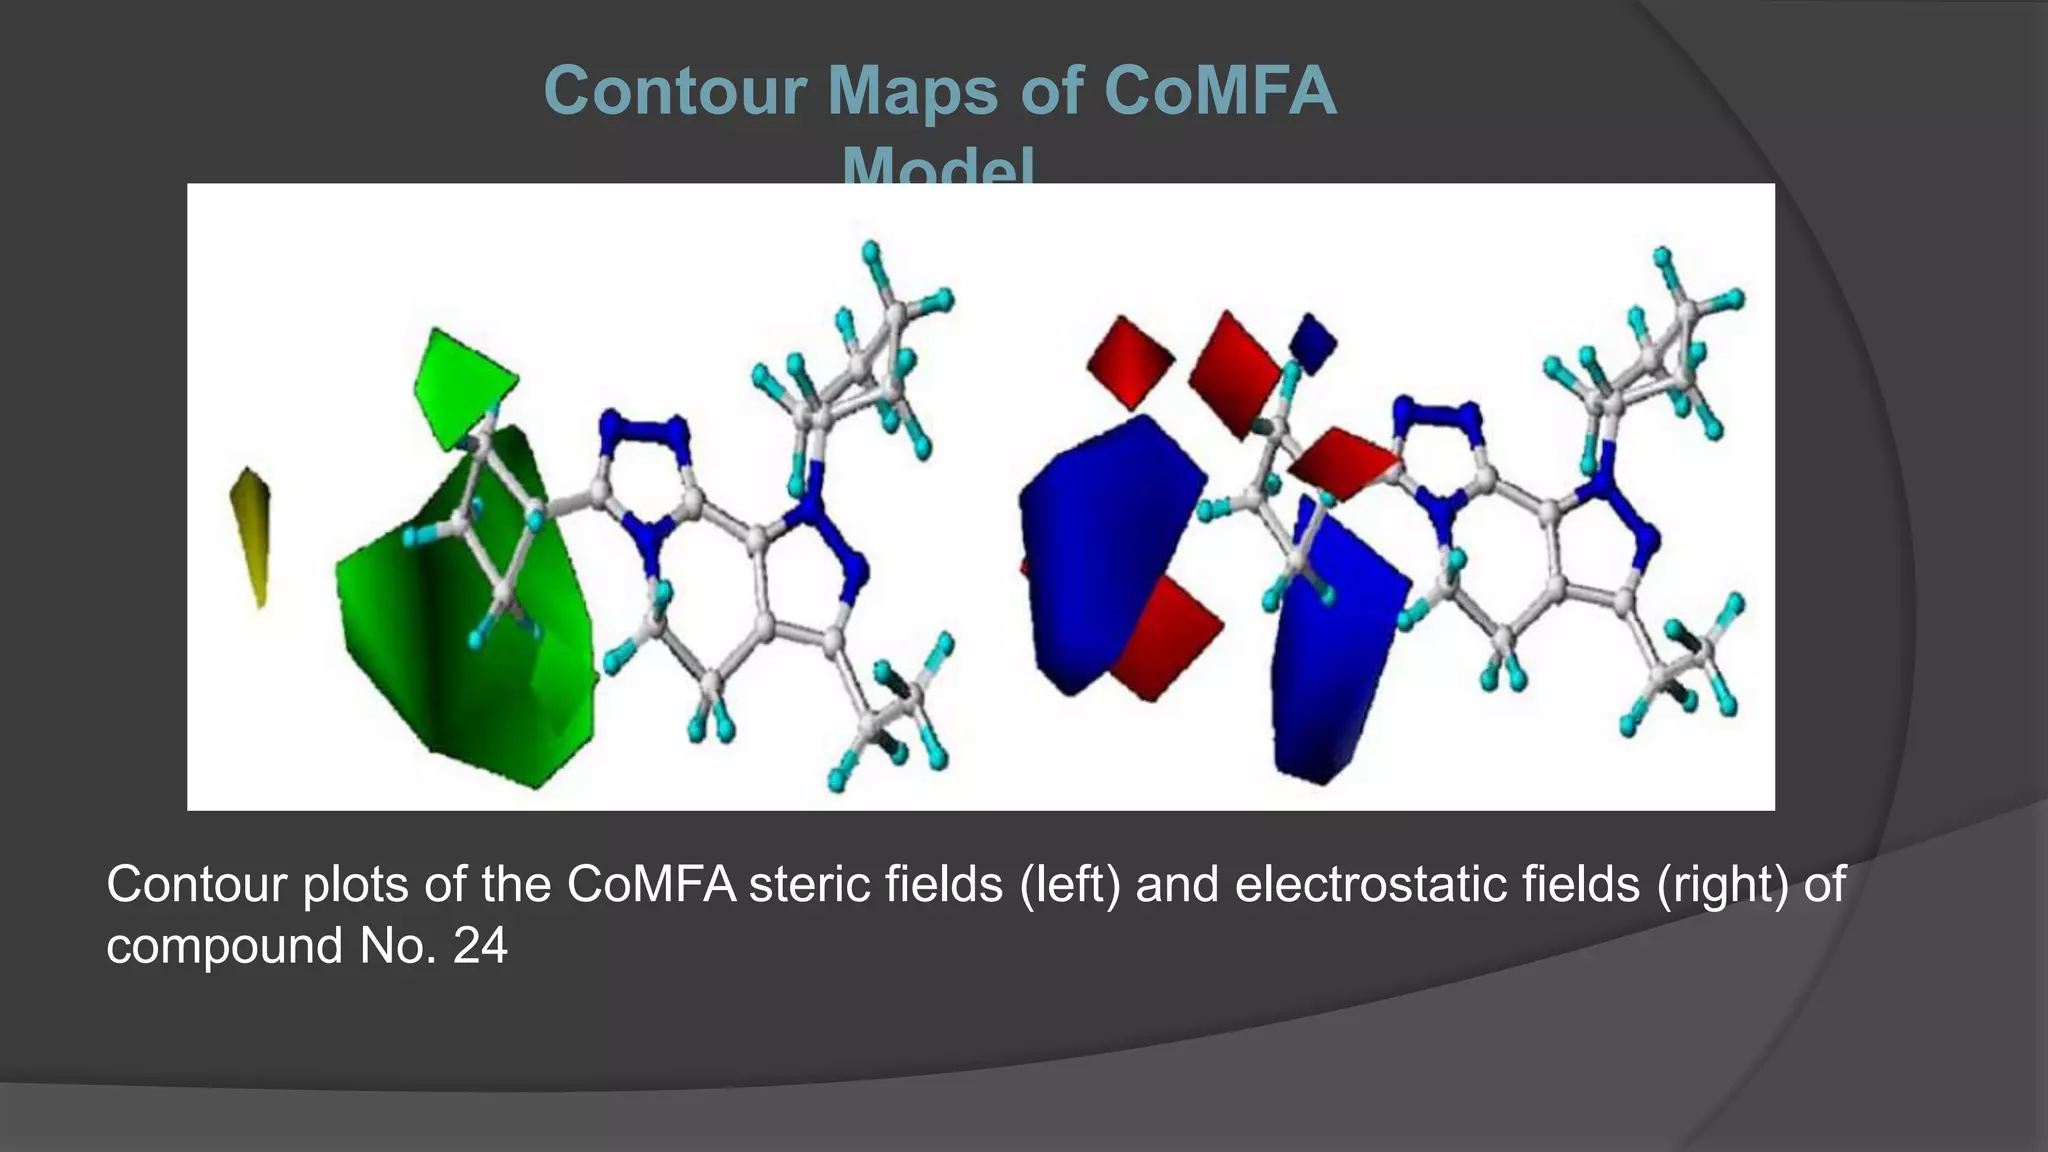


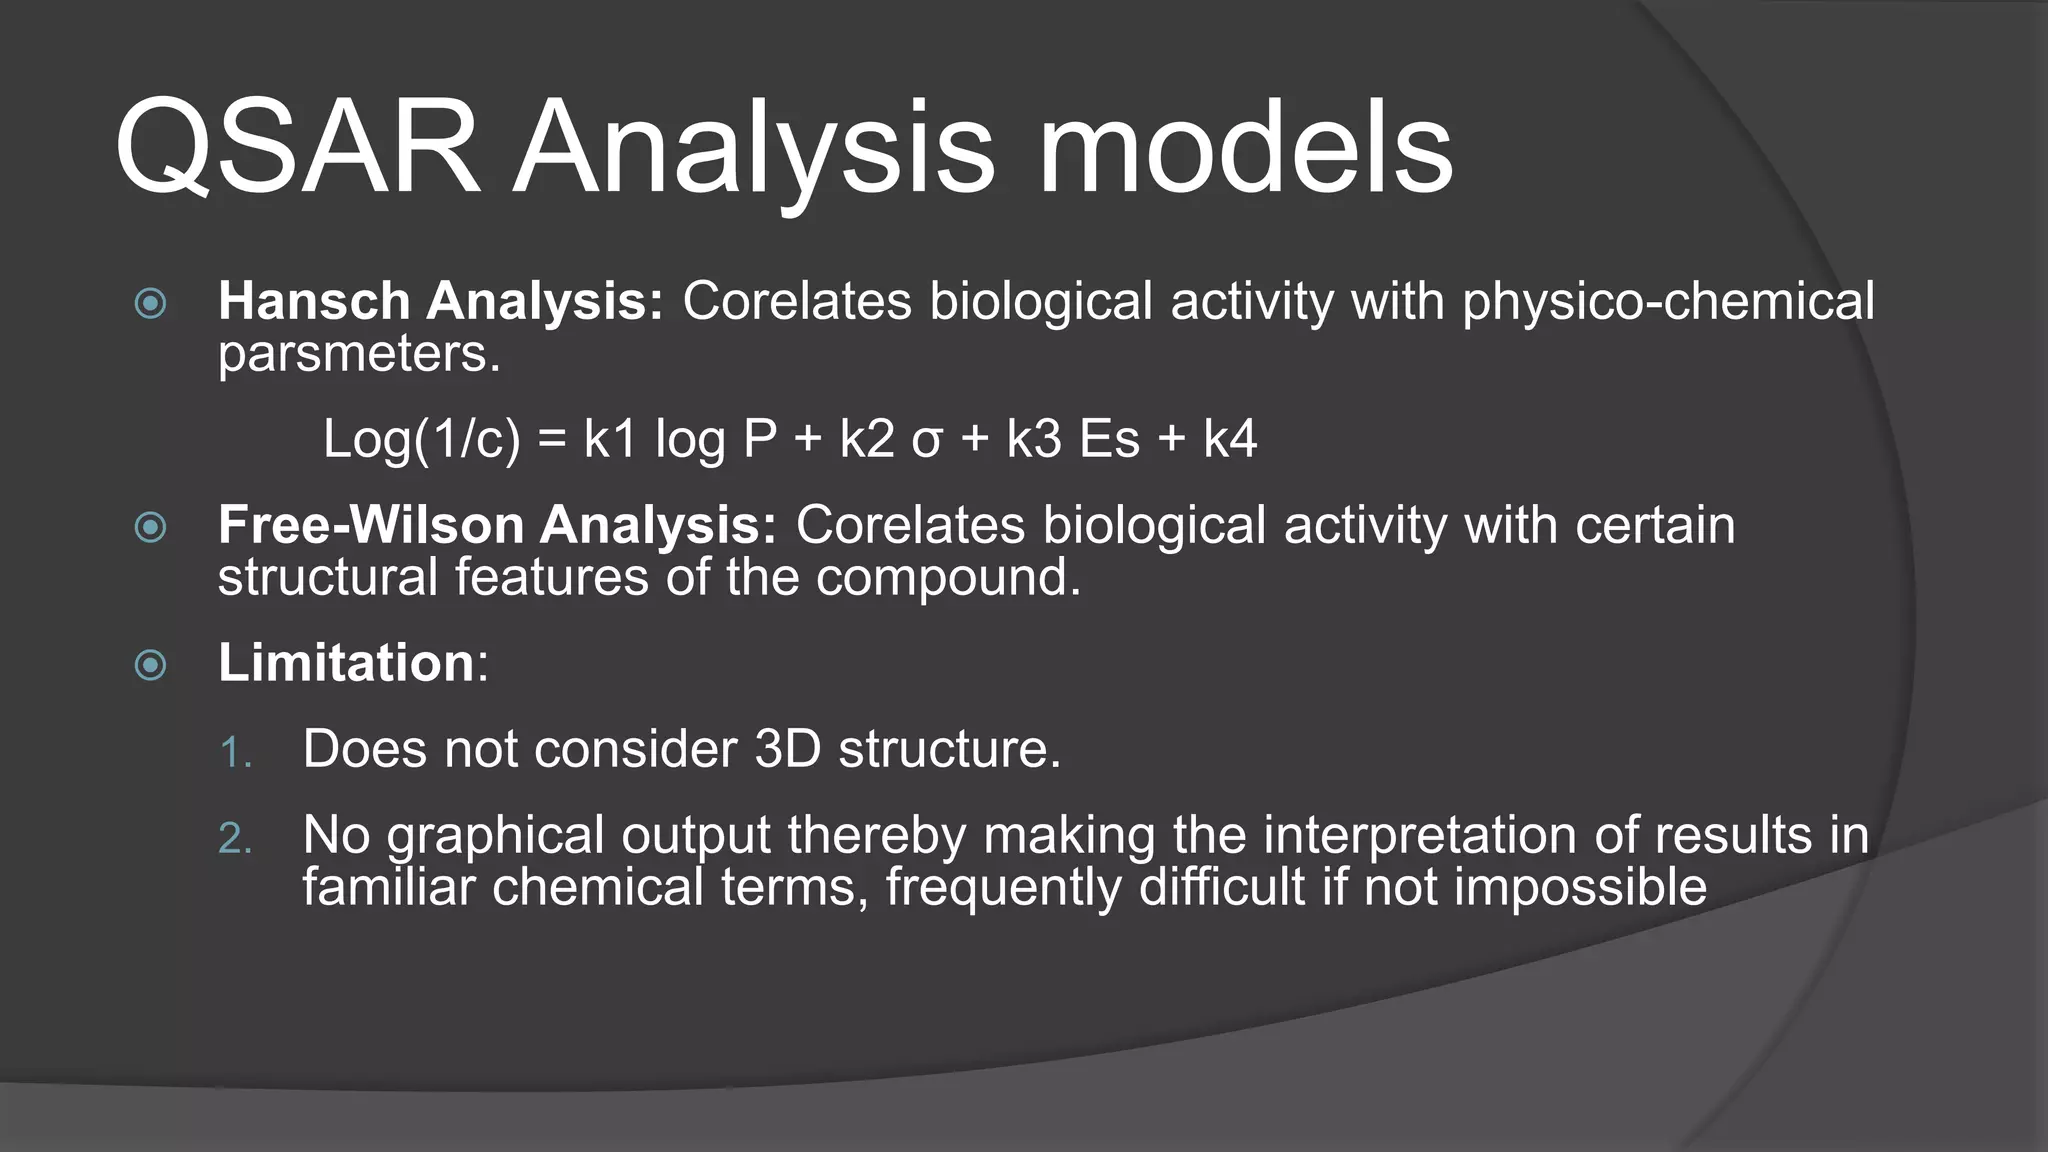
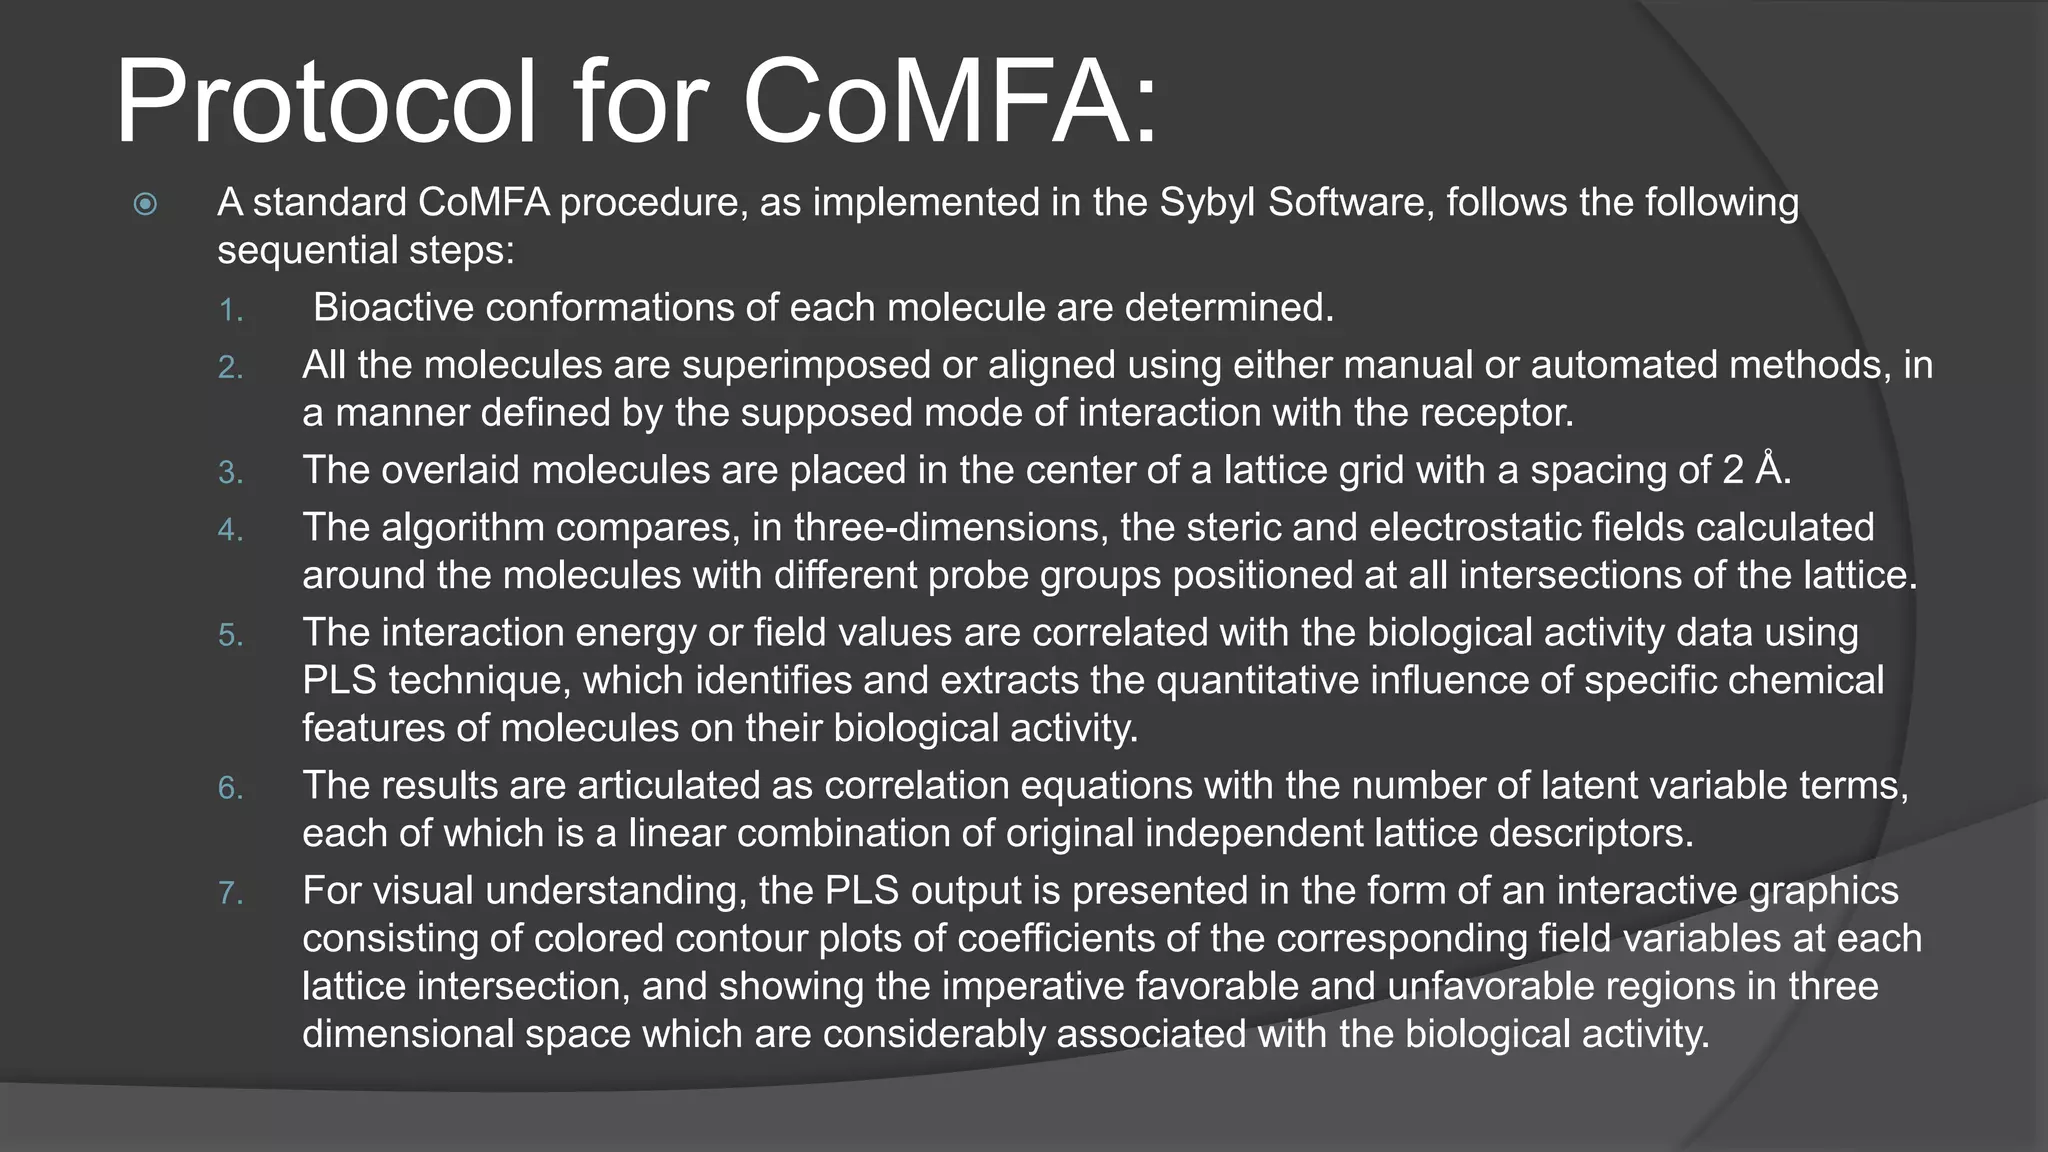
The document discusses Quantitative Structure-Activity Relationship (QSAR) methodologies, highlighting traditional methods like Hansch and Free-Wilson analysis, as well as advanced 3D QSAR techniques such as Comparative Molecular Field Analysis (CoMFA) and Comparative Molecular Similarity Indices Analysis (CoMSIA). It explains the principles behind these models, their applications in drug design, and their limitations, including issues with parameter selection and experimental validation. A case study on phosphodiesterase type IV inhibitors is included, demonstrating the use of QSAR in developing more effective anti-inflammatory drugs.