Downloaded 293 times


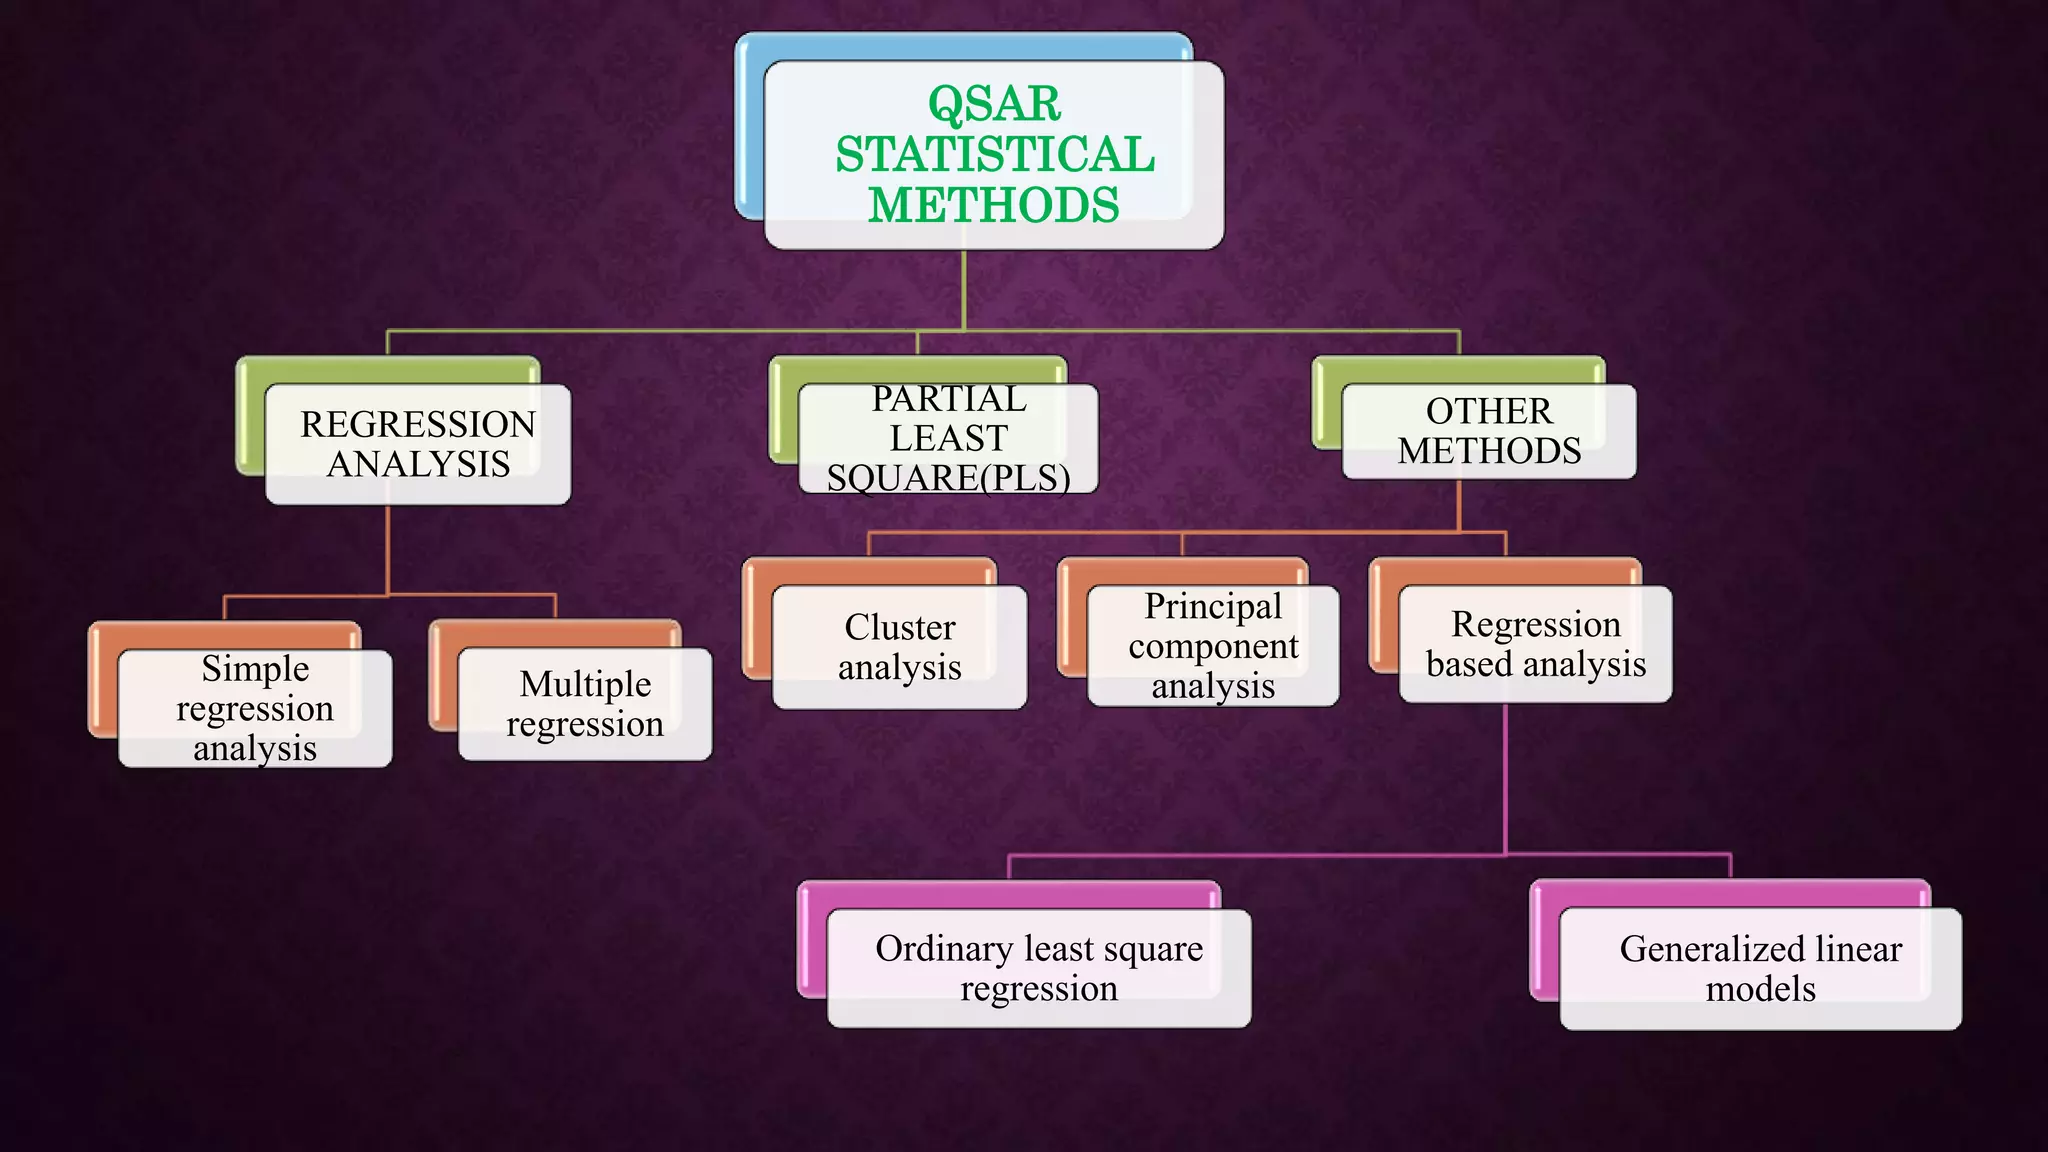

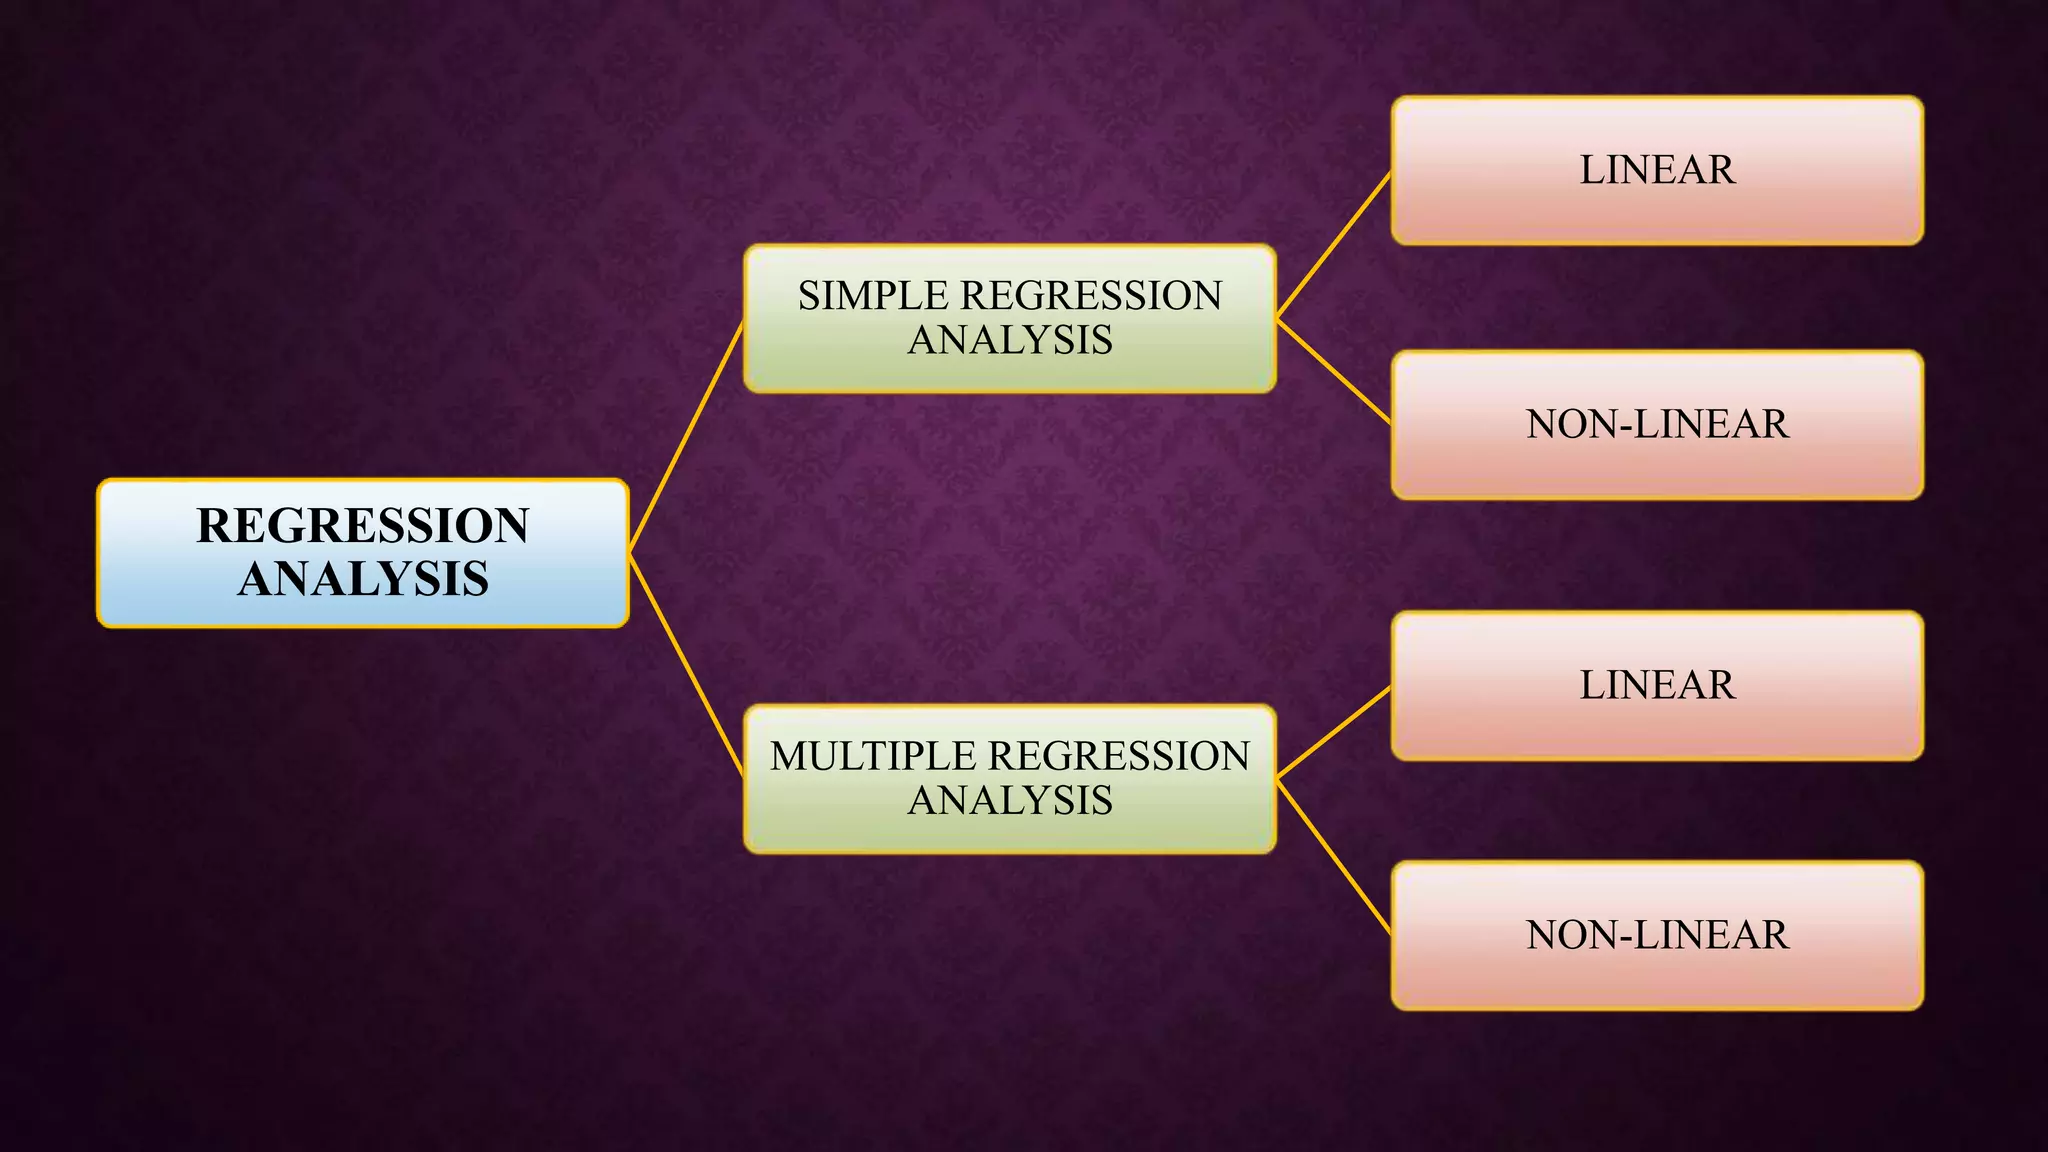
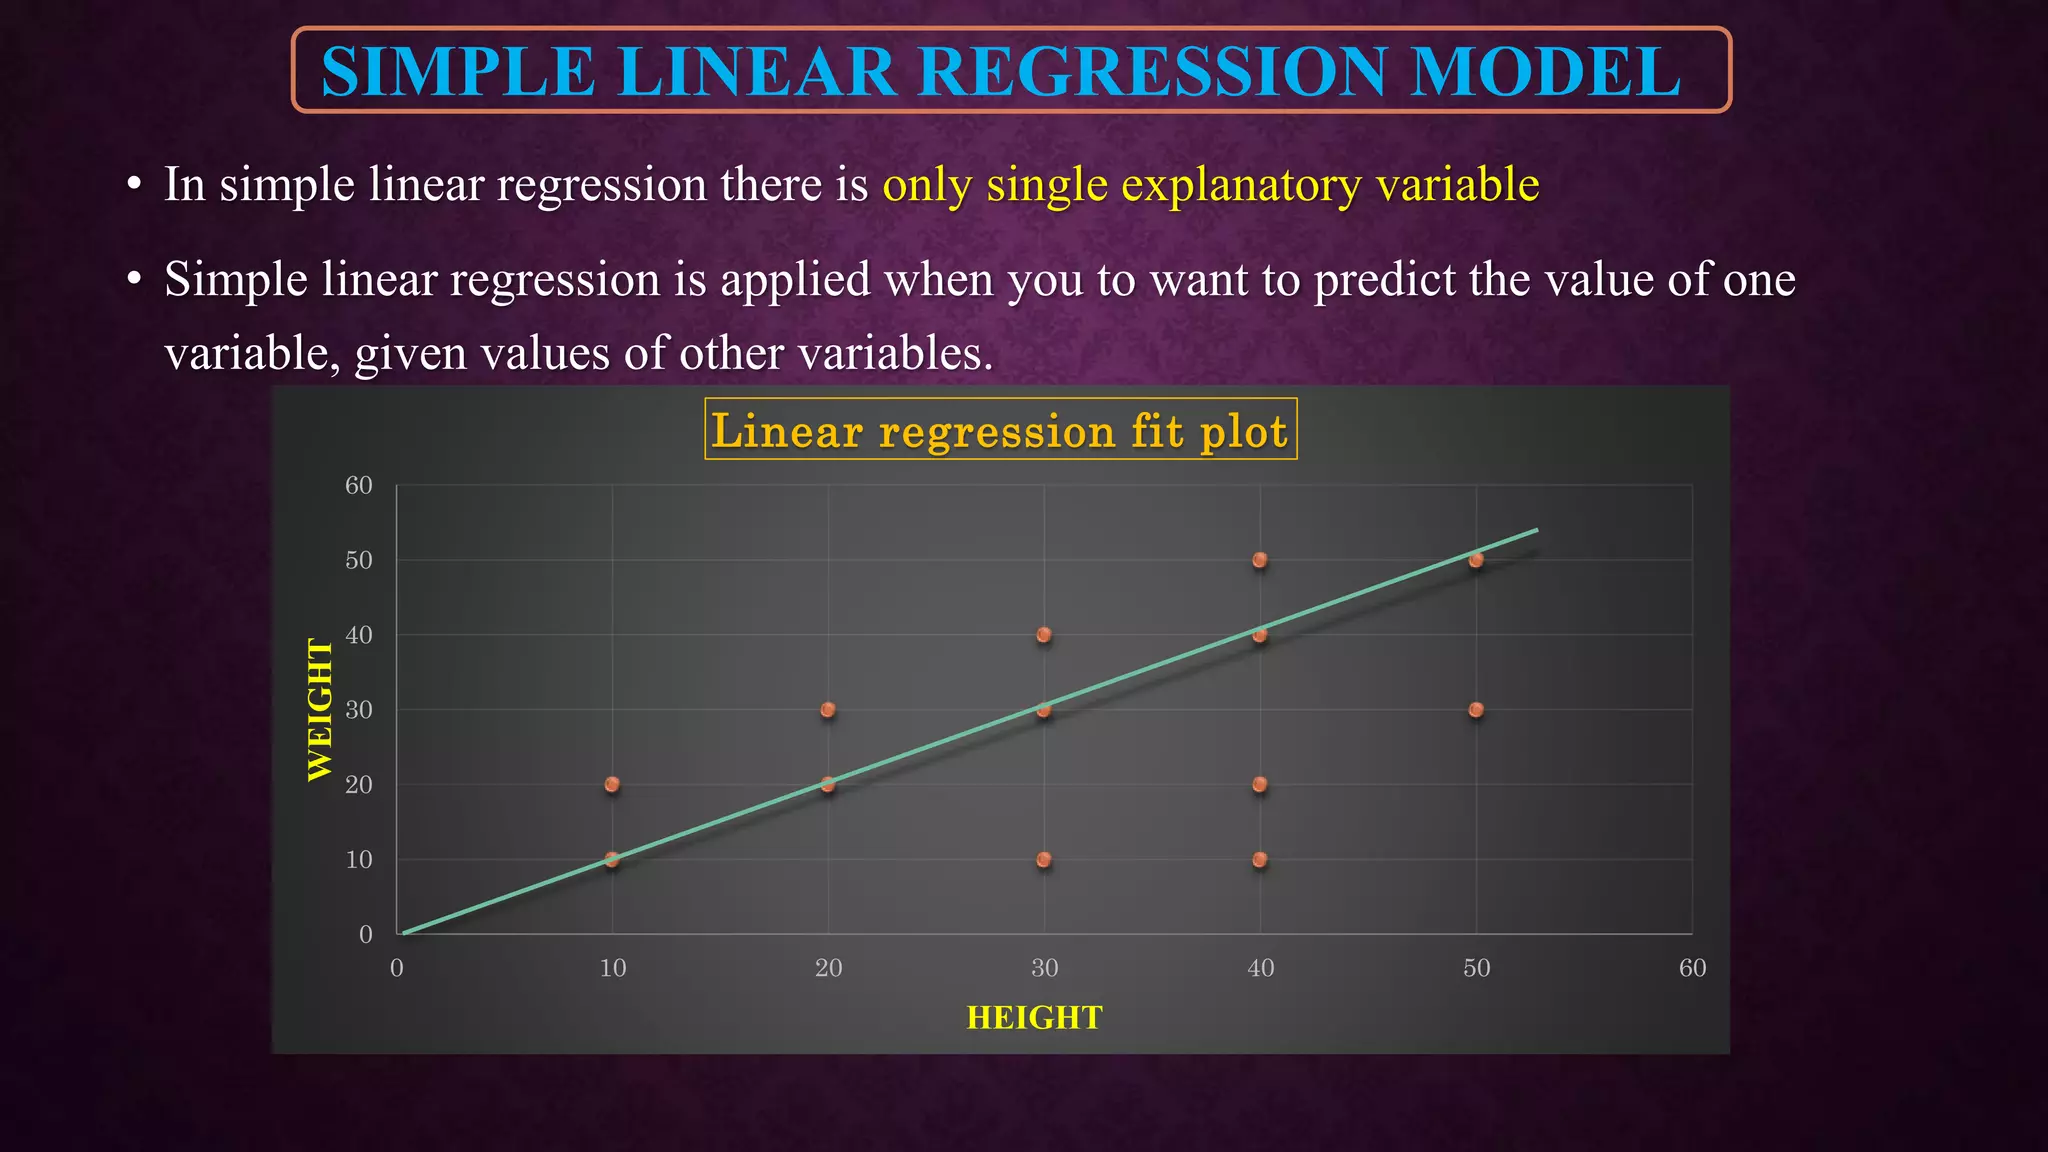
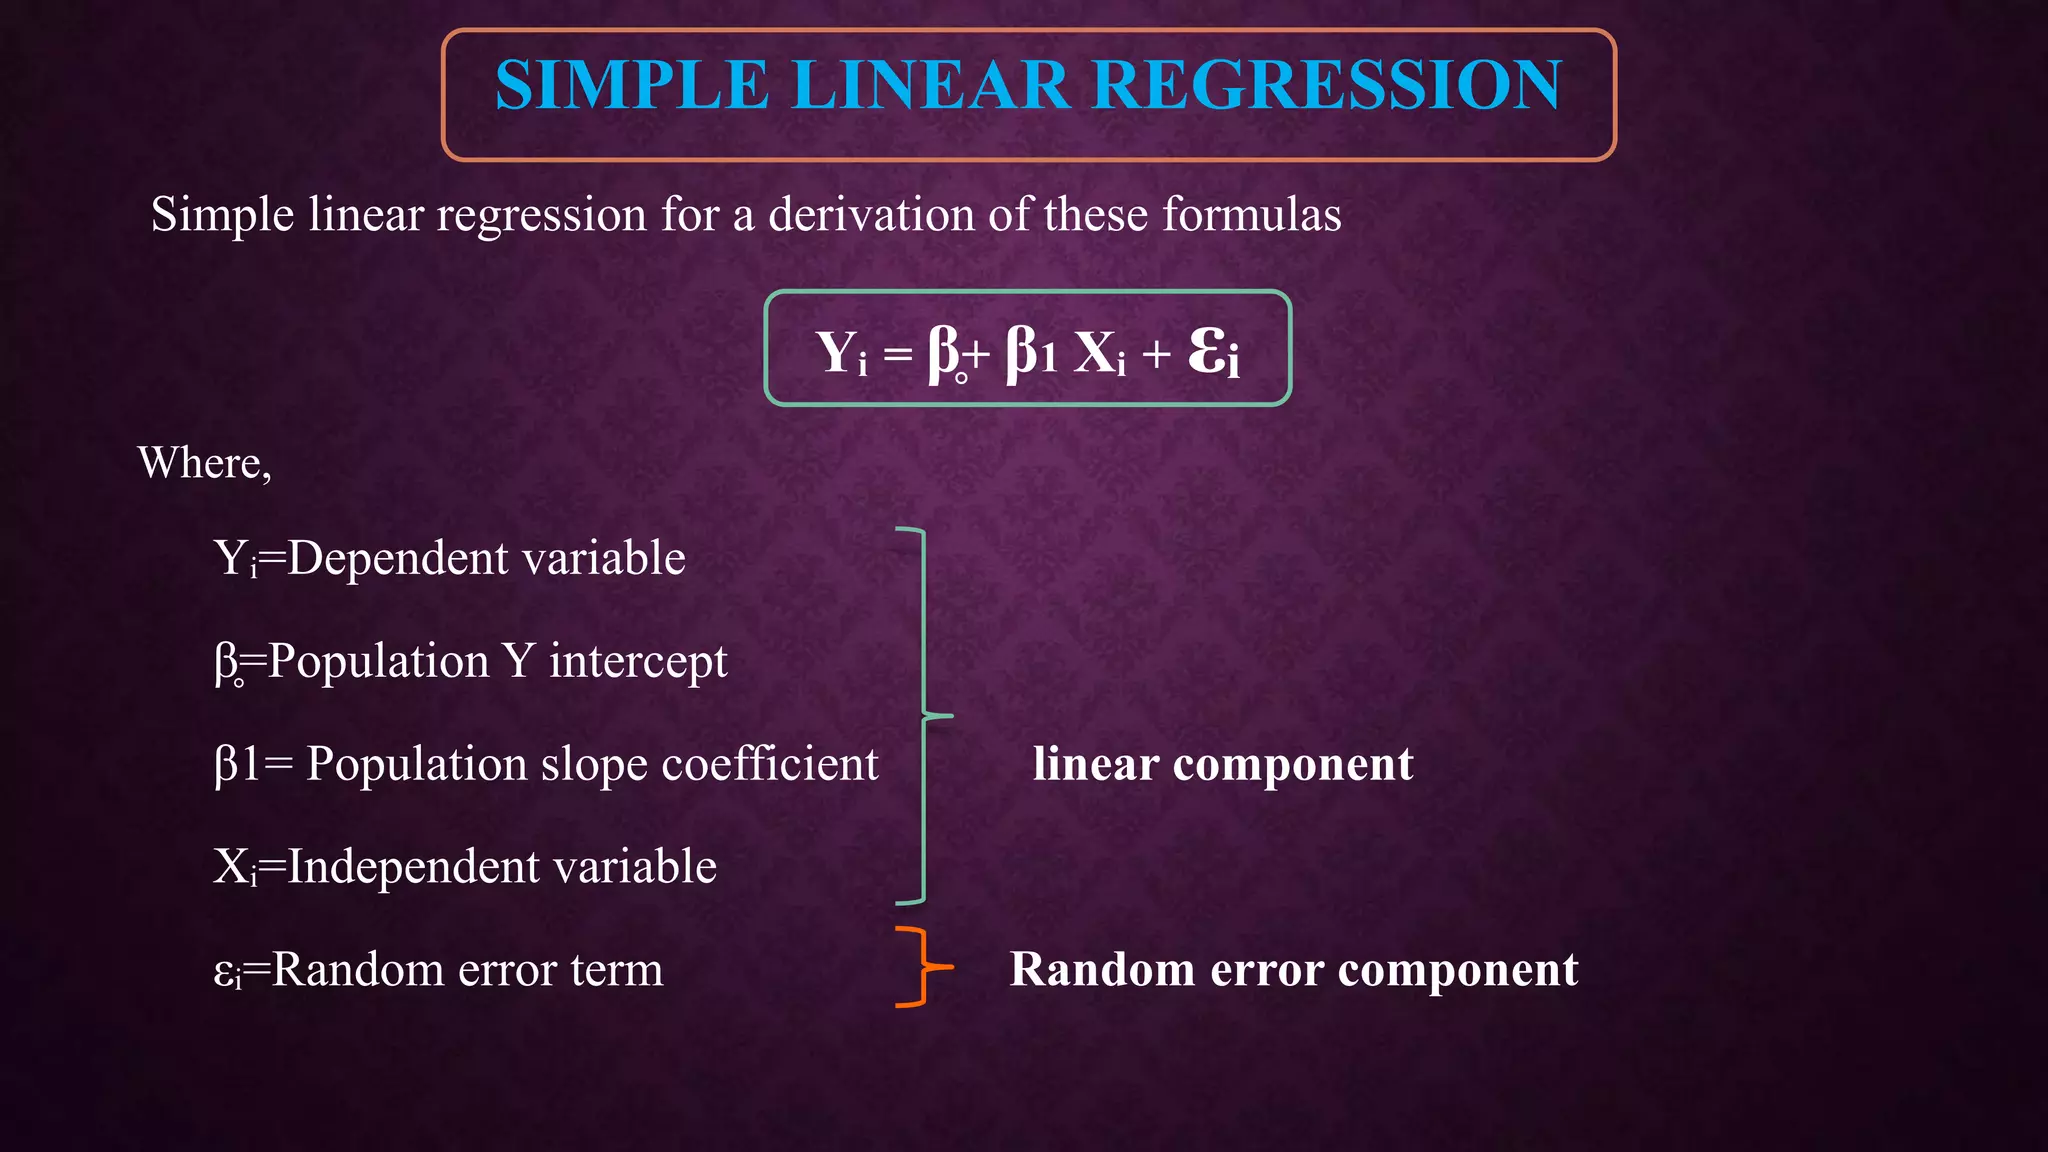

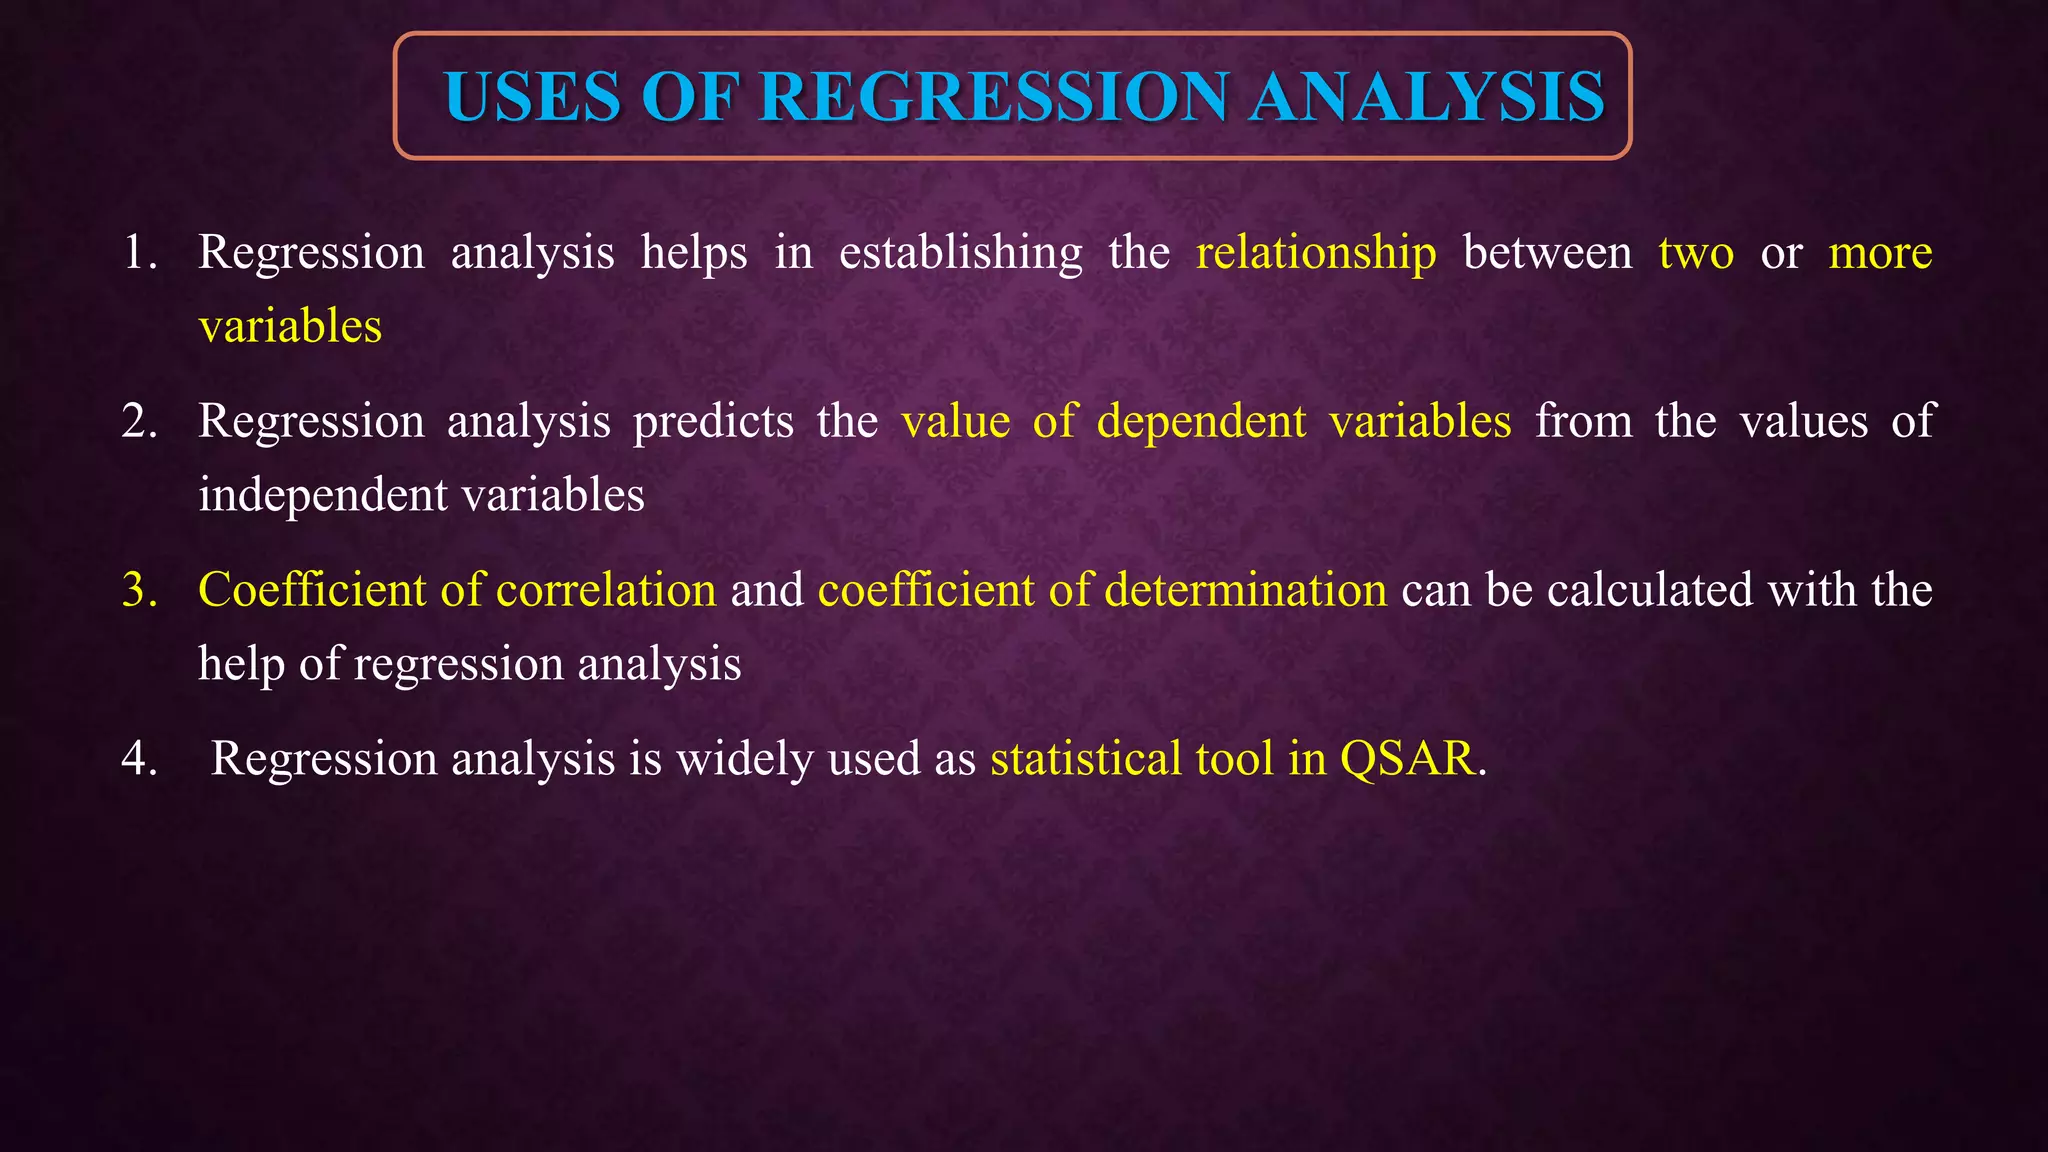


The document provides an overview of quantitative structure-activity relationship (QSAR) and its statistical methods, including regression analysis and partial least squares (PLS). It outlines various regression techniques, their applications, and the significance of statistical modeling in establishing relationships among variables in pharmacology and chemistry. Additional methods discussed include cluster analysis and principal component analysis, emphasizing their roles and applications across different fields.