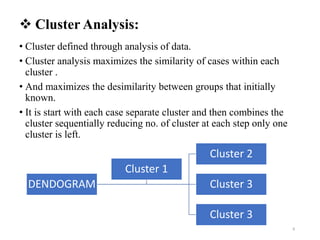
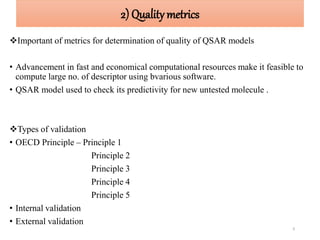
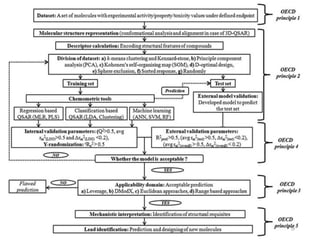
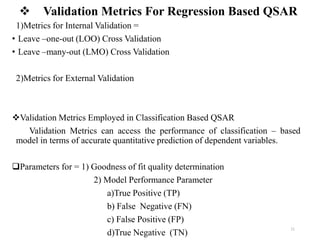
STATISTICAL METHODS OF QSAR
Rani T. Bhagat
M . Pharmacy,
(Pharmaceutical Chemistry)
1
CONTENT
INTRODUCTION
METHOD
CHEMOMETRIC TOOLS
QUALITY METRICS
IMPORTANCE
REFERANCES
2
3
Statistical method are mathematical formula, model and technique that are
used in statistical analysis of research data.
QSAR model represent the mathematical equation correlating the
response of chemical (activity or property ) with their structural and
physicochemical information in form of numerical quantities i,e
descriptor.
Regression based approach are employed data of chemical are
entirely numerical i, e quantitative or semi-quantitative chemical
response are modulated using classification technique
Developed QSAR model are also subjected to several validation test
to check for reliability of developed correlation method.
After it’s development ,QSAR model is usually verified by multiple
statistical validation strategies estimation of predictivity and stability.
Statistical tools used for data pre treatment feature selection , model
development , validation of QSAR .
Computer machine learning based method are also useful in developing
QSAR model.
INTRODUCTION
METHODS
1) Chemometric tools:
Various chemometric tools in QSAR
Pre-treatment of data table
Features selection
Multiple linear regression
Partial least square
Cluster analysis
2) Quality metrics:
Important metrics for determination quality model QSAR
Types of validation
Validation metrics for regression based QSAR model
Validation metrics employ in classification based QSAR
Parameter for receiver operating (ROC) characteristic analysis
4
1) Chemometric tools
Various chemometric tool used in QSAR
1) regression based approach
a)Multiple Linear Regression (MLR)
b)Partial Least Square (PLS)
2) classification based approach
a)Linear Descriminant Analysis (LDA)
b)Cluster analysis (CA)
 Pre-treatment of data table
 molecular str. Correctly draw
Biological activity or other activity have been taken from authentic source
Descriptor value have been computed using validate software
Response data for QSAR pattern modelling normal distribution pattern
Care shoud also taken to avoid duplicate in data set
Computation 3D descriptor optimization carried out 5
Features selection:
• Selection of appropriate descriptor for model development from pool of
large no. of descriptor is an imp.step in QSAR modelling.
• Selection done by variety of ways
Stepwise selection –
partial F- statistic = ‘F’ for inclusion and ‘F’ for exclusion
Multiple Linear Regression:
It is used in QSAR due to its simplicity ,trasparency, reproducibility,
interpretability.
Y= a0 + a1 × X1 + a2 × X2 + a3 × X3 +…………+an× Xn
Where, Y-response Dependent variable
a0-constant term
X1,X2,Xn-descriptorindependent variable
a1,a2,a3-regression coefficient
6
 Partial Least Square:
• It is better choice over MLR , PLS being generalization of MLR.
• It is used for predicting the pharmacokinetic, Pharmacodynamic ,
Toxicological property from structure derived physicochemical and
structural features.
• These method developed using the regression analysis.
Linear Descriminant Analysis
• LDA separate two more classes of object used for classification problem.
• LDA show the diff between classes of data predicted membership is
calculated by computing a discriminant function (DF) score.
• DF value smaller than cutoff value
DF= C1× X1 + C2 × X2 +……….+ CM × XM+ 0
Where , DF- Discriminant function
C-Discriminant coefficient
X- responding score foe variables
a- constant
m-No. of predictor variables 7
 Cluster Analysis:
• Cluster defined through analysis of data.
• Cluster analysis maximizes the similarity of cases within each
cluster .
• And maximizes the desimilarity between groups that initially
known.
• It is start with each case separate cluster and then combines the
cluster sequentially reducing no. of cluster at each step only one
cluster is left.
DENDOGRAM
Cluster 2
Cluster 3
Cluster 3
Cluster 1
8
2) Qualitymetrics
Important of metrics for determination of quality of QSAR models
• Advancement in fast and economical computational resources make it feasible to
compute large no. of descriptor using bvarious software.
• QSAR model used to check its predictivity for new untested molecule .
Types of validation
• OECD Principle – Principle 1
Principle 2
Principle 3
Principle 4
Principle 5
• Internal validation
• External validation
9
10
 Validation Metrics For Regression Based QSAR
1)Metrics for Internal Validation =
• Leave –one-out (LOO) Cross Validation
• Leave –many-out (LMO) Cross Validation
2)Metrics for External Validation
Validation Metrics Employed in Classification Based QSAR
Validation Metrics can access the performance of classification – based
model in terms of accurate quantitative prediction of dependent variables.
Parameters for = 1) Goodness of fit quality determination
2) Model Performance Parameter
a)True Positive (TP)
b) False Negative (FN)
c) False Positive (FP)
d)True Negative (TN)
11
 Parameter for Receiver Operating Characteristic
(ROC) Analysis
1) ROC Curve
TP rate- True Positive Rate on Y-axis
FP rate-False Positive Rate on X-axis
2) Metrics for pharmacological Distribution Diagram (PDD)
a) Activity Expectancy
b) Inactivity Expectancy
Activity Expectancy= Ea = % of actives
% of inactive + 100
Inactivity Expectancy= Ei = % of inactives
% of actives + 100
12
13
IMPORTANCE
It is used in
Computational
Chemistry represent
molecular structure as
numerical model
stimulate their
behaviour with the
help of quantum
mechanics .
It can Compute
energy related
properties such as
electronic ,
spectroscopic
properties for
molecule.
It is used for prediction
of Constitutional
Descriptor , molecular
weight , counts of
atom,bonds and rings
,topological descriptors,
connectivity of
molecule.
One of most
significant and
widely used
method is using
software computed
descriptor in
QSAR technique.
14
Equation generatedestablished in
QSAR studies are linear regression
equation.
A number of equation may be
generated or established for one
problem case under study. Statistic
also help in selecting one suitable best
fit equation out of them.
This may be done by checking std.
deviation or variance and other related
statistical parameter for data set used
for QSAR studies series of compound.
Correlation coefficient computed for
data set under study also help in
selecting appropriate QSAR equation.
Application of Statistics
15

STATISTICAL METHOD OF QSAR

  • 1.
    STATISTICAL METHODS OFQSAR Rani T. Bhagat M . Pharmacy, (Pharmaceutical Chemistry) 1
  • 2.
  • 3.
    3 Statistical method aremathematical formula, model and technique that are used in statistical analysis of research data. QSAR model represent the mathematical equation correlating the response of chemical (activity or property ) with their structural and physicochemical information in form of numerical quantities i,e descriptor. Regression based approach are employed data of chemical are entirely numerical i, e quantitative or semi-quantitative chemical response are modulated using classification technique Developed QSAR model are also subjected to several validation test to check for reliability of developed correlation method. After it’s development ,QSAR model is usually verified by multiple statistical validation strategies estimation of predictivity and stability. Statistical tools used for data pre treatment feature selection , model development , validation of QSAR . Computer machine learning based method are also useful in developing QSAR model. INTRODUCTION
  • 4.
    METHODS 1) Chemometric tools: Variouschemometric tools in QSAR Pre-treatment of data table Features selection Multiple linear regression Partial least square Cluster analysis 2) Quality metrics: Important metrics for determination quality model QSAR Types of validation Validation metrics for regression based QSAR model Validation metrics employ in classification based QSAR Parameter for receiver operating (ROC) characteristic analysis 4
  • 5.
    1) Chemometric tools Variouschemometric tool used in QSAR 1) regression based approach a)Multiple Linear Regression (MLR) b)Partial Least Square (PLS) 2) classification based approach a)Linear Descriminant Analysis (LDA) b)Cluster analysis (CA)  Pre-treatment of data table  molecular str. Correctly draw Biological activity or other activity have been taken from authentic source Descriptor value have been computed using validate software Response data for QSAR pattern modelling normal distribution pattern Care shoud also taken to avoid duplicate in data set Computation 3D descriptor optimization carried out 5
  • 6.
    Features selection: • Selectionof appropriate descriptor for model development from pool of large no. of descriptor is an imp.step in QSAR modelling. • Selection done by variety of ways Stepwise selection – partial F- statistic = ‘F’ for inclusion and ‘F’ for exclusion Multiple Linear Regression: It is used in QSAR due to its simplicity ,trasparency, reproducibility, interpretability. Y= a0 + a1 × X1 + a2 × X2 + a3 × X3 +…………+an× Xn Where, Y-response Dependent variable a0-constant term X1,X2,Xn-descriptorindependent variable a1,a2,a3-regression coefficient 6
  • 7.
     Partial LeastSquare: • It is better choice over MLR , PLS being generalization of MLR. • It is used for predicting the pharmacokinetic, Pharmacodynamic , Toxicological property from structure derived physicochemical and structural features. • These method developed using the regression analysis. Linear Descriminant Analysis • LDA separate two more classes of object used for classification problem. • LDA show the diff between classes of data predicted membership is calculated by computing a discriminant function (DF) score. • DF value smaller than cutoff value DF= C1× X1 + C2 × X2 +……….+ CM × XM+ 0 Where , DF- Discriminant function C-Discriminant coefficient X- responding score foe variables a- constant m-No. of predictor variables 7
  • 8.
     Cluster Analysis: •Cluster defined through analysis of data. • Cluster analysis maximizes the similarity of cases within each cluster . • And maximizes the desimilarity between groups that initially known. • It is start with each case separate cluster and then combines the cluster sequentially reducing no. of cluster at each step only one cluster is left. DENDOGRAM Cluster 2 Cluster 3 Cluster 3 Cluster 1 8
  • 9.
    2) Qualitymetrics Important ofmetrics for determination of quality of QSAR models • Advancement in fast and economical computational resources make it feasible to compute large no. of descriptor using bvarious software. • QSAR model used to check its predictivity for new untested molecule . Types of validation • OECD Principle – Principle 1 Principle 2 Principle 3 Principle 4 Principle 5 • Internal validation • External validation 9
  • 10.
  • 11.
     Validation MetricsFor Regression Based QSAR 1)Metrics for Internal Validation = • Leave –one-out (LOO) Cross Validation • Leave –many-out (LMO) Cross Validation 2)Metrics for External Validation Validation Metrics Employed in Classification Based QSAR Validation Metrics can access the performance of classification – based model in terms of accurate quantitative prediction of dependent variables. Parameters for = 1) Goodness of fit quality determination 2) Model Performance Parameter a)True Positive (TP) b) False Negative (FN) c) False Positive (FP) d)True Negative (TN) 11
  • 12.
     Parameter forReceiver Operating Characteristic (ROC) Analysis 1) ROC Curve TP rate- True Positive Rate on Y-axis FP rate-False Positive Rate on X-axis 2) Metrics for pharmacological Distribution Diagram (PDD) a) Activity Expectancy b) Inactivity Expectancy Activity Expectancy= Ea = % of actives % of inactive + 100 Inactivity Expectancy= Ei = % of inactives % of actives + 100 12
  • 13.
    13 IMPORTANCE It is usedin Computational Chemistry represent molecular structure as numerical model stimulate their behaviour with the help of quantum mechanics . It can Compute energy related properties such as electronic , spectroscopic properties for molecule. It is used for prediction of Constitutional Descriptor , molecular weight , counts of atom,bonds and rings ,topological descriptors, connectivity of molecule. One of most significant and widely used method is using software computed descriptor in QSAR technique.
  • 14.
    14 Equation generatedestablished in QSARstudies are linear regression equation. A number of equation may be generated or established for one problem case under study. Statistic also help in selecting one suitable best fit equation out of them. This may be done by checking std. deviation or variance and other related statistical parameter for data set used for QSAR studies series of compound. Correlation coefficient computed for data set under study also help in selecting appropriate QSAR equation. Application of Statistics
  • 15.