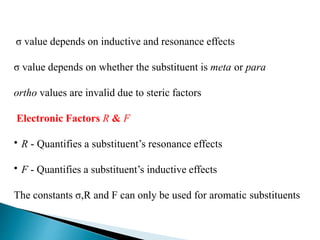
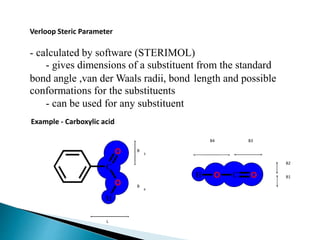
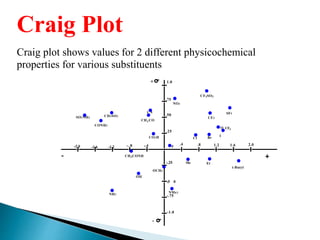
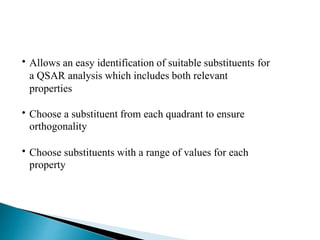
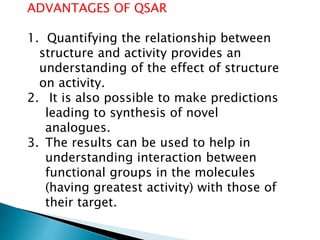
The document discusses quantitative structure-activity relationships (QSAR) in drug design, highlighting the importance of physicochemical properties such as hydrophobicity, electronic effects, and steric factors in relation to biological activity. It explains methodologies for measuring these properties, including the use of the Hansch equation and Craig plot for analyzing the relationship between molecular structure and biological effects. The document also outlines the advantages and disadvantages of QSAR, emphasizing its applications in predicting drug activity and toxicity.


![HYDROPHOBICITY
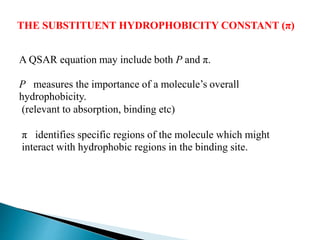
Hydrophobic character of a drug is crucial to how easily it
crosses the cell membrane and may also important in receptor
interactions.
Hydrophobicity of a drug is measured experimentally by
testing the drugs relative distribution in octanol water mixture.
This relative distribution is known as partition coefficient.
Partition Coefficient P = [conc. Drug in in octanol]
[Conc.of drug in water]](https://image.slidesharecdn.com/qsar-uma-180507142530/85/Qsar-UMA-9-320.jpg)
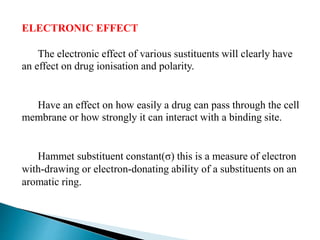
![σ for aromatic substituents is measured by comparing the
dissociation constants of substituted benzoic acids with
benzoic acid
+
+- HCOOH COO
-[PhCO 2]
[PhCO 2H]
=K H = Dissociation constant](https://image.slidesharecdn.com/qsar-uma-180507142530/85/Qsar-UMA-16-320.jpg)