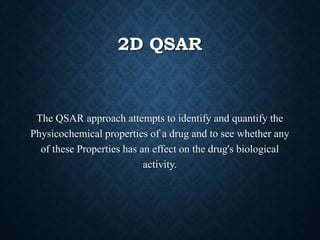
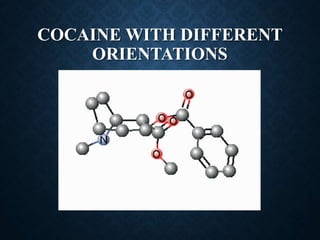
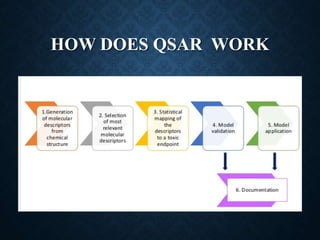
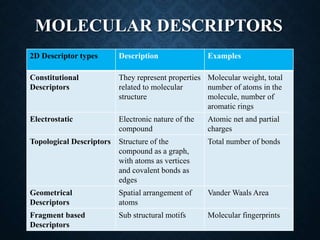
2D – QSAR
NIET, PHARMACY
COLLEGE
Presented by:
Ajay Kumar
Under the guidance of
Dr. Salahuddin
INDEX
• Definition
• Methods or equations
• Hansch Analysis
• Free Wilson Analysis
• Statistical methods
• Cluster Analysis
• Workflow
• Molecular Descriptors
• Reference
TERMINOLOGIES
o SAR: The structure–activity relationship (SAR) is the relationship
between the chemical or 3D structure of a molecule and its biological
activity. This idea was first presented by Crum-Brown and Fraser in
1865.
o QSAR: Quantitative structure-activity relationships are mathematical
relationships linking chemical structure and pharmacological activity in
a quantitative manner for a series of compounds. Methods which can be
used in QSAR include various regression and pattern recognition
techniques.
2D QSAR
The QSAR approach attempts to identify and quantify the
Physicochemical properties of a drug and to see whether any
of these Properties has an effect on the drug's biological
activity.
COCAINE WITH DIFFERENT
ORIENTATIONS
METHODS
Free energy models
Hansch analysis (Linear Free Energy Relationship, LFER)
Mathematical models
Free Wilson analysis
Other statistical methods
Cluster Analysis (CA)
HANSCH ANALYSIS
• In 1969, Corwin Hansch describe the effectiveness of a
biologically active molecule. Quantify of the interaction of
drug molecules with biological system.
• Interaction with the receptor site which in turn depends on,
o Bulk of substituent groups (steric)
o Electron density on attachment group (electronic)
• He suggested linear and non-linear dependence of
biological activity on different parameters.
HANSCH ANALYSIS
Log(1/c)= -k1(logP)2+k2logP+k3σ+k4ES+k5
Where,
Log(1/c) = Biological activity
LogP = Partition / distribution constant
σ = Hammett substituent constant
ES = Steric factor
K = Rate constant
FREE WILSON ANALYSIS
The Free-Wilson approach is truly a structure-activity based
methodology because it incorporates the contribution made by
various structural fragments to the overall biological activity.
Indicator variables are used to denote the presence or absence of a
particular structural feature. It is represented by equation
BA = Σ a I x i + μ
Where BA is the biological activity, μ is the overall activity, a i is
the contribution of each structural feature, x i denotes the
presence (x i = 1) or absence (x i = 0) of particular structural
fragment.
STATISTICAL METHODS
OF QSAR
CLUSTER ANALYSIS
Cluster analysis is the process of dividing a collection of objects
(molecules) into groups (or cluster) such that the objects within a
cluster are highly similar whereas objects in different clusters are
dissimilar. When applied to a compound dataset, the resulting
clusters provide an overview of the range of structural types
within the dataset and a diverse subset of compounds can be
selected by choosing one or more compounds from each cluster.
Clustering methods can be used to select diverse subset of
compounds from larger dataset. The clustering methods most
widely applied to compound selection include k-means
clustering, non-hierarchiral clustering and hierarchial clustering.
HOW DOES QSAR WORK
MOLECULAR DESCRIPTORS
2D Descriptor types Description Examples
Constitutional
Descriptors
They represent properties
related to molecular
structure
Molecular weight, total
number of atoms in the
molecule, number of
aromatic rings
Electrostatic Electronic nature of the
compound
Atomic net and partial
charges
Topological Descriptors Structure of the
compound as a graph,
with atoms as vertices
and covalent bonds as
edges
Total number of bonds
Geometrical
Descriptors
Spatial arrangement of
atoms
Vander Waals Area
Fragment based
Descriptors
Sub structural motifs Molecular fingerprints
REFERENCE
• Leach A. R.; 2001; QSAR principles and Applications; Second edition;
Pearson Hall; England; pp 1-127.
• Young D. D.; 2009; Computational Drug Design: A Guide for
Computational and Medicinal Chemists; John Wiley & Sons, Inc.; New
Jersey; pp 119-123, 187-194.
• Atkins P., Freidman R.; 2005 QSAR; Fourth edition; Oxford University
Press Inc.; New York; pp 249, 250, 288-338.
• Raha K., Peter M., Ning Yu B., Wollcott A., Westerhoff L., Merz Jr K.;
2007; Drug Discovery Today; Volume 12; no. 17/18; pp 725-731.
2D - QSAR
2D - QSAR

2D - QSAR

  • 1.
    2D – QSAR NIET,PHARMACY COLLEGE Presented by: Ajay Kumar Under the guidance of Dr. Salahuddin
  • 2.
    INDEX • Definition • Methodsor equations • Hansch Analysis • Free Wilson Analysis • Statistical methods • Cluster Analysis • Workflow • Molecular Descriptors • Reference
  • 3.
    TERMINOLOGIES o SAR: Thestructure–activity relationship (SAR) is the relationship between the chemical or 3D structure of a molecule and its biological activity. This idea was first presented by Crum-Brown and Fraser in 1865. o QSAR: Quantitative structure-activity relationships are mathematical relationships linking chemical structure and pharmacological activity in a quantitative manner for a series of compounds. Methods which can be used in QSAR include various regression and pattern recognition techniques.
  • 4.
    2D QSAR The QSARapproach attempts to identify and quantify the Physicochemical properties of a drug and to see whether any of these Properties has an effect on the drug's biological activity.
  • 5.
  • 6.
    METHODS Free energy models Hanschanalysis (Linear Free Energy Relationship, LFER) Mathematical models Free Wilson analysis Other statistical methods Cluster Analysis (CA)
  • 7.
    HANSCH ANALYSIS • In1969, Corwin Hansch describe the effectiveness of a biologically active molecule. Quantify of the interaction of drug molecules with biological system. • Interaction with the receptor site which in turn depends on, o Bulk of substituent groups (steric) o Electron density on attachment group (electronic) • He suggested linear and non-linear dependence of biological activity on different parameters.
  • 8.
    HANSCH ANALYSIS Log(1/c)= -k1(logP)2+k2logP+k3σ+k4ES+k5 Where, Log(1/c)= Biological activity LogP = Partition / distribution constant σ = Hammett substituent constant ES = Steric factor K = Rate constant
  • 9.
    FREE WILSON ANALYSIS TheFree-Wilson approach is truly a structure-activity based methodology because it incorporates the contribution made by various structural fragments to the overall biological activity. Indicator variables are used to denote the presence or absence of a particular structural feature. It is represented by equation BA = Σ a I x i + μ Where BA is the biological activity, μ is the overall activity, a i is the contribution of each structural feature, x i denotes the presence (x i = 1) or absence (x i = 0) of particular structural fragment.
  • 10.
  • 11.
    CLUSTER ANALYSIS Cluster analysisis the process of dividing a collection of objects (molecules) into groups (or cluster) such that the objects within a cluster are highly similar whereas objects in different clusters are dissimilar. When applied to a compound dataset, the resulting clusters provide an overview of the range of structural types within the dataset and a diverse subset of compounds can be selected by choosing one or more compounds from each cluster. Clustering methods can be used to select diverse subset of compounds from larger dataset. The clustering methods most widely applied to compound selection include k-means clustering, non-hierarchiral clustering and hierarchial clustering.
  • 12.
  • 13.
    MOLECULAR DESCRIPTORS 2D Descriptortypes Description Examples Constitutional Descriptors They represent properties related to molecular structure Molecular weight, total number of atoms in the molecule, number of aromatic rings Electrostatic Electronic nature of the compound Atomic net and partial charges Topological Descriptors Structure of the compound as a graph, with atoms as vertices and covalent bonds as edges Total number of bonds Geometrical Descriptors Spatial arrangement of atoms Vander Waals Area Fragment based Descriptors Sub structural motifs Molecular fingerprints
  • 14.
    REFERENCE • Leach A.R.; 2001; QSAR principles and Applications; Second edition; Pearson Hall; England; pp 1-127. • Young D. D.; 2009; Computational Drug Design: A Guide for Computational and Medicinal Chemists; John Wiley & Sons, Inc.; New Jersey; pp 119-123, 187-194. • Atkins P., Freidman R.; 2005 QSAR; Fourth edition; Oxford University Press Inc.; New York; pp 249, 250, 288-338. • Raha K., Peter M., Ning Yu B., Wollcott A., Westerhoff L., Merz Jr K.; 2007; Drug Discovery Today; Volume 12; no. 17/18; pp 725-731.