HANSCH ANALYSIS IN QSAR in principles of drug discovery
1.
HANSCH ANALYSIS INQSAR
PRINCIPLES OF DRUG DISCOVERY
PRESENTED BY,
A.CHIFORA,
M.PHARM-2ND
SEM,
DEPT. OF PHARMACOLOGY,
COP-SRIPMS.
1
2.
TABLE OF CONTENTS:
QSAR
GRAPHICAL REPRESENTATION
PHYSIOCHEMICAL PARAMETERS
METHODS OF QSAR
HANSCH ANALYSIS
LIPINSKI RULE OF FIVE
PARAMETERS IN HANSCH ANALYSIS
ADVANTAGES
CONCLUSION
REFERENCES
2
3.
INTRODUCTION
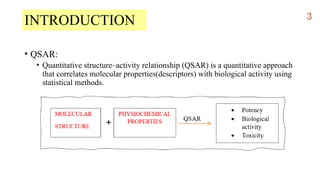
• QSAR:
• Quantitativestructure–activity relationship (QSAR) is a quantitative approach
that correlates molecular properties(descriptors) with biological activity using
statistical methods.
3
4.
GRAPHICAL REPRESENTATION-linear relationship
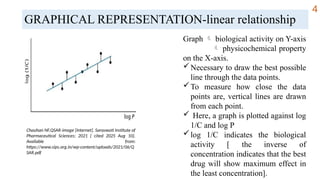
Graph biological activity on Y-axis
physicochemical property
on the X-axis.
Necessary to draw the best possible
line through the data points.
To measure how close the data
points are, vertical lines are drawn
from each point.
Here, a graph is plotted against log
1/C and log P
log 1/C indicates the biological
activity [ the inverse of
concentration indicates that the best
drug will show maximum effect in
the least concentration].
Chauhan NF.QSAR-image [Internet]. Saraswati Institute of
Pharmaceutical Sciences; 2021 [ cited 2025 Aug 10].
Available from:
https://www.sips.org.in/wp-content/uploads/2021/06/Q
SAR.pdf
4
5.
GRAPHICAL REPRESENTATION- Non-linearrelationship
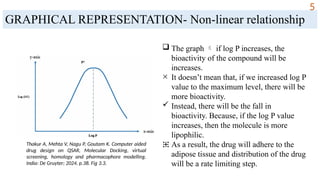
The graph if log P increases, the
bioactivity of the compound will be
increases.
× It doesn’t mean that, if we increased log P
value to the maximum level, there will be
more bioactivity.
Instead, there will be the fall in
bioactivity. Because, if the log P value
increases, then the molecule is more
lipophilic.
⁜ As a result, the drug will adhere to the
adipose tissue and distribution of the drug
will be a rate limiting step.
Thakur A, Mehta V, Nagu P, Goutam K. Computer aided
drug design on QSAR, Molecular Docking, virtual
screening, homology and pharmacophore modelling.
India: De Gruyter; 2024. p.38. Fig 3.3.
5
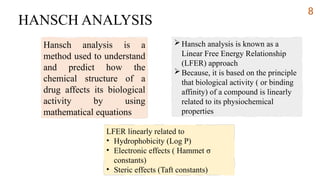
HANSCH ANALYSIS
Hansch analysisis a
method used to understand
and predict how the
chemical structure of a
drug affects its biological
activity by using
mathematical equations
Hansch analysis is known as a
Linear Free Energy Relationship
(LFER) approach
Because, it is based on the principle
that biological activity ( or binding
affinity) of a compound is linearly
related to its physiochemical
properties
LFER linearly related to
• Hydrophobicity (Log P)
• Electronic effects ( Hammet σ
constants)
• Steric effects (Taft constants)
8
9.
LIPINSKI’S RULE OFFIVE
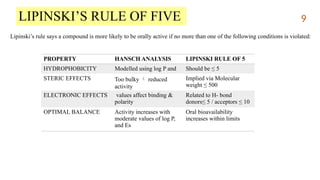
Lipinski’s rule says a compound is more likely to be orally active if no more than one of the following conditions is violated:
PROPERTY HANSCH ANALYSIS LIPINSKI RULE OF 5
HYDROPHOBICITY Modelled using log P and Should be ≤ 5
STERIC EFFECTS Too bulky reduced
activity
Implied via Molecular
weight ≤ 500
ELECTRONIC EFFECTS values affect binding &
polarity
Related to H- bond
donors≤ 5 / acceptors ≤ 10
OPTIMAL BALANCE Activity increases with
moderate values of log P,
and Es
Oral bioavailability
increases within limits
9
10.
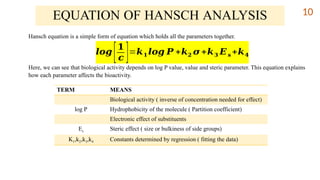
Hansch equation isa simple form of equation which holds all the parameters together.
Here, we can see that biological activity depends on log P value, value and steric parameter. This equation explains
how each parameter affects the bioactivity.
EQUATION OF HANSCH ANALYSIS
𝒍𝒐𝒈
[𝟏
𝒄 ]=𝒌𝟏 𝒍𝒐𝒈 𝑷 +𝒌𝟐 𝝈 +𝒌𝟑 𝑬𝒔 +𝒌𝟒
TERM MEANS
Biological activity ( inverse of concentration needed for effect)
log P Hydrophobicity of the molecule ( Partition coefficient)
Electronic effect of substituents
Es Steric effect ( size or bulkiness of side groups)
K1,k2,k3,k4 Constants determined by regression ( fitting the data)
10
11.
PARAMETERS IN HANSCHANALYSIS
Hansch analysis helps relate a molecule’s structure to its biological activity
using physiochemical parameters. Among all, the most important parameters
are:
Partition coefficient (usually measured as log P)
Electronic effects (like Hammett constants)
Steric parameters (Taft’s steric constant)
11
12.
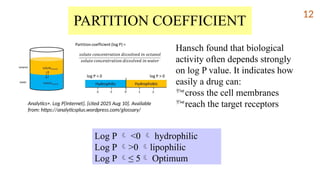
PARTITION COEFFICIENT
Hansch foundthat biological
activity often depends strongly
on log P value. It indicates how
easily a drug can:
cross the cell membranes
reach the target receptors
Log P <0 hydrophilic
Log P >0 lipophilic
Log P ≤ 5 Optimum
Analytics+. Log P[Internet]. [cited 2025 Aug 10]. Available
from: https://analyticsplus.wordpress.com/glossary/
12
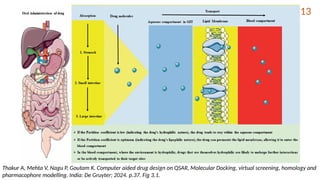
13.
Thakur A, MehtaV, Nagu P, Goutam K. Computer aided drug design on QSAR, Molecular Docking, virtual screening, homology and
pharmacophore modelling. India: De Gruyter; 2024. p.37. Fig 3.1.
13
14.
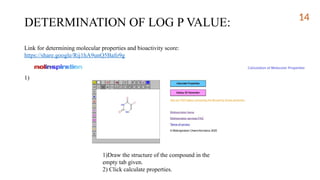
DETERMINATION OF LOGP VALUE:
Link for determining molecular properties and bioactivity score:
https://share.google/Rij1hA9unQ5Bafo9g
1)
1)Draw the structure of the compound in the
empty tab given.
2) Click calculate properties.
14
15.
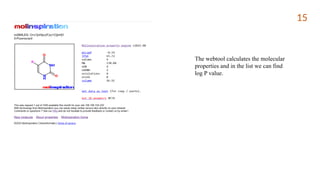
The webtool calculatesthe molecular
properties and in the list we can find
log P value.
15
16.
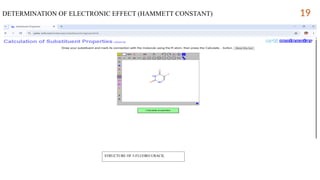
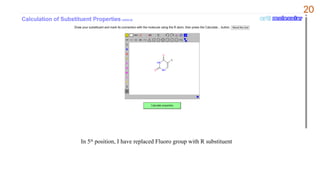
ELECTRONIC EFFECTS:
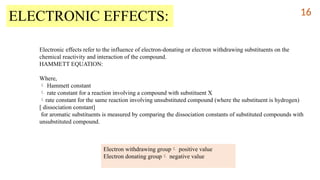
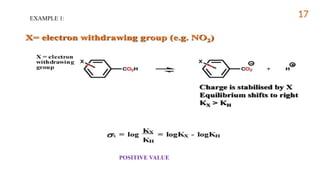
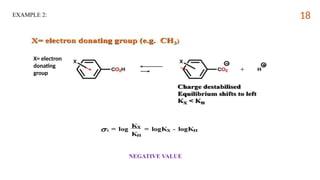
Electronic effectsrefer to the influence of electron-donating or electron withdrawing substituents on the
chemical reactivity and interaction of the compound.
HAMMETT EQUATION:
Where,
Hammett constant
rate constant for a reaction involving a compound with substituent X
rate constant for the same reaction involving unsubstituted compound (where the substituent is hydrogen)
[ dissociation constant]
for aromatic substituents is measured by comparing the dissociation constants of substituted compounds with
unsubstituted compound.
Electron withdrawing group positive value
Electron donating group negative value
16
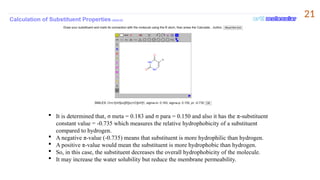
It isdetermined that, σ meta = 0.183 and σ para = 0.150 and also it has the π-substituent
constant value = -0.735 which measures the relative hydrophobicity of a substituent
compared to hydrogen.
A negative π-value (-0.735) means that substituent is more hydrophilic than hydrogen.
A positive π-value would mean the substituent is more hydrophobic than hydrogen.
So, in this case, the substituent decreases the overall hydrophobicity of the molecule.
It may increase the water solubility but reduce the membrane permeability.
21
22.
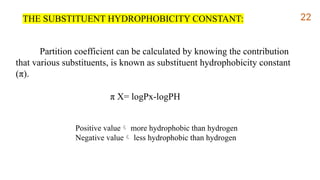
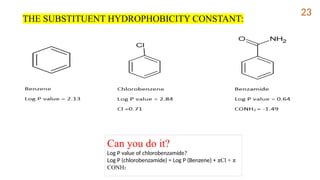
Partition coefficient canbe calculated by knowing the contribution
that various substituents, is known as substituent hydrophobicity constant
(π).
π X= logPx-logPH
Positive value more hydrophobic than hydrogen
Negative value less hydrophobic than hydrogen
THE SUBSTITUENT HYDROPHOBICITY CONSTANT: 22
23.
Can you doit?
Log P value of chlorobenzamide?
Log P (chlorobenzamide) = Log P (Benzene) + πCl + π
CONH2
THE SUBSTITUENT HYDROPHOBICITY CONSTANT:
23
24.
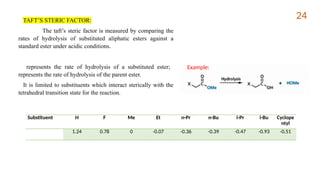
TAFT’S STERIC FACTOR:
Thetaft’s steric factor is measured by comparing the
rates of hydrolysis of substituted aliphatic esters against a
standard ester under acidic conditions.
represents the rate of hydrolysis of a substituted ester;
represents the rate of hydrolysis of the parent ester.
It is limited to substituents which interact sterically with the
tetrahedral transition state for the reaction.
Substituent H F Me Et n-Pr n-Bu i-Pr i-Bu Cyclope
ntyl
1.24 0.78 0 -0.07 -0.36 -0.39 -0.47 -0.93 -0.51
Example:
24
25.
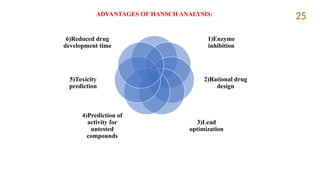
ADVANTAGES OF HANSCHANALYSIS:
1)Enzyme
inhibition
2)Rational drug
design
3)Lead
optimization
4)Prediction of
activity for
untested
compounds
5)Toxicity
prediction
6)Reduced drug
development time
25
26.
26
CONCLUSION
1. Enabling scientiststo design new drugs with higher activity and lower toxicity
before synthesis.
2. Integrated with AI, it is used in targeted and personalized therapies.
3. It reduces trial-and-error in drug discovery, saves time, cost and resources.
Qsar?
Hansch
Analysis?
Qsar
Hansch
Analysis
27.
REFERENCES:
1. Kubinyi H.QSAR: Hansch analysis and related approaches. In: Mannhold R, Krogsgaard-Larsen P,
Timmerman H, editors. Methods and principles in medicinal chemistry. New York: VCH Publishers; p.57-
62.
2. Thakur A, Mehta V, Nagu P, Goutam K. Computer aided drug design on QSAR, Molecular Docking,
virtual screening, homology and pharmacophore modelling. India: De Gruyter; 2024. p.34-46.
3. Jhanwar B, Sharma V, Singla RK, Shrivastava B. QSAR- Hansch analysis and related approaches in drug
design. Pharmacologyonline [Internet]. 2011;1:306-344. Available from:
https://d1wqtxts1xzle7.cloudfront.net/43949489/QSAR_Hansch_Analysis_Review_Article-libre.pdf
4. Malik J, Soni H, Singhai AK, Pandey H. QSAR-Application inDrug design. International Journal of
Pharmaceutical Research & Allied sciences. 2013;2(1):1-13. Available from:
https://ijpras.com/storage/models/article/azzGIVmEI52klW3L3LM7z1GUBSlu4CmFME2fy5HMNDwFr3
35qXjtqIxTlvV9/qsar-application-in-drug-design.pdf
5. Ertl P. A web tool for calculating substituent descriptors compatible with Hammett sigma constants
[Internet]. 2021 [cited 2025 Aug 12]. Available from:
https://peter-ertl.com/molecular/substituents/sigmas.html.
6. Molinspiration SMILES Depiction [Internet]. Molinspiration; [cited 2025 Aug 12]. Available from:
https://www.molinspiration.com/docu/depiction/index.html
7. Narasimhan B. QSAR by Hansch analysis. J Pharm BioSci. 2014;2(4):2-6.
27
 Most read
 Most read
 Most read