Downloaded 149 times

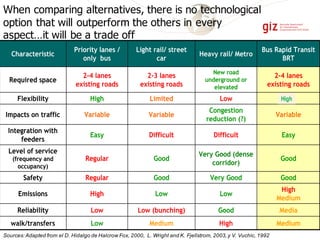
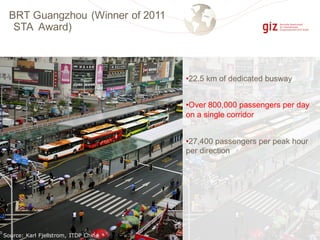
![Equivalency road width:In order to carry 20,000 automobile commuters PHPD,a highway mustbe at least 18 lanes wide.
(assumption 1.2 passengers per automobile)
€€€190001500-
2000
Mixed
Traffic
€€
40000 –
60000
Heavy Rail/
Metro
€€€€€
€€€€€
€€€€€
€€€€€
€€€€€
€€€€€
€€€€€
€€€€€
€€€€€
€€€€€
€€€€€
€€€€€
€€€€€
€€€€€
€€€€€
€€€€€
€€€€€
€€€€€
€€€€€
€€€€€
€€€€€
€€€€€
€€€€€
€€€€€
€€€€€
€€€€€
€€€€€
€€€€€
€€€€€
€€€€€
€€€€€
€€€€€
€€€€€
€€€€€
€€€€€
€€€€€
60000 –
90000
Suburban
Rail
(e.g. Mumbai)
€
€€€
€€€
€€€
€€€
€€€
€€€
14000
€€
€€€
€€€
€€€
€€€
Cyclists
€€
€€€
€€€
€€€
€€€
€€€
9000
BRT
single lane
Pedestrians
5000
€€€
€€€
€€€
Regular
Bus
??
BRT
double lane
€
€€€€
€€€€
€€€€
€€€€
€€€€
€€€€
€€€€
€€€€
€€€€
€€€€
€€€€
Light Rail
€
€€€
€€€
€€€
€€€
€€€
€€€
€€€
18000 –
20000
(people per hour on 3.5 m wide lane in the city – PPHPD [PAX/hour/direction])
Source: Botma & Papendrecht, TU Delft 1991 andown figures
PPHPD
Range (à)
2000 8000 14000 17000,
Curitiba
19000 20000 43000,
Bogotá
80000,
HKK
>100000,
Mumbai
Maximum
PPHPD
achieved &
where (à)
Choosing modes – Carrying Capacity](https://image.slidesharecdn.com/03publictransportimprovementmbsk-151008170955-lva1-app6892/85/Public-transport-improvement-25-320.jpg)
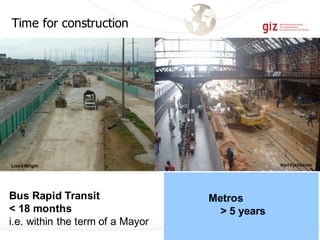
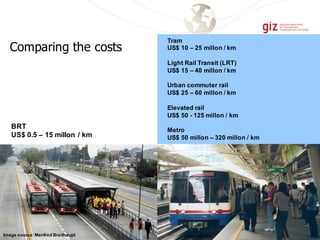
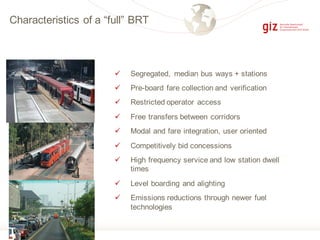
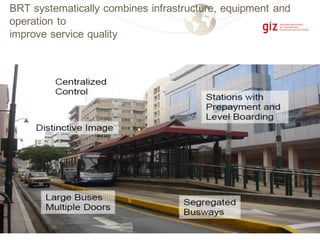
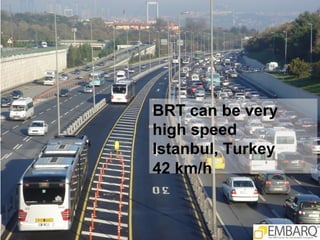
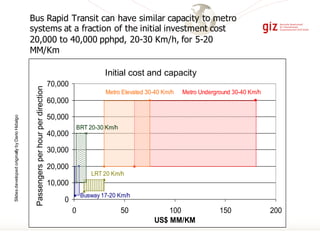
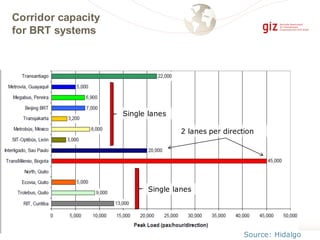
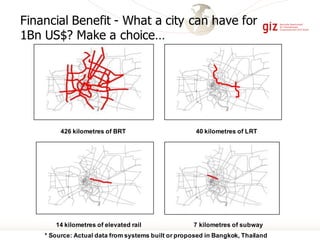
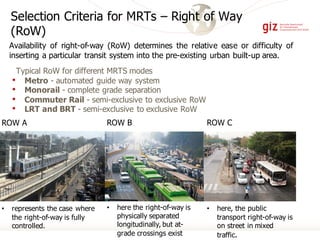
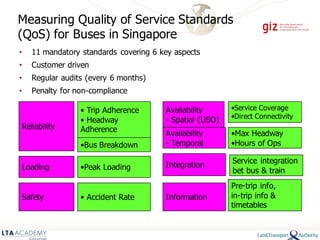

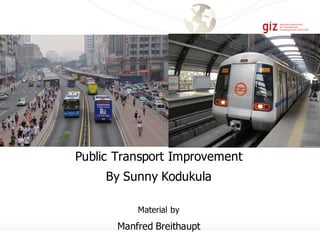
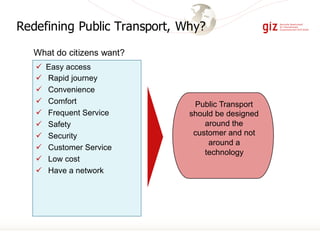
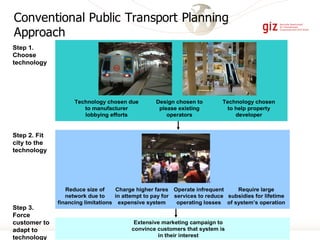
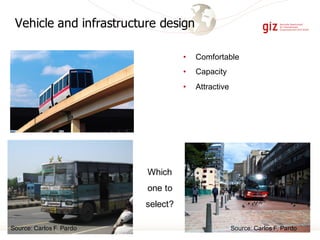
Public transport systems can be improved by focusing on customer needs rather than technology or existing operators. The most effective systems prioritize public transport, integrate different modes, and plan frequent services on a full network. While metro and heavy rail require large subsidies, bus rapid transit (BRT) provides high capacity at a fraction of the cost, constructing over 400km of BRT for the price of 7km of subway. BRT is also faster to implement, requiring under 18 months compared to over 5 years for metros.