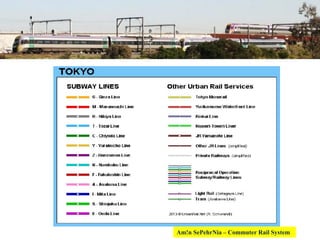
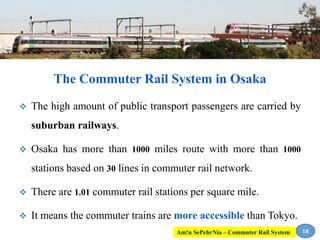
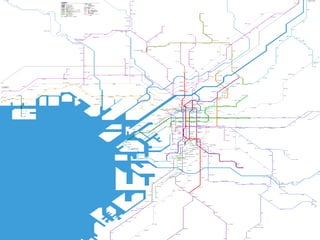
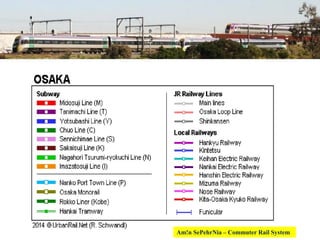
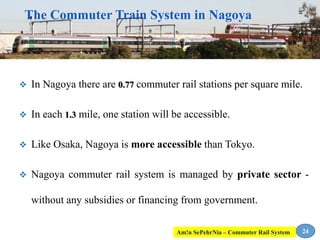
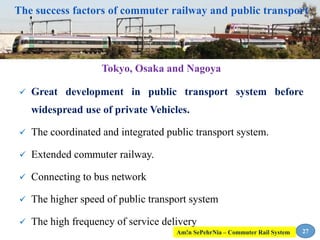
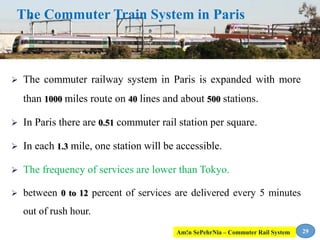
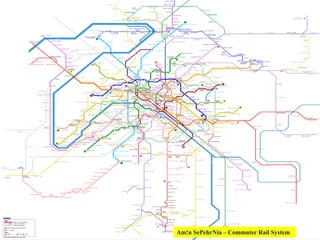
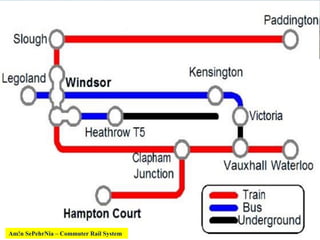
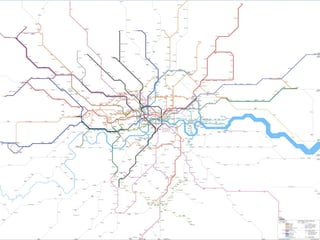
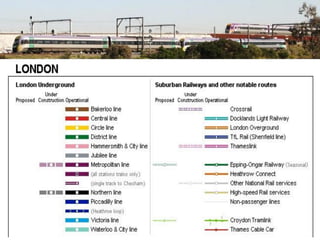
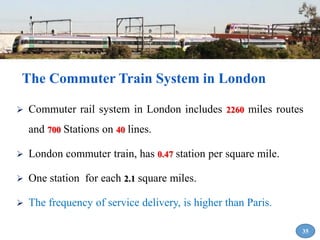
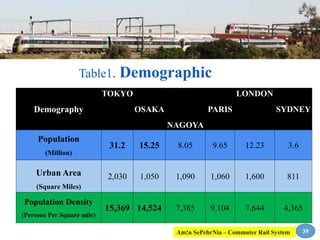
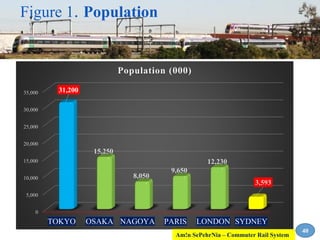
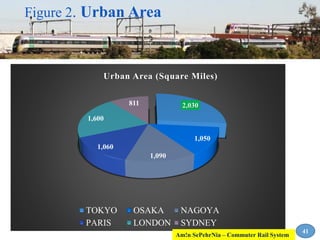
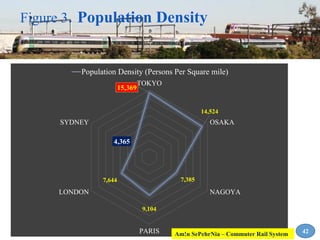
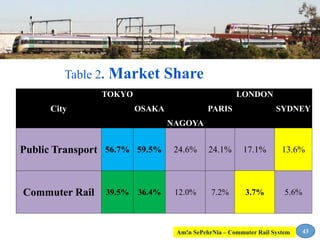
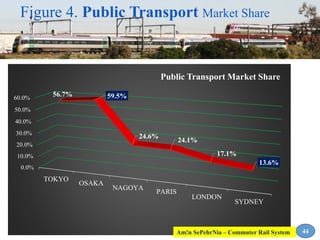
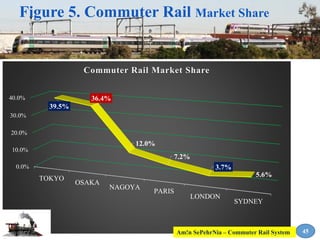
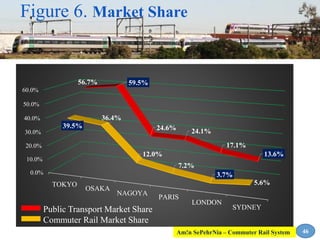
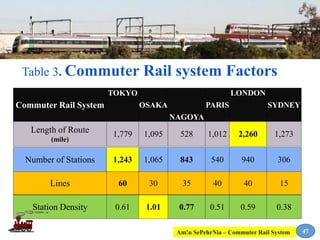
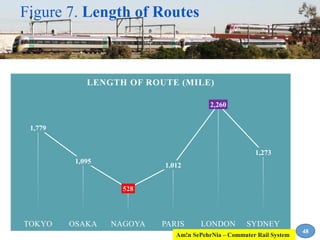
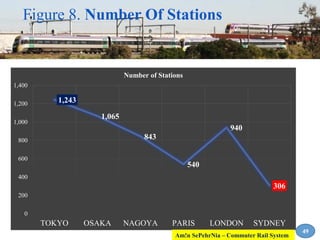
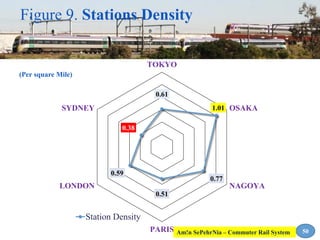
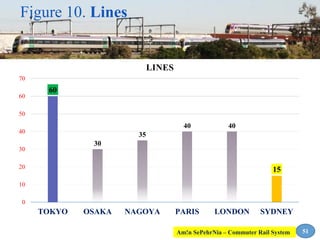
Commuter Rail System
An Analyze In Developed Countries
Present:
Amin SePehrNia
Definitions and concepts
 Commuter rail is a public transport system in which delivers
service to commuters.
 Commuter lines normally extend an average of 50 miles from
their downtown terminus.
 Commuter train is a passenger train that is ridden mainly by
passengers who travel regularly from one place to another.
2Am!n SePehrNia – Commuter Rail System
 The trains are normally made up of a locomotive and a
number of passenger coaches.
 The coaches are dimensionally similar to intercity coaches, but
typically have higher density seating as the average ride is
shorter.
 Commuter rail, also called suburban rail.
3
Definitions and concepts
Am!n SePehrNia – Commuter Rail System
Characteristics
 Providing more seating and less standing space, for the longer
distances involved.
 Having scheduled services.
 Deliver services to lower-density suburban areas.
 Having a lower frequency of service.
 In ideal situation, trains run at high speed, they’re scheduled
and they have minimum stops.
4Am!n SePehrNia – Commuter Rail System
The scheduled Trains
 Commuter rail system has lower frequency in compare with
rapid railway.
 Instead of fixed times it follows scheduled programs.
 Moreover fewer stations have separated with longer distances.
 At first commuter rail, serves the suburbs with lower density
and often shares its right with other rail transportation system.
5Am!n SePehrNia – Commuter Rail System
 In some cases services are only offered in rush hours.
 In some cities, service is operated throughout the day and
evening and on weekends.
 The distance range of commuter trains varies between 15
to 200 kilometers.
6
The scheduled Trains
Am!n SePehrNia – Commuter Rail System
Differences between CR and other rail transport systems
 Inter-city trains are more comfortable than commuter trains.
 In inter-city train there are many spaces for passengers’ luggage.
 As the most important thing in commuter train is“the number of
seats”.
 Generally commuter trains are optimized for maximum seats.
7Am!n SePehrNia – Commuter Rail System
 The “rapid transport”
 Normally covers the urban areas with higher trains frequency.
 Runs in domain between 12 to 20 km
 Serves on a separate line and infrastructure.
 Commuter rail usually uses of tracks, technology and standard
framework on the mainline of railroad network.
8
Differences between CR and other rail transport systems
Am!n SePehrNia – Commuter Rail System
• The Largest urban area in the world with approximately 31,200,000
people.
• The urban area covers 2030 square miles.
• 15,369 people per square mile.
• 15 billion rides are carried annually.
• One of the most successful world’s metropolis in public transport.
• The highest public transport market share among urban areas.
TOKYO-YOKOHAMA
9Am!n SePehrNia – Commuter Rail System
* Roughly 57 % of all travels in Tokyo are by public transport.
* The largest urban railway network in the world:
* The commuter rails and metro are completely integrated with each
other.
10
TOKYO-YOKOHAMA
*158 lines *48 operators
*4714.5 km operational tracks *2210 stations.
Am!n SePehrNia – Commuter Rail System
 The routes have extended about 1800 miles with more than 1200
stations based on 60 lines.
 All of these routes are owned to commuter trains system.
 (without sharing with freight trains).
 This system is completely profitable without any investment or
financing from government.
The Commuter Rail System in Tokyo
11Am!n SePehrNia – Commuter Rail System
 Commuter train feeds two of the word’s largest subway systems:
 Yokohama Subway System
 Chiba Monorail System.
 A kind of coordinating and cooperation in the railway services
that just belongs to Japan.
12
The Commuter Rail System in Tokyo
Am!n SePehrNia – Commuter Rail System
Reciprocal service on northern suburban line
(Tobu Isezaki Line-Tokyo)
13
 International Standard gauge 1435 mm has changed to 1067 mm.
Am!n SePehrNia – Commuter Rail System
 Commuter railway corporations have compact bus network that
feeds trains.
 The number of buses in these lines are estimated more than 5000
and this network is separated from common bus system .
 There are 0.61 commuter rail stations per square mile.
 1 station available for each 1.6 square miles of city area.
 “Yamanote” is a commuter route that has surrounded the central
business area with more than 4.2 million jobs.
14
The Commuter Train System in Tokyo
Am!n SePehrNia – Commuter Rail System
Distinctive Commuter Rail System in Tokyo
 Cooperation between companies that deliver public transport
services.
 Competing between companies that deliver suburban services.
 Applied technology in suburban railway
 Differentiation
 Diversity
 Accuracy and agility
 Profitability
in Service Delivery
16Am!n SePehrNia – Commuter Rail System
OSAKA-KOBE-KYOTO
Osaka with approximately 15,250,000 people is the second urban
area in japan.
 The urban area covers 1050 square miles.
 14,500 peoples per square mile.
 The second highest public transport ridership in the automotive
world with 6 billion annual Trips.
 Roughly 60 percent of all travels in Osaka are done by public
transport.
17Am!n SePehrNia – Commuter Rail System
 The high amount of public transport passengers are carried by
suburban railways.
 Osaka has more than 1000 miles route with more than 1000
stations based on 30 lines in commuter rail network.
 There are 1.01 commuter rail stations per square mile.
 It means the commuter trains are more accessible than Tokyo.
The Commuter Rail System in Osaka
18Am!n SePehrNia – Commuter Rail System
o The commuter rail system operates as a profitable enterprise
without any investment or financing from government.
o Railway private companies have prepared a dense and
connected network with more than 2500 bus that is separated
from common bus system.
o The commuter railways are connected with subway lines.
19
The Commuter Train System in Osaka
Am!n SePehrNia – Commuter Rail System
 Osaka Loop Line (21.7 km), which connects all subway lines,
and the two Hankai tramway lines.
 As is common with other Japanese metro systems, some lines
have a reciprocal service with suburban rail lines.
20Am!n SePehrNia – Commuter Rail System
Am!n SePehrNia – Commuter Rail System
NAGOYA
 Nagoya has approximately 8 million people.
 With population density less than Tokyo and Osaka and 7,400
peoples per square mile is the third largest urban area in Japan.
 The urban area covers 1090 square miles.
 Public transport market share for Nagoya is 25 percent.
 Half of it belongs to commuter rail system.
22Am!n SePehrNia – Commuter Rail System
 Suburban trains in Nagoya have 650 million passenger annually.
 Nagoya has a comprehensive commuter rail system with more
than 500 miles route and more than 800 stations based on 35 lines.
The Commuter Train System in Nagoya
23
 This system belongs to private sector that has about 800 buses
more over common bus system in city.
Am!n SePehrNia – Commuter Rail System
 In Nagoya there are 0.77 commuter rail stations per square mile.
 In each 1.3 mile, one station will be accessible.
 Like Osaka, Nagoya is more accessible than Tokyo.
 Nagoya commuter rail system is managed by private sector -
without any subsidies or financing from government.
The Commuter Train System in Nagoya
24Am!n SePehrNia – Commuter Rail System
 39 km Meitetsu Nagoya Railroad a private suburban rail
service, partly shared service on Tsurumai Subway Line.
8.5 km KinetsuKinki Nippon Railway (suburban) 5 km
Tokai Kotsu Jigyo.
25Am!n SePehrNia – Commuter Rail System
Am!n SePehrNia – Commuter Rail System
The success factors of commuter railway and public transport
Tokyo, Osaka and Nagoya
 Great development in public transport system before
widespread use of private Vehicles.
 The coordinated and integrated public transport system.
 Extended commuter railway.
 Connecting to bus network
 The higher speed of public transport system
 The high frequency of service delivery
27Am!n SePehrNia – Commuter Rail System
PARIS
 The Europe's largest public transport system.
 9,650,000 people and 9,100 density per square mile.
 24 % of travels in Paris are being done by public transport
system.
 One-quarter of passengers are carried by suburban trains.
 The main core of this system is local rapid trains network that
deliver services to suburbs.
28Am!n SePehrNia – Commuter Rail System
 The commuter railway system in Paris is expanded with more
than 1000 miles route on 40 lines and about 500 stations.
 In Paris there are 0.51 commuter rail station per square.
 In each 1.3 mile, one station will be accessible.
 The frequency of services are lower than Tokyo.
 between 0 to 12 percent of services are delivered every 5 minutes
out of rush hour.
The Commuter Train System in Paris
29Am!n SePehrNia – Commuter Rail System
Am!n SePehrNia – Commuter Rail System
London
 Greater London is home to some 12,200,000 people.
 London with 7600 population density per square mile, has the
second public transportation system in Europe.
 This system obtain roughly 19 % of travels in London.
 The main goal is deliver services to London commercial center
that has more than 1,300,000 jobs.
31Am!n SePehrNia – Commuter Rail System
o In London, commuter railway lines don’t follow into urban area.
o All travels which have done by commuter train, in suburbs
stations and by connecting to subway finish.
o About 20 percent of public transportation share, belongs to
commuter trains.
o 4 percent of all travels in London belongs to suburban trains.
The Commuter Train System in London
32Am!n SePehrNia – Commuter Rail System
Am!n SePehrNia – Commuter Rail System
 Commuter rail system in London includes 2260 miles routes
and 700 Stations on 40 lines.
 London commuter train, has 0.47 station per square mile.
 One station for each 2.1 square miles.
 The frequency of service delivery, is higher than Paris.
35
The Commuter Train System in London
SYDNEY
 Largest urban area in Australia.
 3.6 million people and 4,365 population density per square mile.
 The Sydney’s share of public transport is about 13.6 percent.
 It’s a high-share for a city with low population density.
 More than 1500 miles route and 300 CR stations on 15 lines.
 There are 0.38 station per square mile.
 One station for each 2.6 square miles.
36Am!n SePehrNia – Commuter Rail System
The Commuter Train System in Sydney
 41 percent of passengers in public transport services ride with
commuter trains.
 The central business district has nearly 10 percent of
employment in the area, whereas Parramatta region has about
1 percent of jobs but it has 30 percent work trips’ market share
in the public transport system.
37Am!n SePehrNia – Commuter Rail System
Table1. Demographic
Demography
TOKYO
OSAKA
NAGOYA
PARIS
LONDON
SYDNEY
Population
(Million)
31.2 15.25 8.05 9.65 12.23 3.6
Urban Area
(Square Miles)
2,030 1,050 1,090 1,060 1,600 811
Population Density
(Persons Per Square mile)
15,369 14,524 7,385 9,104 7,644 4,365
39Am!n SePehrNia – Commuter Rail System
Figure 1. Population
0
5,000
10,000
15,000
20,000
25,000
30,000
35,000
TOKYO OSAKA NAGOYA PARIS LONDON SYDNEY
31,200
15,250
8,050
9,650
12,230
3,593
Population (000)
40
Am!n SePehrNia – Commuter Rail System
Figure 2. Urban Area
2,030
1,050
1,090
1,060
1,600
811
Urban Area (Square Miles)
TOKYO OSAKA NAGOYA
PARIS LONDON SYDNEY
41
Am!n SePehrNia – Commuter Rail System
15,369
14,524
7,385
9,104
7,644
4,365
TOKYO
OSAKA
NAGOYA
PARIS
LONDON
SYDNEY
Population Density (Persons Per Square mile)
Figure 3. Population Density
42Am!n SePehrNia – Commuter Rail System
Table 2. Market Share
City
TOKYO
OSAKA
NAGOYA
PARIS
LONDON
SYDNEY
Public Transport 56.7% 59.5% 24.6% 24.1% 17.1% 13.6%
43
Commuter Rail 39.5% 36.4% 12.0% 7.2% 3.7% 5.6%
Am!n SePehrNia – Commuter Rail System
0.0%
10.0%
20.0%
30.0%
40.0%
50.0%
60.0%
TOKYO
OSAKA
NAGOYA
PARIS
LONDON
SYDNEY
56.7% 59.5%
24.6%
24.1%
17.1%
13.6%
Public Transport Market Share
Figure 4. Public Transport Market Share
44Am!n SePehrNia – Commuter Rail System
0.0%
10.0%
20.0%
30.0%
40.0%
TOKYO
OSAKA
NAGOYA
PARIS
LONDON
SYDNEY
39.5%
36.4%
12.0%
7.2%
3.7%
5.6%
Commuter Rail Market Share
Figure 5. Commuter Rail Market Share
45Am!n SePehrNia – Commuter Rail System
0.0%
10.0%
20.0%
30.0%
40.0%
50.0%
60.0%
TOKYO
OSAKA
NAGOYA
PARIS
LONDON
SYDNEY
39.5%
36.4%
12.0%
7.2%
3.7%
5.6%
56.7% 59.5%
24.6% 24.1%
17.1%
13.6%
Public Transport Market Share
Commuter Rail Market Share
Figure 6. Market Share
46Am!n SePehrNia – Commuter Rail System
Table 3. Commuter Rail system Factors
Commuter Rail System
TOKYO
OSAKA
NAGOYA
PARIS
LONDON
SYDNEY
47
Lines 60 30 35 40 40 15
Station Density 0.61 1.01 0.77 0.51 0.59 0.38
Number of Stations 1,243 1,065 843 540 940 306
Length of Route
(mile)
1,779 1,095 528 1,012 2,260 1,273
Am!n SePehrNia – Commuter Rail System
1,779
1,095
528
1,012
2,260
1,273
TOKYO OSAKA NAGOYA PARIS LONDON SYDNEY
LENGTH OF ROUTE (MILE)
Figure 7. Length of Routes
48
Am!n SePehrNia – Commuter Rail System
1,243
1,065
843
540
940
306
0
200
400
600
800
1,000
1,200
1,400
TOKYO OSAKA NAGOYA PARIS LONDON SYDNEY
Number of Stations
Figure 8. Number Of Stations
49
Am!n SePehrNia – Commuter Rail System
0.61
1.01
0.77
0.51
0.59
0.38
TOKYO
OSAKA
NAGOYA
PARIS
LONDON
SYDNEY
Station Density
Figure 9. Stations Density
50
(Per square Mile)
Am!n SePehrNia – Commuter Rail System
60
30
35
40 40
15
0
10
20
30
40
50
60
70
TOKYO OSAKA NAGOYA PARIS LONDON SYDNEY
LINES
Figure 10. Lines
51Am!n SePehrNia – Commuter Rail System
Table 4. Private Or Public Sector
Governmental Subsidy For
Operations
NO No NO Yes Yes Yes
Governmental Subsidy For
Investment
NO NO NO 100% 100% 100%
Lines Shared With Freight
Trains
NO NO NO
a Part of
System
a Part of
System
a Part of
System
Commuter Rail System
TOKYO
OSAKA
NAGOYA
PARIS
LONDON
SYDNEY
52Am!n SePehrNia – Commuter Rail System
Conclusion
 Tokyo, Osaka and Nagoya:
o Commuter rail system are profitable enterprises.
o They are being directed by private sectors completely.
o All public transport networks are connected to and integrated with
each other.
o Prepare Compact bus network moreover common bus networks.
o Public transport systems which developed and extended widely.
53Am!n SePehrNia – Commuter Rail System
Conclusion
Paris, London, Sydney:
 Commuter trains hadn’t attracted significant percent of
market share.
 They haven’t had productivity and acceptable performance in
their commuter rail systems.
54Am!n SePehrNia – Commuter Rail System
Conclusion
 Paris, London, Sydney:
o Inappropriate development in length of routes and the number
of stations and increase in use of private vehicles in these three
city especially London cause to:
I. Accessibility to commuter trains has decreased!
II. Market Share for CR has reduced significantly!
55Am!n SePehrNia – Commuter Rail System
In Life Every
One Must Move
On For The
Better
Thank you for your time and patience

Commuter Rail System

  • 1.
    Commuter Rail System AnAnalyze In Developed Countries Present: Amin SePehrNia
  • 2.
    Definitions and concepts Commuter rail is a public transport system in which delivers service to commuters.  Commuter lines normally extend an average of 50 miles from their downtown terminus.  Commuter train is a passenger train that is ridden mainly by passengers who travel regularly from one place to another. 2Am!n SePehrNia – Commuter Rail System
  • 3.
     The trainsare normally made up of a locomotive and a number of passenger coaches.  The coaches are dimensionally similar to intercity coaches, but typically have higher density seating as the average ride is shorter.  Commuter rail, also called suburban rail. 3 Definitions and concepts Am!n SePehrNia – Commuter Rail System
  • 4.
    Characteristics  Providing moreseating and less standing space, for the longer distances involved.  Having scheduled services.  Deliver services to lower-density suburban areas.  Having a lower frequency of service.  In ideal situation, trains run at high speed, they’re scheduled and they have minimum stops. 4Am!n SePehrNia – Commuter Rail System
  • 5.
    The scheduled Trains Commuter rail system has lower frequency in compare with rapid railway.  Instead of fixed times it follows scheduled programs.  Moreover fewer stations have separated with longer distances.  At first commuter rail, serves the suburbs with lower density and often shares its right with other rail transportation system. 5Am!n SePehrNia – Commuter Rail System
  • 6.
     In somecases services are only offered in rush hours.  In some cities, service is operated throughout the day and evening and on weekends.  The distance range of commuter trains varies between 15 to 200 kilometers. 6 The scheduled Trains Am!n SePehrNia – Commuter Rail System
  • 7.
    Differences between CRand other rail transport systems  Inter-city trains are more comfortable than commuter trains.  In inter-city train there are many spaces for passengers’ luggage.  As the most important thing in commuter train is“the number of seats”.  Generally commuter trains are optimized for maximum seats. 7Am!n SePehrNia – Commuter Rail System
  • 8.
     The “rapidtransport”  Normally covers the urban areas with higher trains frequency.  Runs in domain between 12 to 20 km  Serves on a separate line and infrastructure.  Commuter rail usually uses of tracks, technology and standard framework on the mainline of railroad network. 8 Differences between CR and other rail transport systems Am!n SePehrNia – Commuter Rail System
  • 9.
    • The Largesturban area in the world with approximately 31,200,000 people. • The urban area covers 2030 square miles. • 15,369 people per square mile. • 15 billion rides are carried annually. • One of the most successful world’s metropolis in public transport. • The highest public transport market share among urban areas. TOKYO-YOKOHAMA 9Am!n SePehrNia – Commuter Rail System
  • 10.
    * Roughly 57% of all travels in Tokyo are by public transport. * The largest urban railway network in the world: * The commuter rails and metro are completely integrated with each other. 10 TOKYO-YOKOHAMA *158 lines *48 operators *4714.5 km operational tracks *2210 stations. Am!n SePehrNia – Commuter Rail System
  • 11.
     The routeshave extended about 1800 miles with more than 1200 stations based on 60 lines.  All of these routes are owned to commuter trains system.  (without sharing with freight trains).  This system is completely profitable without any investment or financing from government. The Commuter Rail System in Tokyo 11Am!n SePehrNia – Commuter Rail System
  • 12.
     Commuter trainfeeds two of the word’s largest subway systems:  Yokohama Subway System  Chiba Monorail System.  A kind of coordinating and cooperation in the railway services that just belongs to Japan. 12 The Commuter Rail System in Tokyo Am!n SePehrNia – Commuter Rail System
  • 13.
    Reciprocal service onnorthern suburban line (Tobu Isezaki Line-Tokyo) 13  International Standard gauge 1435 mm has changed to 1067 mm. Am!n SePehrNia – Commuter Rail System
  • 14.
     Commuter railwaycorporations have compact bus network that feeds trains.  The number of buses in these lines are estimated more than 5000 and this network is separated from common bus system .  There are 0.61 commuter rail stations per square mile.  1 station available for each 1.6 square miles of city area.  “Yamanote” is a commuter route that has surrounded the central business area with more than 4.2 million jobs. 14 The Commuter Train System in Tokyo Am!n SePehrNia – Commuter Rail System
  • 16.
    Am!n SePehrNia –Commuter Rail System
  • 17.
    Distinctive Commuter RailSystem in Tokyo  Cooperation between companies that deliver public transport services.  Competing between companies that deliver suburban services.  Applied technology in suburban railway  Differentiation  Diversity  Accuracy and agility  Profitability in Service Delivery 16Am!n SePehrNia – Commuter Rail System
  • 18.
    OSAKA-KOBE-KYOTO Osaka with approximately15,250,000 people is the second urban area in japan.  The urban area covers 1050 square miles.  14,500 peoples per square mile.  The second highest public transport ridership in the automotive world with 6 billion annual Trips.  Roughly 60 percent of all travels in Osaka are done by public transport. 17Am!n SePehrNia – Commuter Rail System
  • 19.
     The highamount of public transport passengers are carried by suburban railways.  Osaka has more than 1000 miles route with more than 1000 stations based on 30 lines in commuter rail network.  There are 1.01 commuter rail stations per square mile.  It means the commuter trains are more accessible than Tokyo. The Commuter Rail System in Osaka 18Am!n SePehrNia – Commuter Rail System
  • 20.
    o The commuterrail system operates as a profitable enterprise without any investment or financing from government. o Railway private companies have prepared a dense and connected network with more than 2500 bus that is separated from common bus system. o The commuter railways are connected with subway lines. 19 The Commuter Train System in Osaka Am!n SePehrNia – Commuter Rail System
  • 21.
     Osaka LoopLine (21.7 km), which connects all subway lines, and the two Hankai tramway lines.  As is common with other Japanese metro systems, some lines have a reciprocal service with suburban rail lines. 20Am!n SePehrNia – Commuter Rail System
  • 23.
    Am!n SePehrNia –Commuter Rail System
  • 24.
    NAGOYA  Nagoya hasapproximately 8 million people.  With population density less than Tokyo and Osaka and 7,400 peoples per square mile is the third largest urban area in Japan.  The urban area covers 1090 square miles.  Public transport market share for Nagoya is 25 percent.  Half of it belongs to commuter rail system. 22Am!n SePehrNia – Commuter Rail System
  • 25.
     Suburban trainsin Nagoya have 650 million passenger annually.  Nagoya has a comprehensive commuter rail system with more than 500 miles route and more than 800 stations based on 35 lines. The Commuter Train System in Nagoya 23  This system belongs to private sector that has about 800 buses more over common bus system in city. Am!n SePehrNia – Commuter Rail System
  • 26.
     In Nagoyathere are 0.77 commuter rail stations per square mile.  In each 1.3 mile, one station will be accessible.  Like Osaka, Nagoya is more accessible than Tokyo.  Nagoya commuter rail system is managed by private sector - without any subsidies or financing from government. The Commuter Train System in Nagoya 24Am!n SePehrNia – Commuter Rail System
  • 27.
     39 kmMeitetsu Nagoya Railroad a private suburban rail service, partly shared service on Tsurumai Subway Line. 8.5 km KinetsuKinki Nippon Railway (suburban) 5 km Tokai Kotsu Jigyo. 25Am!n SePehrNia – Commuter Rail System
  • 28.
    Am!n SePehrNia –Commuter Rail System
  • 29.
    Am!n SePehrNia –Commuter Rail System
  • 30.
    The success factorsof commuter railway and public transport Tokyo, Osaka and Nagoya  Great development in public transport system before widespread use of private Vehicles.  The coordinated and integrated public transport system.  Extended commuter railway.  Connecting to bus network  The higher speed of public transport system  The high frequency of service delivery 27Am!n SePehrNia – Commuter Rail System
  • 31.
    PARIS  The Europe'slargest public transport system.  9,650,000 people and 9,100 density per square mile.  24 % of travels in Paris are being done by public transport system.  One-quarter of passengers are carried by suburban trains.  The main core of this system is local rapid trains network that deliver services to suburbs. 28Am!n SePehrNia – Commuter Rail System
  • 32.
     The commuterrailway system in Paris is expanded with more than 1000 miles route on 40 lines and about 500 stations.  In Paris there are 0.51 commuter rail station per square.  In each 1.3 mile, one station will be accessible.  The frequency of services are lower than Tokyo.  between 0 to 12 percent of services are delivered every 5 minutes out of rush hour. The Commuter Train System in Paris 29Am!n SePehrNia – Commuter Rail System
  • 33.
    Am!n SePehrNia –Commuter Rail System
  • 34.
    Am!n SePehrNia –Commuter Rail System
  • 35.
    London  Greater Londonis home to some 12,200,000 people.  London with 7600 population density per square mile, has the second public transportation system in Europe.  This system obtain roughly 19 % of travels in London.  The main goal is deliver services to London commercial center that has more than 1,300,000 jobs. 31Am!n SePehrNia – Commuter Rail System
  • 36.
    o In London,commuter railway lines don’t follow into urban area. o All travels which have done by commuter train, in suburbs stations and by connecting to subway finish. o About 20 percent of public transportation share, belongs to commuter trains. o 4 percent of all travels in London belongs to suburban trains. The Commuter Train System in London 32Am!n SePehrNia – Commuter Rail System
  • 37.
    Am!n SePehrNia –Commuter Rail System
  • 40.
     Commuter railsystem in London includes 2260 miles routes and 700 Stations on 40 lines.  London commuter train, has 0.47 station per square mile.  One station for each 2.1 square miles.  The frequency of service delivery, is higher than Paris. 35 The Commuter Train System in London
  • 41.
    SYDNEY  Largest urbanarea in Australia.  3.6 million people and 4,365 population density per square mile.  The Sydney’s share of public transport is about 13.6 percent.  It’s a high-share for a city with low population density.  More than 1500 miles route and 300 CR stations on 15 lines.  There are 0.38 station per square mile.  One station for each 2.6 square miles. 36Am!n SePehrNia – Commuter Rail System
  • 42.
    The Commuter TrainSystem in Sydney  41 percent of passengers in public transport services ride with commuter trains.  The central business district has nearly 10 percent of employment in the area, whereas Parramatta region has about 1 percent of jobs but it has 30 percent work trips’ market share in the public transport system. 37Am!n SePehrNia – Commuter Rail System
  • 44.
    Table1. Demographic Demography TOKYO OSAKA NAGOYA PARIS LONDON SYDNEY Population (Million) 31.2 15.258.05 9.65 12.23 3.6 Urban Area (Square Miles) 2,030 1,050 1,090 1,060 1,600 811 Population Density (Persons Per Square mile) 15,369 14,524 7,385 9,104 7,644 4,365 39Am!n SePehrNia – Commuter Rail System
  • 45.
    Figure 1. Population 0 5,000 10,000 15,000 20,000 25,000 30,000 35,000 TOKYOOSAKA NAGOYA PARIS LONDON SYDNEY 31,200 15,250 8,050 9,650 12,230 3,593 Population (000) 40 Am!n SePehrNia – Commuter Rail System
  • 46.
    Figure 2. UrbanArea 2,030 1,050 1,090 1,060 1,600 811 Urban Area (Square Miles) TOKYO OSAKA NAGOYA PARIS LONDON SYDNEY 41 Am!n SePehrNia – Commuter Rail System
  • 47.
    15,369 14,524 7,385 9,104 7,644 4,365 TOKYO OSAKA NAGOYA PARIS LONDON SYDNEY Population Density (PersonsPer Square mile) Figure 3. Population Density 42Am!n SePehrNia – Commuter Rail System
  • 48.
    Table 2. MarketShare City TOKYO OSAKA NAGOYA PARIS LONDON SYDNEY Public Transport 56.7% 59.5% 24.6% 24.1% 17.1% 13.6% 43 Commuter Rail 39.5% 36.4% 12.0% 7.2% 3.7% 5.6% Am!n SePehrNia – Commuter Rail System
  • 49.
    0.0% 10.0% 20.0% 30.0% 40.0% 50.0% 60.0% TOKYO OSAKA NAGOYA PARIS LONDON SYDNEY 56.7% 59.5% 24.6% 24.1% 17.1% 13.6% Public TransportMarket Share Figure 4. Public Transport Market Share 44Am!n SePehrNia – Commuter Rail System
  • 50.
    0.0% 10.0% 20.0% 30.0% 40.0% TOKYO OSAKA NAGOYA PARIS LONDON SYDNEY 39.5% 36.4% 12.0% 7.2% 3.7% 5.6% Commuter Rail MarketShare Figure 5. Commuter Rail Market Share 45Am!n SePehrNia – Commuter Rail System
  • 51.
    0.0% 10.0% 20.0% 30.0% 40.0% 50.0% 60.0% TOKYO OSAKA NAGOYA PARIS LONDON SYDNEY 39.5% 36.4% 12.0% 7.2% 3.7% 5.6% 56.7% 59.5% 24.6% 24.1% 17.1% 13.6% PublicTransport Market Share Commuter Rail Market Share Figure 6. Market Share 46Am!n SePehrNia – Commuter Rail System
  • 52.
    Table 3. CommuterRail system Factors Commuter Rail System TOKYO OSAKA NAGOYA PARIS LONDON SYDNEY 47 Lines 60 30 35 40 40 15 Station Density 0.61 1.01 0.77 0.51 0.59 0.38 Number of Stations 1,243 1,065 843 540 940 306 Length of Route (mile) 1,779 1,095 528 1,012 2,260 1,273 Am!n SePehrNia – Commuter Rail System
  • 53.
    1,779 1,095 528 1,012 2,260 1,273 TOKYO OSAKA NAGOYAPARIS LONDON SYDNEY LENGTH OF ROUTE (MILE) Figure 7. Length of Routes 48 Am!n SePehrNia – Commuter Rail System
  • 54.
    1,243 1,065 843 540 940 306 0 200 400 600 800 1,000 1,200 1,400 TOKYO OSAKA NAGOYAPARIS LONDON SYDNEY Number of Stations Figure 8. Number Of Stations 49 Am!n SePehrNia – Commuter Rail System
  • 55.
    0.61 1.01 0.77 0.51 0.59 0.38 TOKYO OSAKA NAGOYA PARIS LONDON SYDNEY Station Density Figure 9.Stations Density 50 (Per square Mile) Am!n SePehrNia – Commuter Rail System
  • 56.
    60 30 35 40 40 15 0 10 20 30 40 50 60 70 TOKYO OSAKANAGOYA PARIS LONDON SYDNEY LINES Figure 10. Lines 51Am!n SePehrNia – Commuter Rail System
  • 57.
    Table 4. PrivateOr Public Sector Governmental Subsidy For Operations NO No NO Yes Yes Yes Governmental Subsidy For Investment NO NO NO 100% 100% 100% Lines Shared With Freight Trains NO NO NO a Part of System a Part of System a Part of System Commuter Rail System TOKYO OSAKA NAGOYA PARIS LONDON SYDNEY 52Am!n SePehrNia – Commuter Rail System
  • 58.
    Conclusion  Tokyo, Osakaand Nagoya: o Commuter rail system are profitable enterprises. o They are being directed by private sectors completely. o All public transport networks are connected to and integrated with each other. o Prepare Compact bus network moreover common bus networks. o Public transport systems which developed and extended widely. 53Am!n SePehrNia – Commuter Rail System
  • 59.
    Conclusion Paris, London, Sydney: Commuter trains hadn’t attracted significant percent of market share.  They haven’t had productivity and acceptable performance in their commuter rail systems. 54Am!n SePehrNia – Commuter Rail System
  • 60.
    Conclusion  Paris, London,Sydney: o Inappropriate development in length of routes and the number of stations and increase in use of private vehicles in these three city especially London cause to: I. Accessibility to commuter trains has decreased! II. Market Share for CR has reduced significantly! 55Am!n SePehrNia – Commuter Rail System
  • 61.
    In Life Every OneMust Move On For The Better Thank you for your time and patience