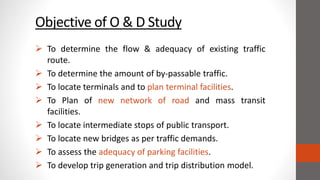
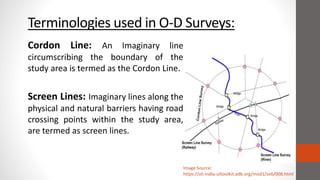
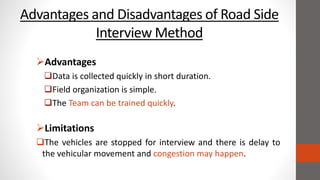
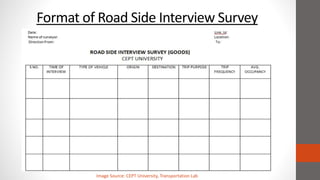
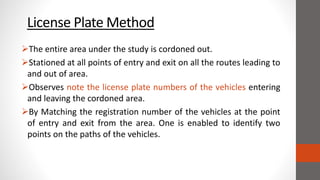
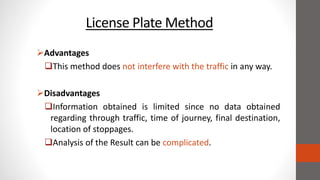
TRANSPORTATION PLANNING (TR-603) PRESENTATION
TOPIC:- ORIGIN & DESTINATION SURVEY
SUBMITTED BY:
AKASH KUMAR
202111818
MTech (GI)
MAULANA AZAD NATIONAL INSTITUTE OF
TECHNOLOGY (MANIT), BHOPAL (MP)
SUBMITTED TO:
Dr. PRITIKANA DAS
Index
Introduction
Objectives
Information Required for OD Study
O-D Survey Types
Methodology
Road Side Interview Method
License Plate Method
Return Post Card Method
Tag on-Car method
Home Interview Method
OD Matrix
Presentation of OD Data
Desire Line and Flow Line Diagram
Conclusion
Reference
O-D Survey
Introduction
 OD studies are conducted to understand the pattern
of the movement of persons and goods in a particular
area of interest during a particular period of time.
 These surveys collect household characteristics of the
trip making family, time of the day when journey’s are
made, trip purpose and mode of travel
Objective of O & D Study
 To determine the flow & adequacy of existing traffic
route.
 To determine the amount of by-passable traffic.
 To locate terminals and to plan terminal facilities.
 To Plan of new network of road and mass transit
facilities.
 To locate intermediate stops of public transport.
 To locate new bridges as per traffic demands.
 To assess the adequacy of parking facilities.
 To develop trip generation and trip distribution model.
Terminologies used in O-D Surveys:
Image Source:
https://sti-india-uttoolkit.adb.org/mod1/se6/008.html
Cordon Line: An Imaginary line
circumscribing the boundary of the
study area is termed as the Cordon Line.
Screen Lines: Imaginary lines along the
physical and natural barriers having road
crossing points within the study area,
are termed as screen lines.
OD Survey Types
 Over Rural Roads
 For solving freight related issues and problems,
 Focusing on tonnage rather than trip length.
 Type of Goods is also observed. (flammable or inflammable).
 Over Urban Roads
 For solving Public related issues and problems.
 Focusing on Trip length rather than tonnage.
 Purpose of trip is also observed here.
Information Required
 Where travelers are coming from
 Where trip makers are going to
 Purpose of Trip
 Mode of Travel
 Trip Length
 Trip Cost
 Travel Time
 Other Socio-economic data
Image Source:
http://www.cs.sjtu.edu.cn/~yzhu/nrl/projects.htm
Methods of
Conducting O
& D Study
License
Plate
Tag on
Car
Return
Post Card
Home
Interview
Road
Side
Interview
O & D Survey Methods
Road Side Interview Method
 Vehicles Are stopped And
Interview with prescribed
questionnaire
 The Survey points are selected
along the junction of the cordon-
line or screen-line with the roads.
 For dual carriageways (few traffic)
both direction is dealt
simultaneously.
DatatobeCollected
Place & Time of Origin
Place & Time of
Destination
Route
Purpose of the Trip
Types of Vehicles
Numbers of Passengers
in each vehicle
Road Side Interview Survey
Image Source: www.trafficwatchuk.co.uk
Advantages and Disadvantages of Road Side
Interview Method
Advantages
Data is collected quickly in short duration.
Field organization is simple.
The Team can be trained quickly.
Limitations
The vehicles are stopped for interview and there is delay to
the vehicular movement and congestion may happen.
Format of Road Side Interview Survey
Image Source: CEPT University, Transportation Lab
License Plate Method
The entire area under the study is cordoned out.
Stationed at all points of entry and exit on all the routes leading to
and out of area.
Observes note the license plate numbers of the vehicles entering
and leaving the cordoned area.
By Matching the registration number of the vehicles at the point
of entry and exit from the area. One is enabled to identify two
points on the paths of the vehicles.
Automatic License Plate Method
ImageSource:https://www.accu-traffic.ca/
License Plate Method
Advantages
This method does not interfere with the traffic in any way.
Disadvantages
Information obtained is limited since no data obtained
regarding through traffic, time of journey, final destination,
location of stoppages.
Analysis of the Result can be complicated.
Return Post Card Method
In this method reply-paid questionnaires are handed over
to the drivers at the survey points and requesting to all of the
drivers to complete the information and return it by post.
Advantages
This method are simpler and cheaper than many others.
This method avoids delay caused to the drivers.
Disadvantages
Reponses may not a good.
Format of Return Post Card Method
Chart Source: https://firstmonday.org/ojs/index.php/fm/article/view/1402/1320
Tag on-Car Method
In this Method, each point where road
cross the cordon line, vehicles are
stopped & a tag is fixed and Removed at
exit points.
Different survey stations have different
Tag shapes and color to identify the
survey stations.
The time of entering and leaving the
area may be marked on the tags in
order to enable the journey times to be
determined.
Image Source: https://www.truebil.com/blog/how-
to-get-use-recharge-check-the-balance-in-fast-tags
Home Interview Method
Sample size of 0.5 to 10% of the population is
selected & trained person visit their residence
to collect the travel data.
Detailed information is obtained on the spot.
The data collected is useful for road planning
network and other road facilities.
Number of Trip Made
Their Origin & Destination
Purpose of Trip
Travel Mode
Number of Residents
Age
Sex
Vehicle Ownership
Number of Drivers
Family Income
Source: http://www.tools4dev.org/resources/how-to-choose-a-sample-size/
Advantages:
The problem of stopping of
vehicles and consequent
difficulties are avoided
The present travel needs are
clearly known and the analysis is
also simple.
Limitations:
Limited sample size.
Manual Data entry may increase
time and error.
Cost will be high.
ImageSource:
http://www.helpingyoucare.com/19572/
Other Methods for O-D Survey Data
Commercial Vehicle
Survey
Public Transport
Survey
Telephonic
Survey
Online (Web-Based)
Survey
Image Source:
https://in.pinterest.com/
OD Matrix
OD Matrix are the most common way to define demand for
simulation.
It is a two way table giving the connectivity in Peak Hour Peak
Direction Trips (PHPDT) between two areas.
In each cell of the matrix the demand for the specific Origin-
Destination pair (OD pair) is given
Uses
OD Matrix is used for Junction measures.:-
oRotary- <= 6000
oSignal- > 6000
oFlyover > 12000.
To Calculate the potential of Public transport in the study area.
Presentation of Origin and Destination Data
-OD Matrix
Table Source: https://docs.lib.purdue.edu/cgi/viewcontent.cgi?article=1716
Desire Line Diagram (DLD)
Desire Lines are used to illustrate on a map the flows of
people or goods from point to point based on the values
from a matrix
Thickness of line shows more traffic at the location
High line weight = More number of trips.
Trip rates show the number of traffic/people movements in
and out of a development (or an average of a number of
developments within the same land use category), for a given
trip rate parameter factor
Desire Line Charts
Image Source: https://www.mapping-tools.com%2Fhowto%2Fmaptitude%2Fanalysis-tools%2Fdesire-lines%
Flow and Desire Line Diagram
Source: https://www.ptamarin.com%2Fmaps%2Fpages%2Ftraffic-flow-map.html/
Conclusion
Origin-Destination (OD) studies are an important tool for
transportation Professionals. OD studies are conducted to
understand the pattern of the movement of Persons and Goods in a
particular area of interest during a particular period of time.
Used for many purpose like to determine the extent to which the
present highway system is adequate and plan for new facilities.
Data provided may useful in Extra widening of carriage width & if
flyover or underpass should be provided
We’ll know if movement of heavy commercial vehicles should be
avoided at day time and allowed at night time.
Alteration of signal timing during peak hour period.
Software’s like CUBE, AUTOCAD can be used for statistical analysis.
Reference
1. Transport Planning and Traffic Engineering, CA O'Flaherty, MGH Bell
& PW Bonsall (BH Publication)
2. https://www.youtube.com/watch?v=kddbZMp7FuQ (YouTube
Channel- WIT Solapur - Professional Learning Community)
3. https://www.slideshare.net/kezangkl11/orgin-destination-survey
4. https://www.coursehero.com/file/p54kidi/Methods-of-conducting-
Origin-Destination-surveys-1-Roadside-interviews-RSI/
5. https://www.researchgate.net/publication/228647109_Characterist
ics_of_Web-based_surveys_and_applications_in_travel_research
6. NPTEL: https://nptel.ac.in/courses/105/107/105107067/
Origin & destination survey

Origin & destination survey

  • 1.
    TRANSPORTATION PLANNING (TR-603)PRESENTATION TOPIC:- ORIGIN & DESTINATION SURVEY SUBMITTED BY: AKASH KUMAR 202111818 MTech (GI) MAULANA AZAD NATIONAL INSTITUTE OF TECHNOLOGY (MANIT), BHOPAL (MP) SUBMITTED TO: Dr. PRITIKANA DAS
  • 2.
    Index Introduction Objectives Information Required forOD Study O-D Survey Types Methodology Road Side Interview Method License Plate Method Return Post Card Method Tag on-Car method Home Interview Method OD Matrix Presentation of OD Data Desire Line and Flow Line Diagram Conclusion Reference
  • 3.
    O-D Survey Introduction  ODstudies are conducted to understand the pattern of the movement of persons and goods in a particular area of interest during a particular period of time.  These surveys collect household characteristics of the trip making family, time of the day when journey’s are made, trip purpose and mode of travel
  • 4.
    Objective of O& D Study  To determine the flow & adequacy of existing traffic route.  To determine the amount of by-passable traffic.  To locate terminals and to plan terminal facilities.  To Plan of new network of road and mass transit facilities.  To locate intermediate stops of public transport.  To locate new bridges as per traffic demands.  To assess the adequacy of parking facilities.  To develop trip generation and trip distribution model.
  • 5.
    Terminologies used inO-D Surveys: Image Source: https://sti-india-uttoolkit.adb.org/mod1/se6/008.html Cordon Line: An Imaginary line circumscribing the boundary of the study area is termed as the Cordon Line. Screen Lines: Imaginary lines along the physical and natural barriers having road crossing points within the study area, are termed as screen lines.
  • 6.
    OD Survey Types Over Rural Roads  For solving freight related issues and problems,  Focusing on tonnage rather than trip length.  Type of Goods is also observed. (flammable or inflammable).  Over Urban Roads  For solving Public related issues and problems.  Focusing on Trip length rather than tonnage.  Purpose of trip is also observed here.
  • 7.
    Information Required  Wheretravelers are coming from  Where trip makers are going to  Purpose of Trip  Mode of Travel  Trip Length  Trip Cost  Travel Time  Other Socio-economic data Image Source: http://www.cs.sjtu.edu.cn/~yzhu/nrl/projects.htm
  • 8.
    Methods of Conducting O &D Study License Plate Tag on Car Return Post Card Home Interview Road Side Interview O & D Survey Methods
  • 9.
    Road Side InterviewMethod  Vehicles Are stopped And Interview with prescribed questionnaire  The Survey points are selected along the junction of the cordon- line or screen-line with the roads.  For dual carriageways (few traffic) both direction is dealt simultaneously. DatatobeCollected Place & Time of Origin Place & Time of Destination Route Purpose of the Trip Types of Vehicles Numbers of Passengers in each vehicle
  • 10.
    Road Side InterviewSurvey Image Source: www.trafficwatchuk.co.uk
  • 11.
    Advantages and Disadvantagesof Road Side Interview Method Advantages Data is collected quickly in short duration. Field organization is simple. The Team can be trained quickly. Limitations The vehicles are stopped for interview and there is delay to the vehicular movement and congestion may happen.
  • 12.
    Format of RoadSide Interview Survey Image Source: CEPT University, Transportation Lab
  • 13.
    License Plate Method Theentire area under the study is cordoned out. Stationed at all points of entry and exit on all the routes leading to and out of area. Observes note the license plate numbers of the vehicles entering and leaving the cordoned area. By Matching the registration number of the vehicles at the point of entry and exit from the area. One is enabled to identify two points on the paths of the vehicles.
  • 14.
    Automatic License PlateMethod ImageSource:https://www.accu-traffic.ca/
  • 15.
    License Plate Method Advantages Thismethod does not interfere with the traffic in any way. Disadvantages Information obtained is limited since no data obtained regarding through traffic, time of journey, final destination, location of stoppages. Analysis of the Result can be complicated.
  • 16.
    Return Post CardMethod In this method reply-paid questionnaires are handed over to the drivers at the survey points and requesting to all of the drivers to complete the information and return it by post. Advantages This method are simpler and cheaper than many others. This method avoids delay caused to the drivers. Disadvantages Reponses may not a good.
  • 17.
    Format of ReturnPost Card Method Chart Source: https://firstmonday.org/ojs/index.php/fm/article/view/1402/1320
  • 18.
    Tag on-Car Method Inthis Method, each point where road cross the cordon line, vehicles are stopped & a tag is fixed and Removed at exit points. Different survey stations have different Tag shapes and color to identify the survey stations. The time of entering and leaving the area may be marked on the tags in order to enable the journey times to be determined. Image Source: https://www.truebil.com/blog/how- to-get-use-recharge-check-the-balance-in-fast-tags
  • 19.
    Home Interview Method Samplesize of 0.5 to 10% of the population is selected & trained person visit their residence to collect the travel data. Detailed information is obtained on the spot. The data collected is useful for road planning network and other road facilities. Number of Trip Made Their Origin & Destination Purpose of Trip Travel Mode Number of Residents Age Sex Vehicle Ownership Number of Drivers Family Income Source: http://www.tools4dev.org/resources/how-to-choose-a-sample-size/
  • 20.
    Advantages: The problem ofstopping of vehicles and consequent difficulties are avoided The present travel needs are clearly known and the analysis is also simple. Limitations: Limited sample size. Manual Data entry may increase time and error. Cost will be high. ImageSource: http://www.helpingyoucare.com/19572/
  • 21.
    Other Methods forO-D Survey Data Commercial Vehicle Survey Public Transport Survey Telephonic Survey Online (Web-Based) Survey Image Source: https://in.pinterest.com/
  • 22.
    OD Matrix OD Matrixare the most common way to define demand for simulation. It is a two way table giving the connectivity in Peak Hour Peak Direction Trips (PHPDT) between two areas. In each cell of the matrix the demand for the specific Origin- Destination pair (OD pair) is given Uses OD Matrix is used for Junction measures.:- oRotary- <= 6000 oSignal- > 6000 oFlyover > 12000. To Calculate the potential of Public transport in the study area.
  • 23.
    Presentation of Originand Destination Data -OD Matrix Table Source: https://docs.lib.purdue.edu/cgi/viewcontent.cgi?article=1716
  • 24.
    Desire Line Diagram(DLD) Desire Lines are used to illustrate on a map the flows of people or goods from point to point based on the values from a matrix Thickness of line shows more traffic at the location High line weight = More number of trips. Trip rates show the number of traffic/people movements in and out of a development (or an average of a number of developments within the same land use category), for a given trip rate parameter factor
  • 25.
    Desire Line Charts ImageSource: https://www.mapping-tools.com%2Fhowto%2Fmaptitude%2Fanalysis-tools%2Fdesire-lines%
  • 26.
    Flow and DesireLine Diagram Source: https://www.ptamarin.com%2Fmaps%2Fpages%2Ftraffic-flow-map.html/
  • 27.
    Conclusion Origin-Destination (OD) studiesare an important tool for transportation Professionals. OD studies are conducted to understand the pattern of the movement of Persons and Goods in a particular area of interest during a particular period of time. Used for many purpose like to determine the extent to which the present highway system is adequate and plan for new facilities. Data provided may useful in Extra widening of carriage width & if flyover or underpass should be provided We’ll know if movement of heavy commercial vehicles should be avoided at day time and allowed at night time. Alteration of signal timing during peak hour period. Software’s like CUBE, AUTOCAD can be used for statistical analysis.
  • 28.
    Reference 1. Transport Planningand Traffic Engineering, CA O'Flaherty, MGH Bell & PW Bonsall (BH Publication) 2. https://www.youtube.com/watch?v=kddbZMp7FuQ (YouTube Channel- WIT Solapur - Professional Learning Community) 3. https://www.slideshare.net/kezangkl11/orgin-destination-survey 4. https://www.coursehero.com/file/p54kidi/Methods-of-conducting- Origin-Destination-surveys-1-Roadside-interviews-RSI/ 5. https://www.researchgate.net/publication/228647109_Characterist ics_of_Web-based_surveys_and_applications_in_travel_research 6. NPTEL: https://nptel.ac.in/courses/105/107/105107067/