5-Modal Split & Traffic Assignment-( Transportation and Traffic Engineering Dr. Sheriff El-Badawy )
•
19 likes•6,504 views

The document discusses modal split and traffic assignment in transportation planning. It defines modal split as the process of separating trips by travel mode, usually expressed as a percentage of total trips. Traffic assignment involves allocating trips between zones to routes in the transportation network. Common traffic assignment methods include all-or-nothing assignment, which assigns all trips to the shortest route, and capacity restraint, which considers road capacity. The document provides examples of calculating modal split using a utility function and performing all-or-nothing traffic assignment on a sample network.

Recommended
More Related Content
What's hot
What's hot (20)
Viewers also liked
Viewers also liked (20)
Similar to 5-Modal Split & Traffic Assignment-( Transportation and Traffic Engineering Dr. Sheriff El-Badawy )
Similar to 5-Modal Split & Traffic Assignment-( Transportation and Traffic Engineering Dr. Sheriff El-Badawy ) (20)
More from Hossam Shafiq I
More from Hossam Shafiq I (20)
Recently uploaded
Recently uploaded (20)
5-Modal Split & Traffic Assignment-( Transportation and Traffic Engineering Dr. Sheriff El-Badawy )
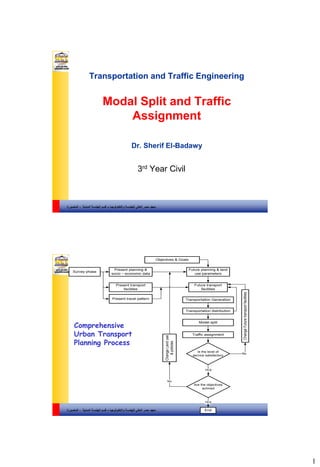
- 1. 1 والتكنولوجيا للهندسة العالي مصر معهد–المدنية الهندسة قسم-المنصورة Dr. Sherif El-Badawy 3rd Year Civil Transportation and Traffic Engineering Modal Split and Traffic Assignment والتكنولوجيا للهندسة العالي مصر معهد–المدنية الهندسة قسم-المنصورة Objectives & Goals Future planning & land use parameters Future transport facilities Transportation Generation Transportation distribution Model split Traffic assignment Is the level of service satisfactory Are the objectives achived YES YES No ChangeFuturetransportfacilities No ChangeLanduse &policies Present planning & socio – economic data Present transport facilities Present travel pattern End Survey phase Comprehensive Urban Transport Planning Process
- 2. 2 والتكنولوجيا للهندسة العالي مصر معهد–المدنية الهندسة قسم-المنصورة 3 Modal Split Definition: • Is the process of separating person-trips by the mode of travel. • Usually expressed as a fraction, ratio, or percentage of the total number of trips. والتكنولوجيا للهندسة العالي مصر معهد–المدنية الهندسة قسم-المنصورة 4 Characteristics of the trip Trip purpose, trip length. Household Characteristics Income, Car ownership, family size and composition. Zonal Characteristics Residential density, concentration of workers, distance from CBD. Network Characteristics Accessibility ratio, travel time ratio, travel cost ratio. Factors Affecting Modal Split
- 3. 3 والتكنولوجيا للهندسة العالي مصر معهد–المدنية الهندسة قسم-المنصورة 5 Mode choice depends on: • Travel time (in Vehicle + waiting) • Travel cost • Socio-economic status of user (income, family size,….) • Level of travel service (comfort, Safety, speed, ……..) The variable defining the model is a function called the Utility Function والتكنولوجيا للهندسة العالي مصر معهد–المدنية الهندسة قسم-المنصورة 6 Utility Function (Multi-Nomial Logit function) P%(m) = the probability of choosing mode (m) of transportation e = exponential base um = the utility function of different modes if we assume an urban area with bus, car and taxi modes % for bus mode will be: % for car mode will be: % for Taxi mode will be:
- 4. 4 والتكنولوجيا للهندسة العالي مصر معهد–المدنية الهندسة قسم-المنصورة 7 Utility Function The general utility function is usually of the form: Where: Km = mode specific constant tm = in vehicle time (minutes-one way) xm = out of vehicle time (minutes-one way) d = distance (miles - one way) cm = cost (piasters - one way) Y= annual income (pounds) m is A for Auto, B for Bus, T for Taxi, t for train والتكنولوجيا للهندسة العالي مصر معهد–المدنية الهندسة قسم-المنصورة 8 Considering a user choosing between two modes an auto and a public Bus considering the following situation: If d was 7 miles. And it is also given that the annual income of the user is 3000 pounds. BusAuto tB= 14 mintA= 11 min xB = 8 minxA = 5 min cB = 50 piasterscA = 122 piasters Example And his value parameters as collected from data collection are: K1 = -0.03 k2 = -0.34 k3 = -50 The values of the mode specific constants are assumed to be kA = -0.13 kB = zero
- 5. 5 والتكنولوجيا للهندسة العالي مصر معهد–المدنية الهندسة قسم-المنصورة 9 Solution uA = -0.13 – 0.03 (11) - 0.34 (5/7) -50 (122/3000) = -0.13 – 0.33 - 0.243 – 2.03 = -2.74 uB = 0 – 0.03 (14) - 0.34 (8/7) -50 (50/3000) = 0 – 0.42 – 0.39 – 0.83 = -1.64 P%A = 25% and in the same way we get P%B = 75% BusAuto tB= 14 mintA= 11 min xB = 8 minxA = 5 min cB = 50cA = 122 kB =-0kA =-0.13 k1 = -0.03 k2 = -0.34 k3 = -50 والتكنولوجيا للهندسة العالي مصر معهد–المدنية الهندسة قسم-المنصورة Review (Modal Split) (Traffic Assignment )
- 6. 6 والتكنولوجيا للهندسة العالي مصر معهد–المدنية الهندسة قسم-المنصورة Which route will be chosen by the user? والتكنولوجيا للهندسة العالي مصر معهد–المدنية الهندسة قسم-المنصورة 12 Traffic Assignment Definition: is the stage in the transportation planning process where in the trip interchanges are allocated to different parts of the network forming the transportation system. In this stage: i. The route to be travelled is determined. ii. The inter-zonal flows are assigned to the selected routs.
- 7. 7 والتكنولوجيا للهندسة العالي مصر معهد–المدنية الهندسة قسم-المنصورة 13 General principals • All assignment techniques are based on route selection. • The choice of the route is made on the basis of a number of criteria as Journey time, length, cost, comfort, convenience, safety. (Travel Resistance) • Journey time is often considered the sole criterion since length and cost can be considered as a function of time in most cases. والتكنولوجيا للهندسة العالي مصر معهد–المدنية الهندسة قسم-المنصورة 14 Transport Link As a first step, the highway network is described by a system of links and nodes. A link is a section of a highway network between two intersections. A node is either a centroid of a zone or the intersection of two or more links.
- 8. 8 والتكنولوجيا للهندسة العالي مصر معهد–المدنية الهندسة قسم-المنصورة Link-Node Map for Highway System والتكنولوجيا للهندسة العالي مصر معهد–المدنية الهندسة قسم-المنصورة 16 Traffic Assignment Methods All or Nothing Capacity Restraint
- 9. 9 والتكنولوجيا للهندسة العالي مصر معهد–المدنية الهندسة قسم-المنصورة 17 All or Nothing Method Most commonly used method. Example: Minimum Path Tree All traffic will choose the route where the travel resistance is least. Travel Resistance: • Time • Distance • Cost • Generalized Cost والتكنولوجيا للهندسة العالي مصر معهد–المدنية الهندسة قسم-المنصورة 18 22 2523 24 26 15 11 18 19 20 21 16 12 17 1 13 14 (4) (4) (2) (2) (2) (2) (2) (2) (2) (2) (2) (1) (1) (1) (5) (3) (3) (3) (3)(3) (5) (5) Example (3)
- 10. 10 والتكنولوجيا للهندسة العالي مصر معهد–المدنية الهندسة قسم-المنصورة 19 Starting from centroid 1 we go to each connecting link and choose the least travel time T1-20 = 3 T1-17 = 3 the time is the same , if we begin with the node with lower number node 17 is noted: T1-17-19 = 5 T1-17-16 = 5 T1-17-16 = 6 The next closest node to centroid 1 is 20 T1-20-19 = 4 T1-20-25 = 6 T1-20-21 = 7 There are two routes to reach 19 from centroid 1, i.e. 1-17-19 and 1-20-19. the rout 1-20-19 is shorter in time, therefore is chosen والتكنولوجيا للهندسة العالي مصر معهد–المدنية الهندسة قسم-المنصورة 20 22 2523 24 26 15 11 18 19 20 21 16 12 17 1 13 14 (4) (4) (2) (2) (2) (2) (2) (2) (2) (2) (2) (1) (1) (1) (5) (3) (3) (3) (3)(3) (5) (5) The process is repeated until all nodes have been covered by the shortest path. The minimum path tree for this highway network is given in figure (3)
- 11. 11 والتكنولوجيا للهندسة العالي مصر معهد–المدنية الهندسة قسم-المنصورة All or Nothing Assignment: • All trips are assigned on the shortest route which is the minimum travel time, cost, distance, …..between zones. • Simple and inexpensive to perform. • Does not take into account the effect of traffic congestion: • Assumes there is no travel time change due to increased traffic. • Flow patterns could be unrealistic. • Can be used for special cases (under saturated traffic, ..etc) والتكنولوجيا للهندسة العالي مصر معهد–المدنية الهندسة قسم-المنصورة 1 2 3 4 5 6 7 8 9 10 11 12 14 15 1613 631 232 334 444 132 1 132 1 242 1 Find the shortest path from node 1 to all other nodes (from Garber and Hoel) Yellow numbers represent link travel times in minutes3 Here’ s how …
- 12. 12 والتكنولوجيا للهندسة العالي مصر معهد–المدنية الهندسة قسم-المنصورة 1 2 3 4 5 6 7 8 9 10 11 12 14 15 1613 631 232 334 444 132 1 132 1 242 1 STEP 1 1 2 والتكنولوجيا للهندسة العالي مصر معهد–المدنية الهندسة قسم-المنصورة 1 2 3 4 5 6 7 8 9 10 11 12 14 15 1613 631 232 334 444 132 1 132 1 242 1 STEP 2 1 2 4 5
- 13. 13 والتكنولوجيا للهندسة العالي مصر معهد–المدنية الهندسة قسم-المنصورة 1 2 3 4 5 6 7 8 9 10 11 12 14 15 1613 631 232 334 444 132 1 132 1 242 1 STEP 3 1 2 4 5 4 4 والتكنولوجيا للهندسة العالي مصر معهد–المدنية الهندسة قسم-المنصورة 1 2 3 4 5 6 7 8 9 10 11 12 14 15 1613 631 232 334 444 132 1 132 1 242 1 STEP 4 1 2 4 4 Eliminate 5 >= 4 4 5
- 14. 14 والتكنولوجيا للهندسة العالي مصر معهد–المدنية الهندسة قسم-المنصورة 1 2 3 4 5 6 7 8 9 10 11 12 14 15 1613 631 232 334 444 132 1 132 1 242 1 STEP 5 1 2 4 4 4 10 6 والتكنولوجيا للهندسة العالي مصر معهد–المدنية الهندسة قسم-المنصورة 1 2 3 4 5 6 7 8 9 10 11 12 14 15 1613 631 232 334 444 132 1 132 1 242 1 STEP 6 1 2 4 4 4 1 0 6 7 Eliminate 7 >= 6 7
- 15. 15 والتكنولوجيا للهندسة العالي مصر معهد–المدنية الهندسة قسم-المنصورة 6 1 2 3 4 5 6 7 8 9 10 11 12 14 15 1613 631 232 334 444 132 1 132 1 242 1 STEP 7 1 2 4 4 4 1 0 6 Eliminate 8 >= 7 8 7 والتكنولوجيا للهندسة العالي مصر معهد–المدنية الهندسة قسم-المنصورة 7 8 6 1 2 3 4 5 6 7 8 9 10 11 12 14 15 1613 631 232 334 444 132 1 132 1 242 1 STEP 8 1 2 4 4 4 1 0 7 6
- 16. 16 والتكنولوجيا للهندسة العالي مصر معهد–المدنية الهندسة قسم-المنصورة 1 0 7 8 6 1 2 3 4 5 6 7 8 9 10 11 12 14 15 1613 631 232 334 444 132 1 132 1 242 1 STEP 9 1 2 4 4 4 1 0 7 6 والتكنولوجيا للهندسة العالي مصر معهد–المدنية الهندسة قسم-المنصورة 1 0 7 8 6 1 2 3 4 5 6 7 8 9 10 11 12 14 15 1613 631 232 334 444 132 1 132 1 242 1 STEP 10 1 2 4 4 4 1 0 7 6 1 0Eliminate 10 >= 7 1 0 Eliminate 10 >= 10
- 17. 17 والتكنولوجيا للهندسة العالي مصر معهد–المدنية الهندسة قسم-المنصورة 7 8 6 1 2 3 4 5 6 7 8 9 10 11 12 14 15 1613 631 232 334 444 132 1 132 1 242 1 STEP 11 1 2 4 4 4 10 7 6 10 1 0 8 والتكنولوجيا للهندسة العالي مصر معهد–المدنية الهندسة قسم-المنصورة 7 8 6 1 2 3 4 5 6 7 8 9 10 11 12 14 15 1613 631 232 334 444 132 1 132 1 242 1 STEP 12 1 2 4 4 4 10 7 6 1 0 8 9 91 0 Eliminate 10 > 9 Eliminate 10 >= 9
- 18. 18 والتكنولوجيا للهندسة العالي مصر معهد–المدنية الهندسة قسم-المنصورة 7 8 6 1 2 3 4 5 6 7 8 9 10 11 12 14 15 1613 631 232 334 444 132 1 132 1 242 1 STEP 13 1 2 4 4 4 7 6 10 8 9 9 12 12 Eliminate 12 >= 10 والتكنولوجيا للهندسة العالي مصر معهد–المدنية الهندسة قسم-المنصورة 7 8 6 1 2 3 4 5 6 7 8 9 10 11 12 14 15 1613 631 232 334 444 132 1 132 1 242 1 STEP 14 1 2 4 4 4 7 6 10 8 9 9 12 10 Eliminate 12 >= 10
- 19. 19 والتكنولوجيا للهندسة العالي مصر معهد–المدنية الهندسة قسم-المنصورة 7 8 6 1 2 3 4 5 6 7 8 9 10 11 12 14 15 1613 FINAL 1 2 4 4 4 7 6 10 8 9 9 10 والتكنولوجيا للهندسة العالي مصر معهد–المدنية الهندسة قسم-المنصورة 38 Capacity Restraint Method • Capacity restraint assignment is a process in which the travel resistance of a link is increased according to a relation between the practical capacity of the link and the volumes assigned to the link. • Because of the iterative nature of the calculations involved, the capacity restrained method is carried out entirely by computer.
- 20. 20 والتكنولوجيا للهندسة العالي مصر معهد–المدنية الهندسة قسم-المنصورة 39 Capacity Restraint Techniques Smock Method Bureau of Public Roads Method Where: To original travel time TA adjusted travel time e exponential base V assigned volume C link capacity والتكنولوجيا للهندسة العالي مصر معهد–المدنية الهندسة قسم-المنصورة 40 DHV = k * ADT Where DHV = Design Hourly Volume k = Constant called Peak hour factor ADT = Average Daily traffic We get the required number of lanes according to the Design Hourly Volume from the equation No of lanes = DHV ÷ Lane capacity