Download as PDF, PPTX

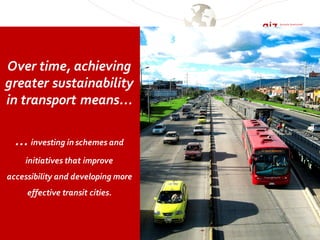
![€€€190001500-
2000
Mixed
Traffic
€€
40000 –
60000
Heavy Rail/
Metro
€€€€€
€€€€€
€€€€€
€€€€€
€€€€€
€€€€€
€€€€€
€€€€€
€€€€€
€€€€€
€€€€€
€€€€€
€€€€€
€€€€€
€€€€€
€€€€€
€€€€€
€€€€€
€€€€€
€€€€€
€€€€€
€€€€€
€€€€€
€€€€€
€€€€€
€€€€€
€€€€€
€€€€€
€€€€€
€€€€€
€€€€€
€€€€€
€€€€€
€€€€€
€€€€€
€€€€€
60000 –
90000
Suburban
Rail
(e.g. Mumbai)
€
€€€
€€€
€€€
€€€
€€€
€€€
14000
€€
€€€
€€€
€€€
€€€
Cyclists
€€
€€€
€€€
€€€
€€€
€€€
9000
BRT
single lane
Pedestrians
5000
€€€
€€€
€€€
Regular
Bus
??
BRT
double lane
€
€€€€
€€€€
€€€€
€€€€
€€€€
€€€€
€€€€
€€€€
€€€€
€€€€
€€€€
Light Rail
€
€€€
€€€
€€€
€€€
€€€
€€€
€€€
18000 –
20000
(people per hour on 3.5 m wide lane in the city – PPHPD [PAX/hour/direction])
Source: Botma & Papendrecht, TU Delft 1991 andown figures
PPHPD
Range (à)
80000,
HKK
Maximum
PPHPD
achieved&
where (à)](https://image.slidesharecdn.com/01changingcourseinurbantransportmb-4-151008185221-lva1-app6891/85/Changing-course-in-urban-transport-28-320.jpg)

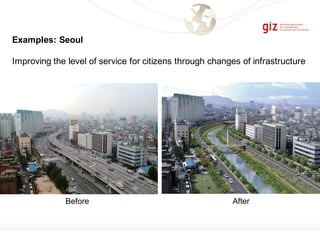
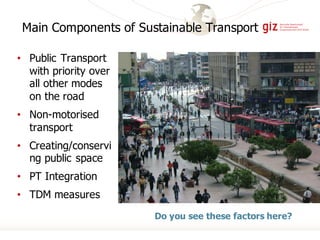
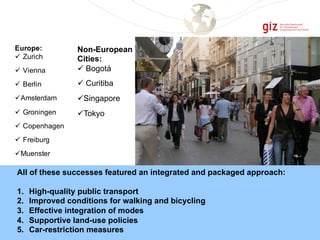
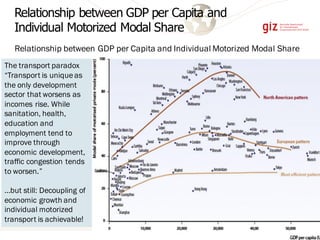

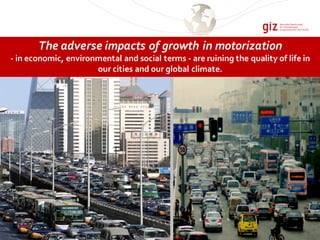
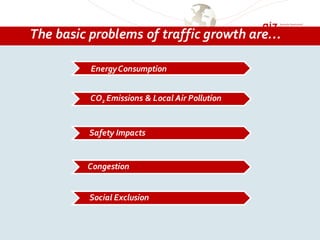
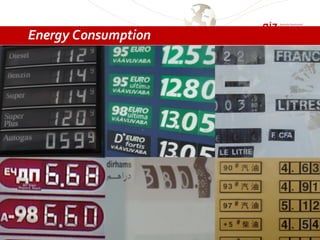
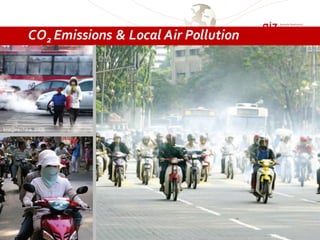
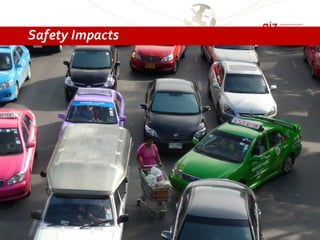
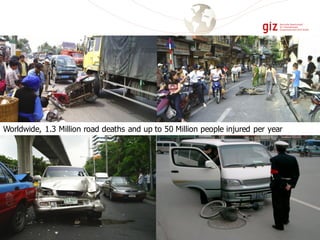
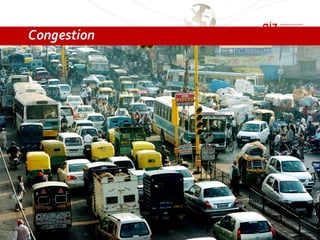
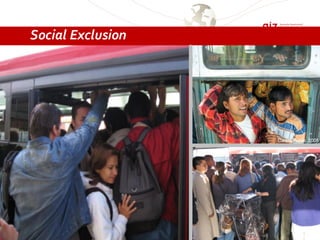
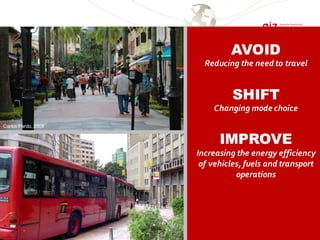
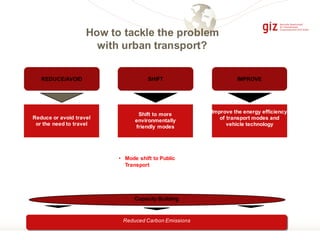
The document discusses sustainable urban transport and improving quality of life in cities. It notes that rapid motorization has negatively impacted cities economically, environmentally, and socially. The main problems are listed as energy consumption, emissions, safety issues, congestion, and social exclusion. Solutions proposed include improving transport efficiency, shifting modes to public transit and non-motorized options like walking and cycling, and reducing or avoiding travel. Examples given of successful cities emphasize high quality public transit integrated with land use planning and policies supporting alternatives to private vehicles.


![[Urban transportation policy program]city paper presentation guangzhou 2](https://cdn.slidesharecdn.com/ss_thumbnails/urbantransportationpolicyprogramcitypaperpresentationguangzhou2-160407030511-thumbnail.jpg?width=640&height=640&fit=bounds)


