This document discusses probability distributions and key concepts related to discrete random variables including:
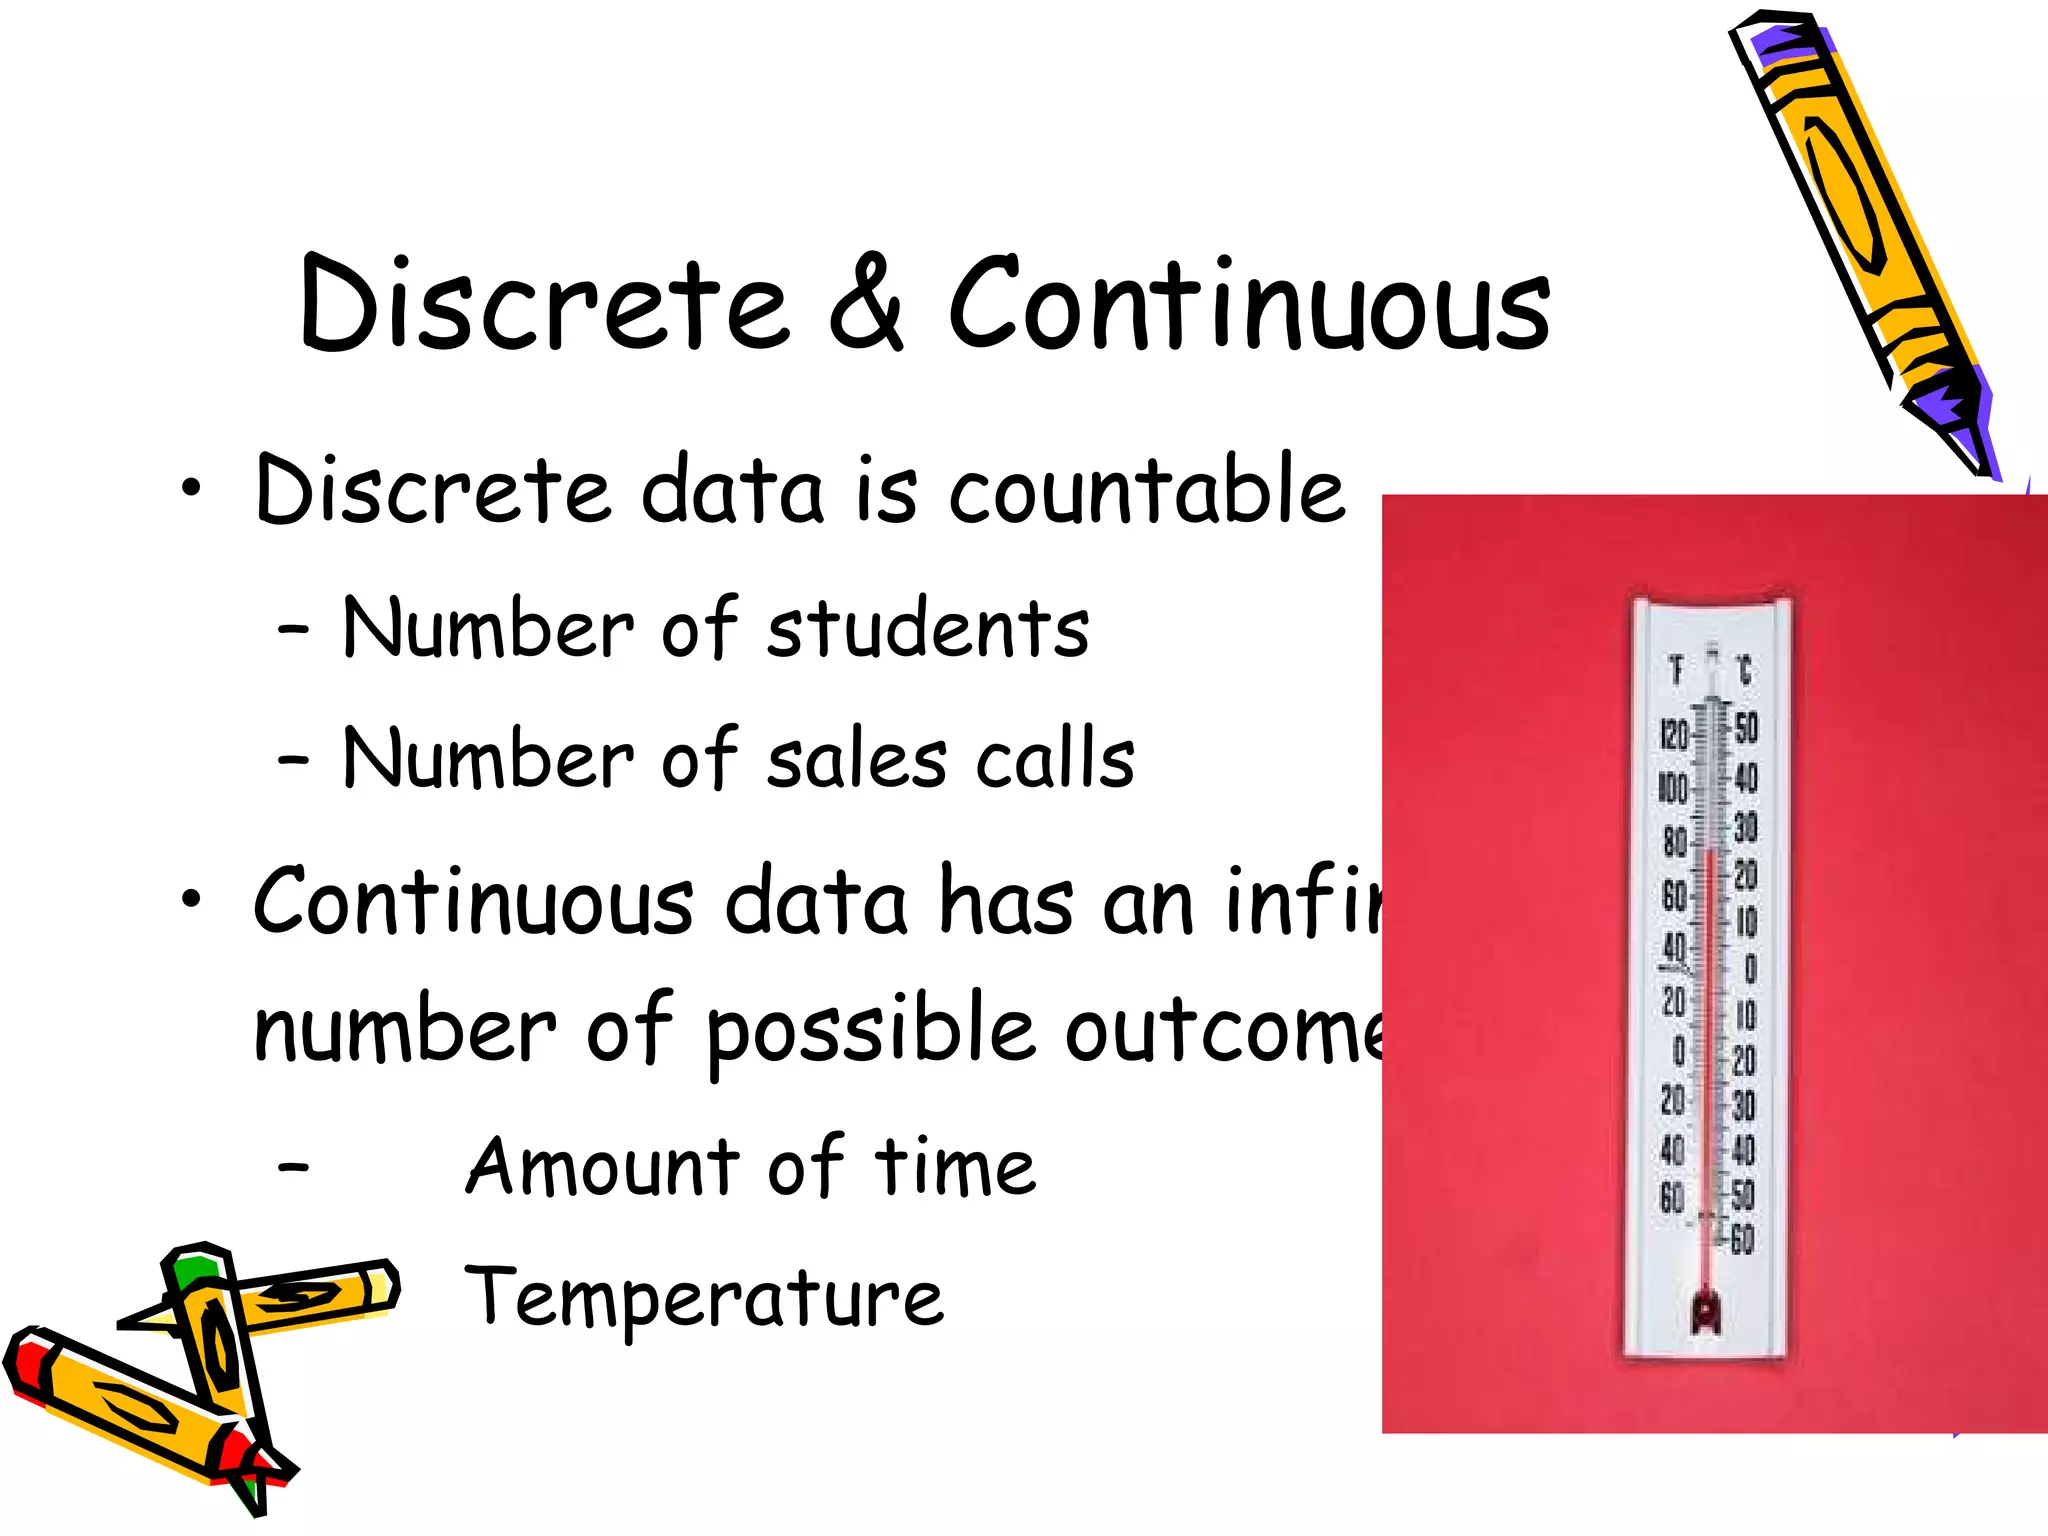
- Distinguishing between discrete and continuous random variables
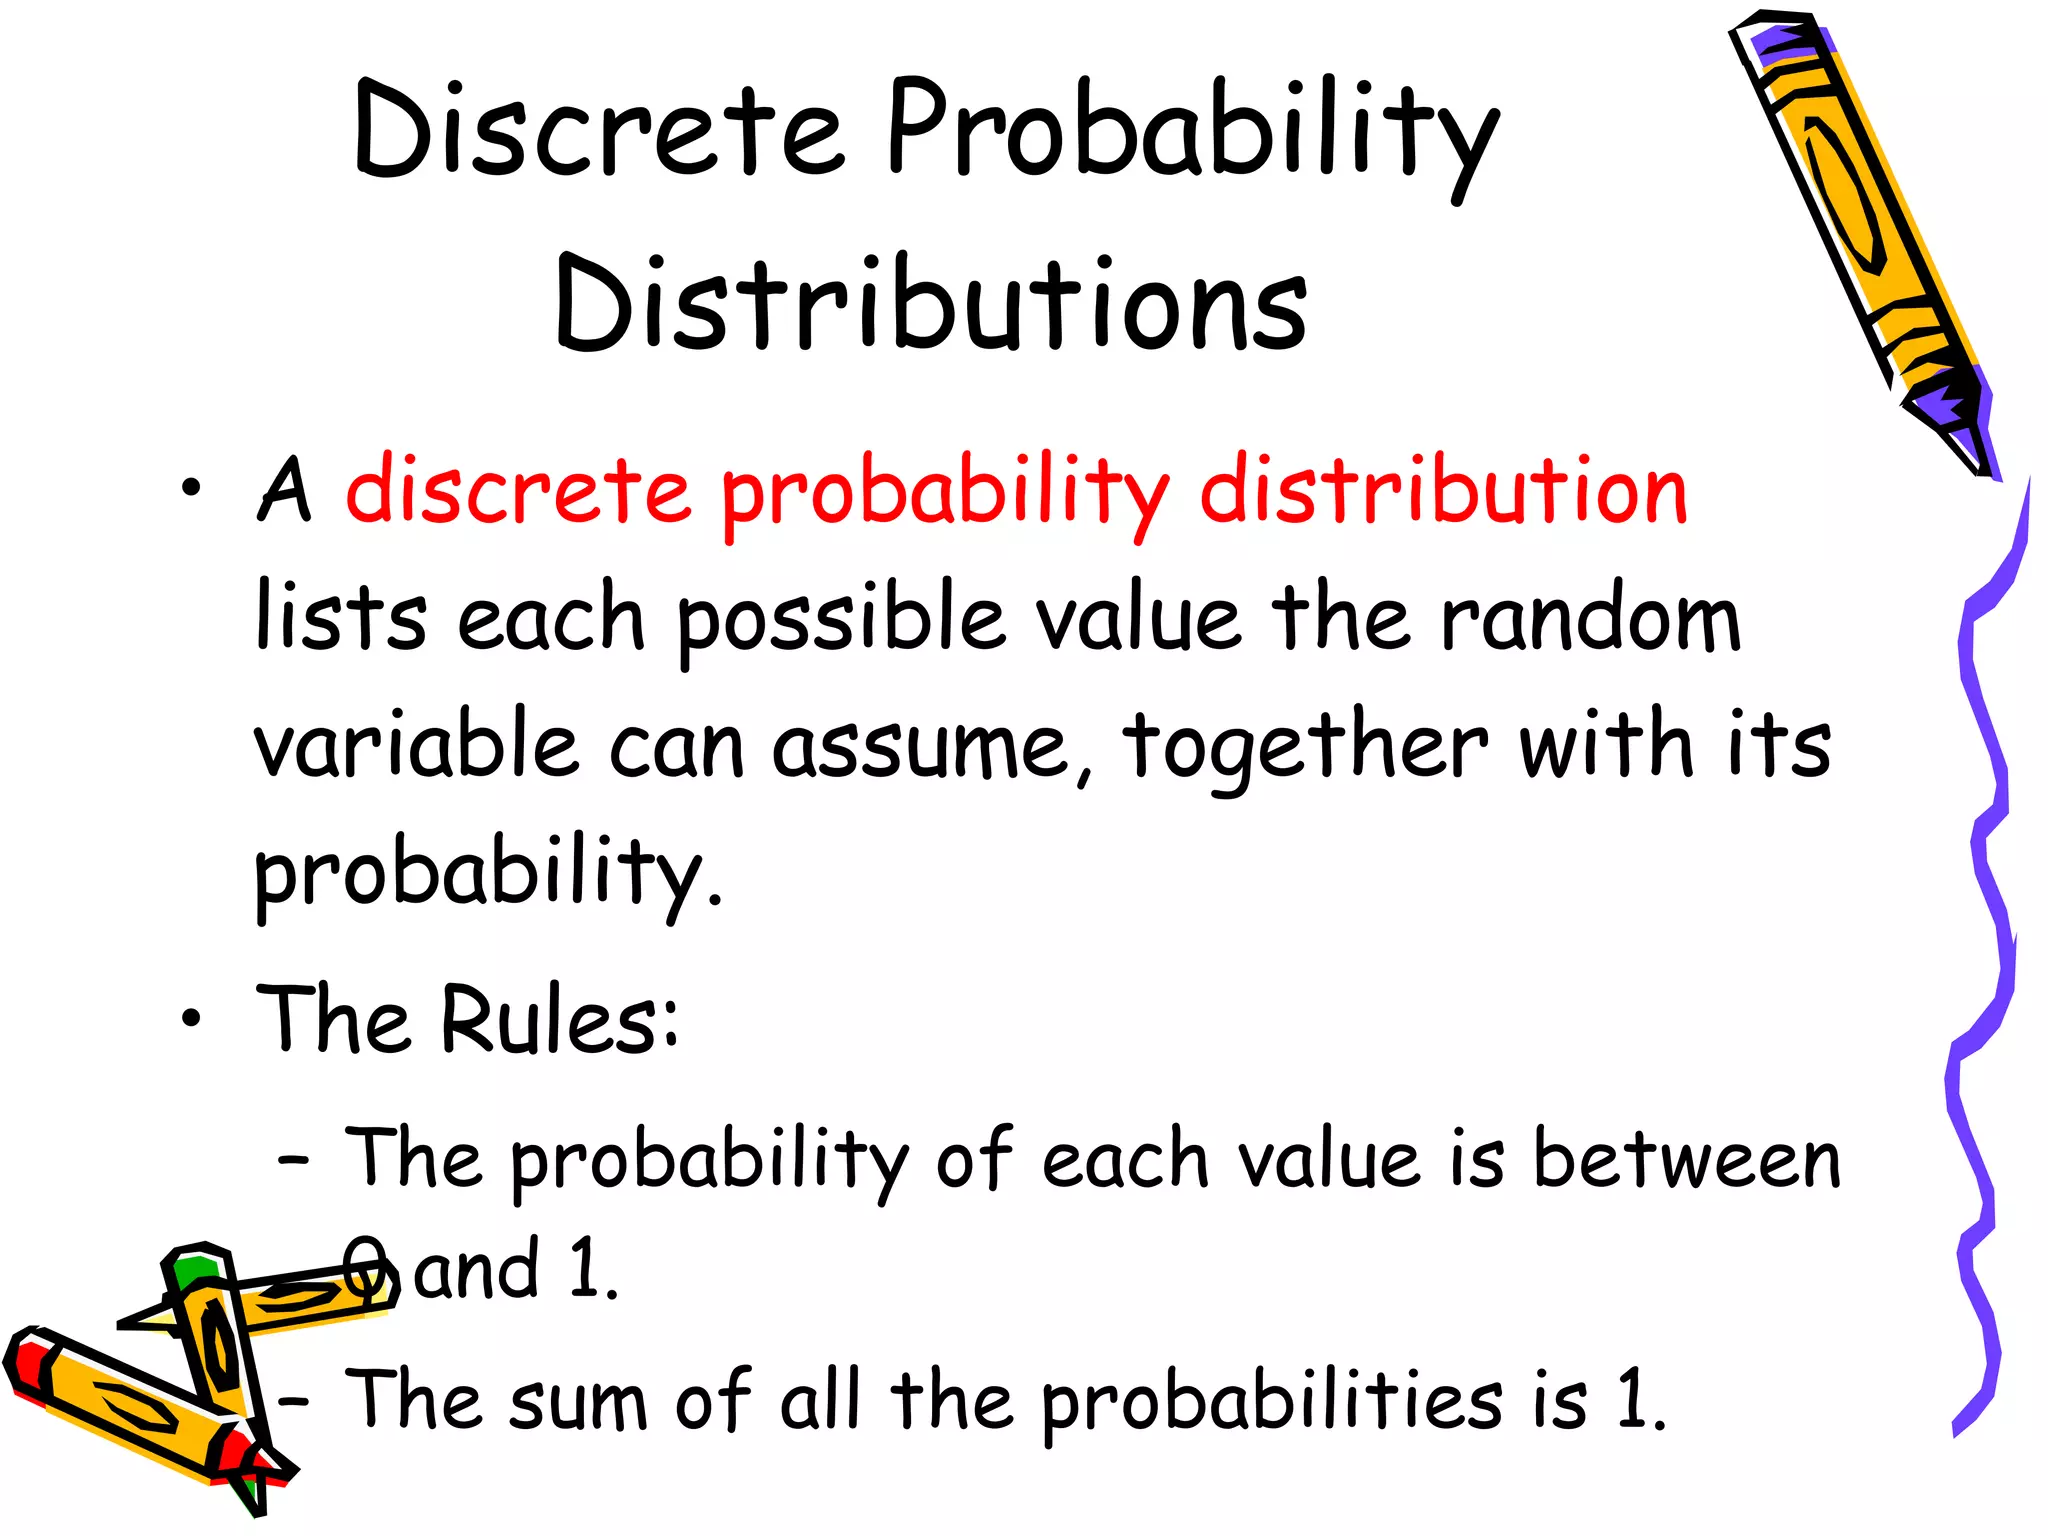
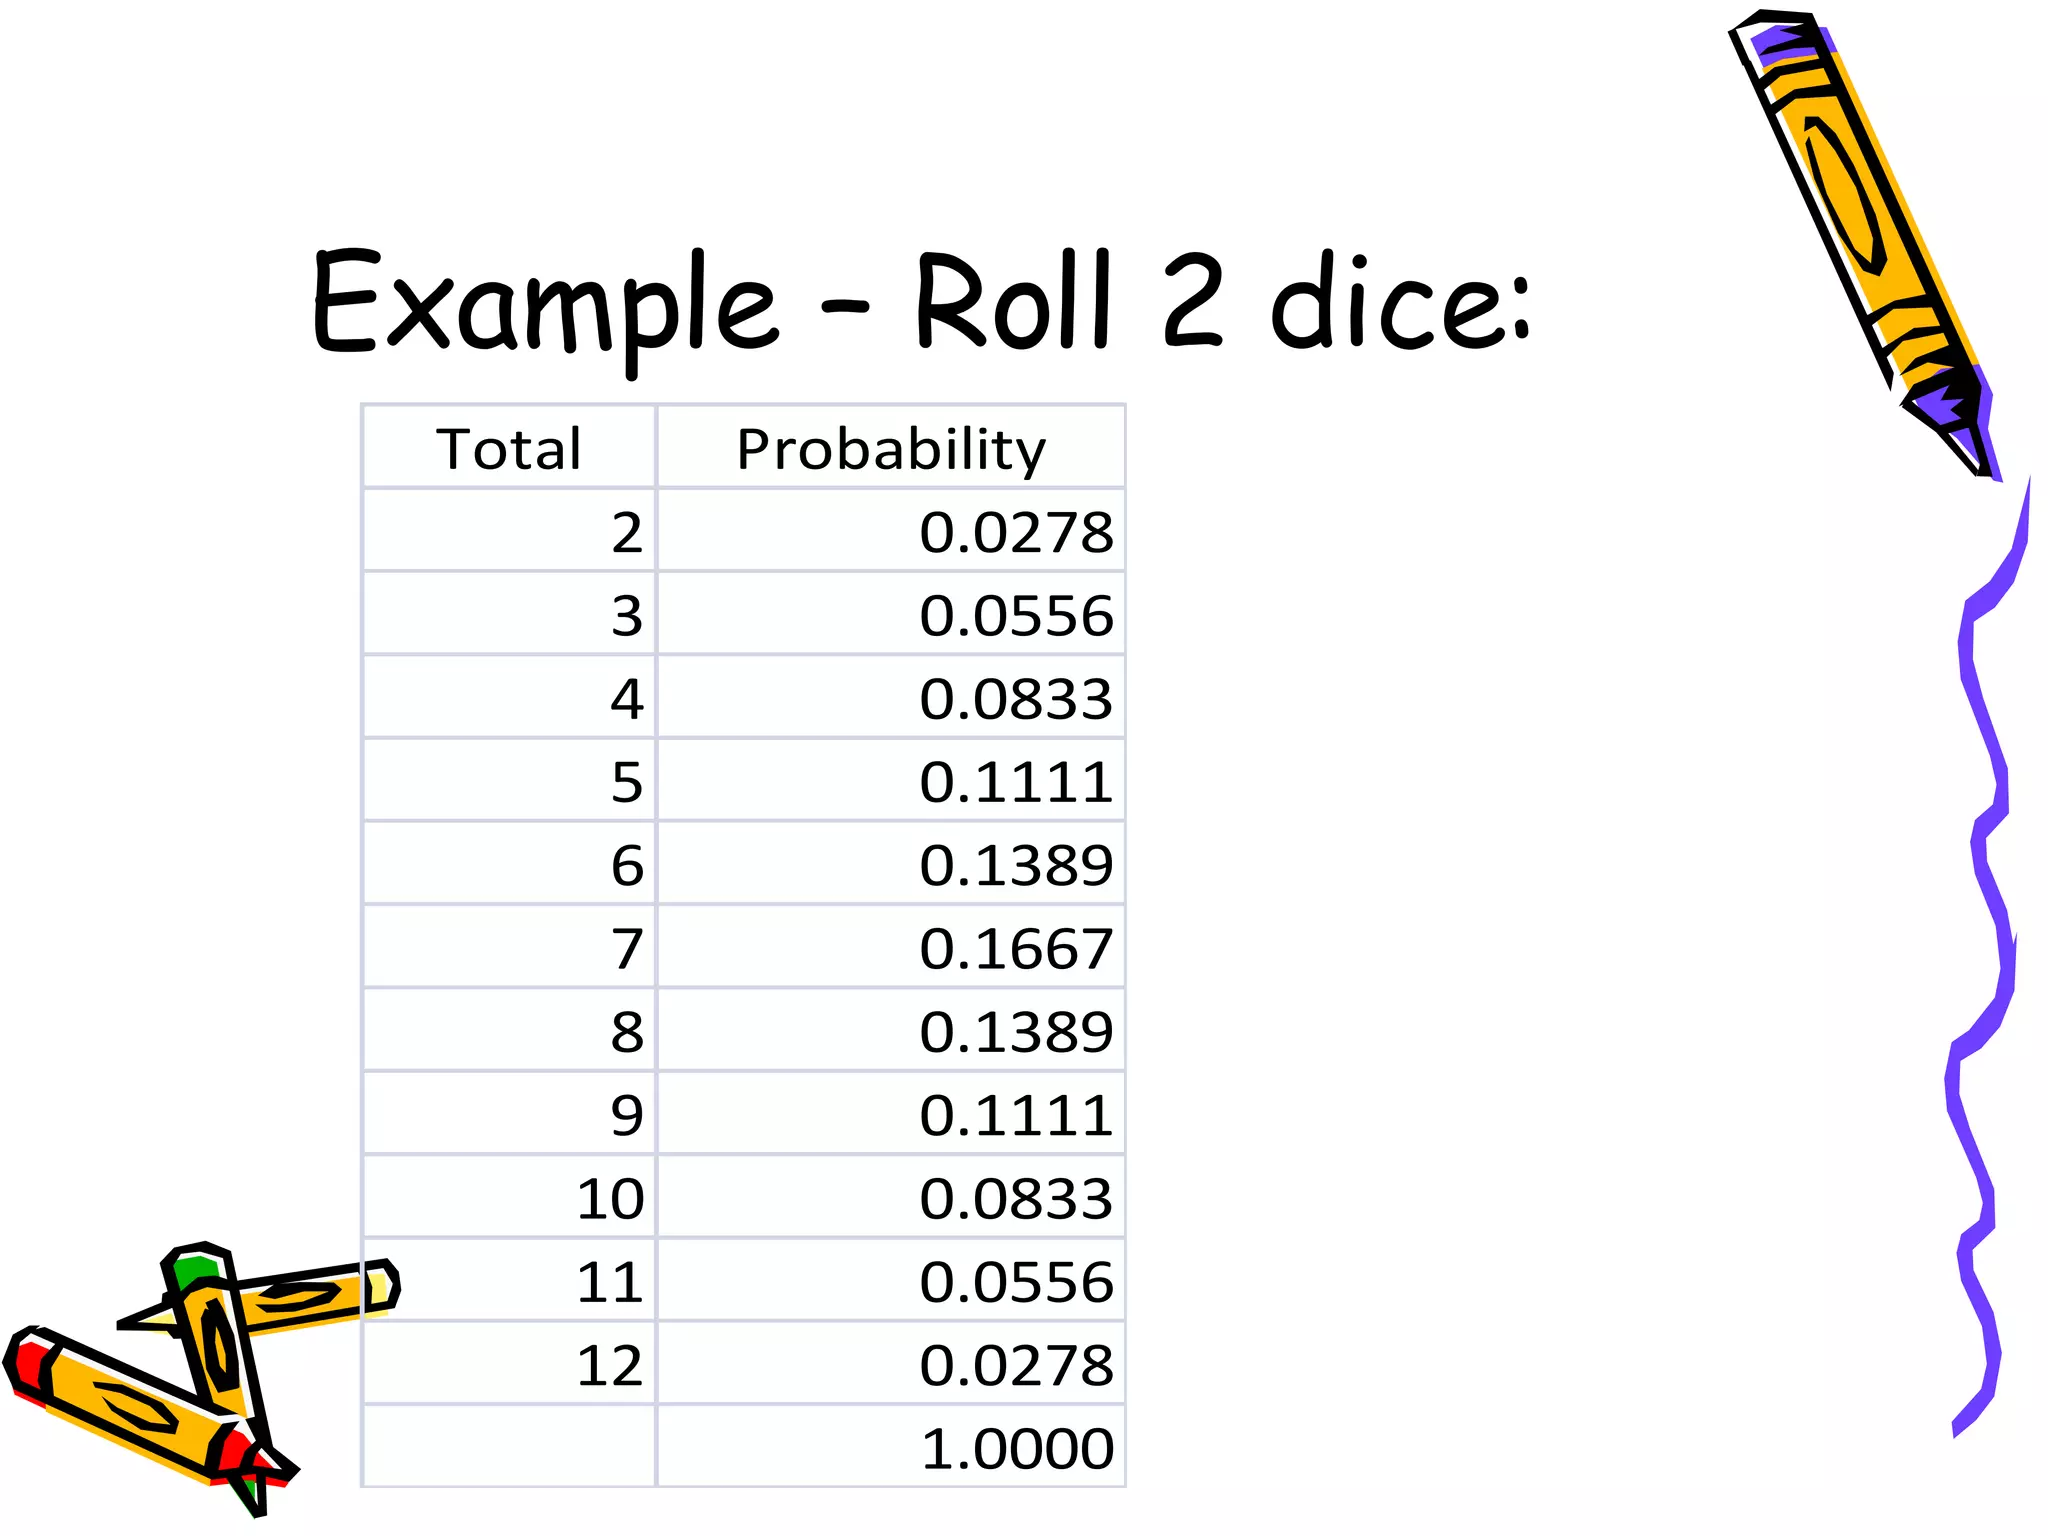
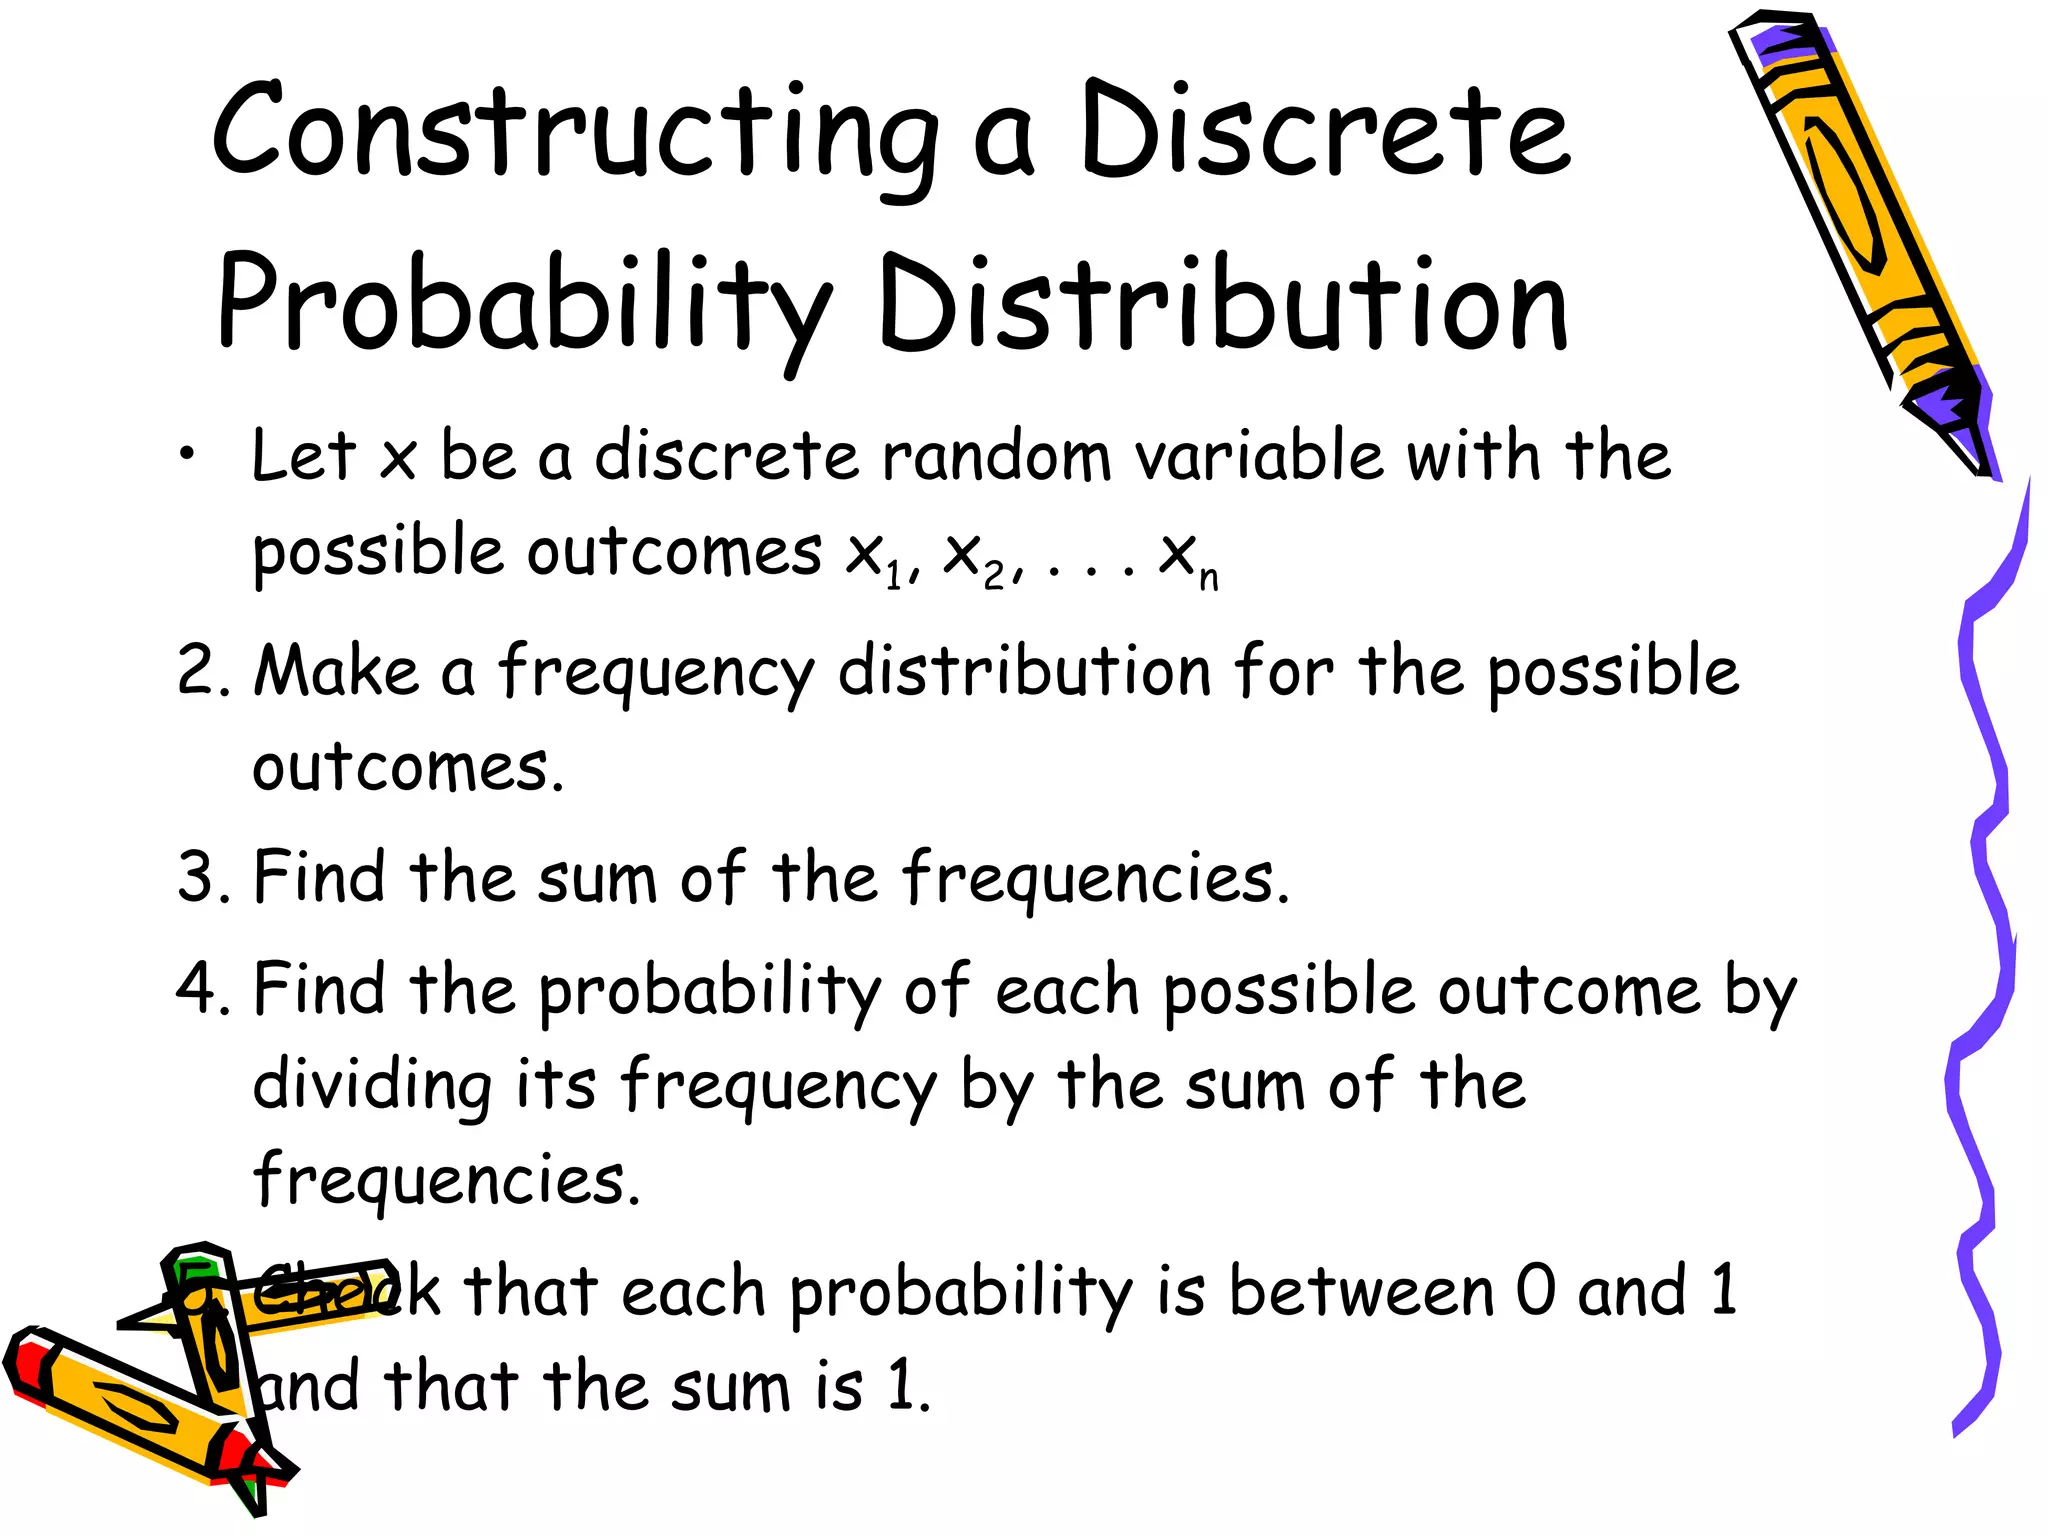
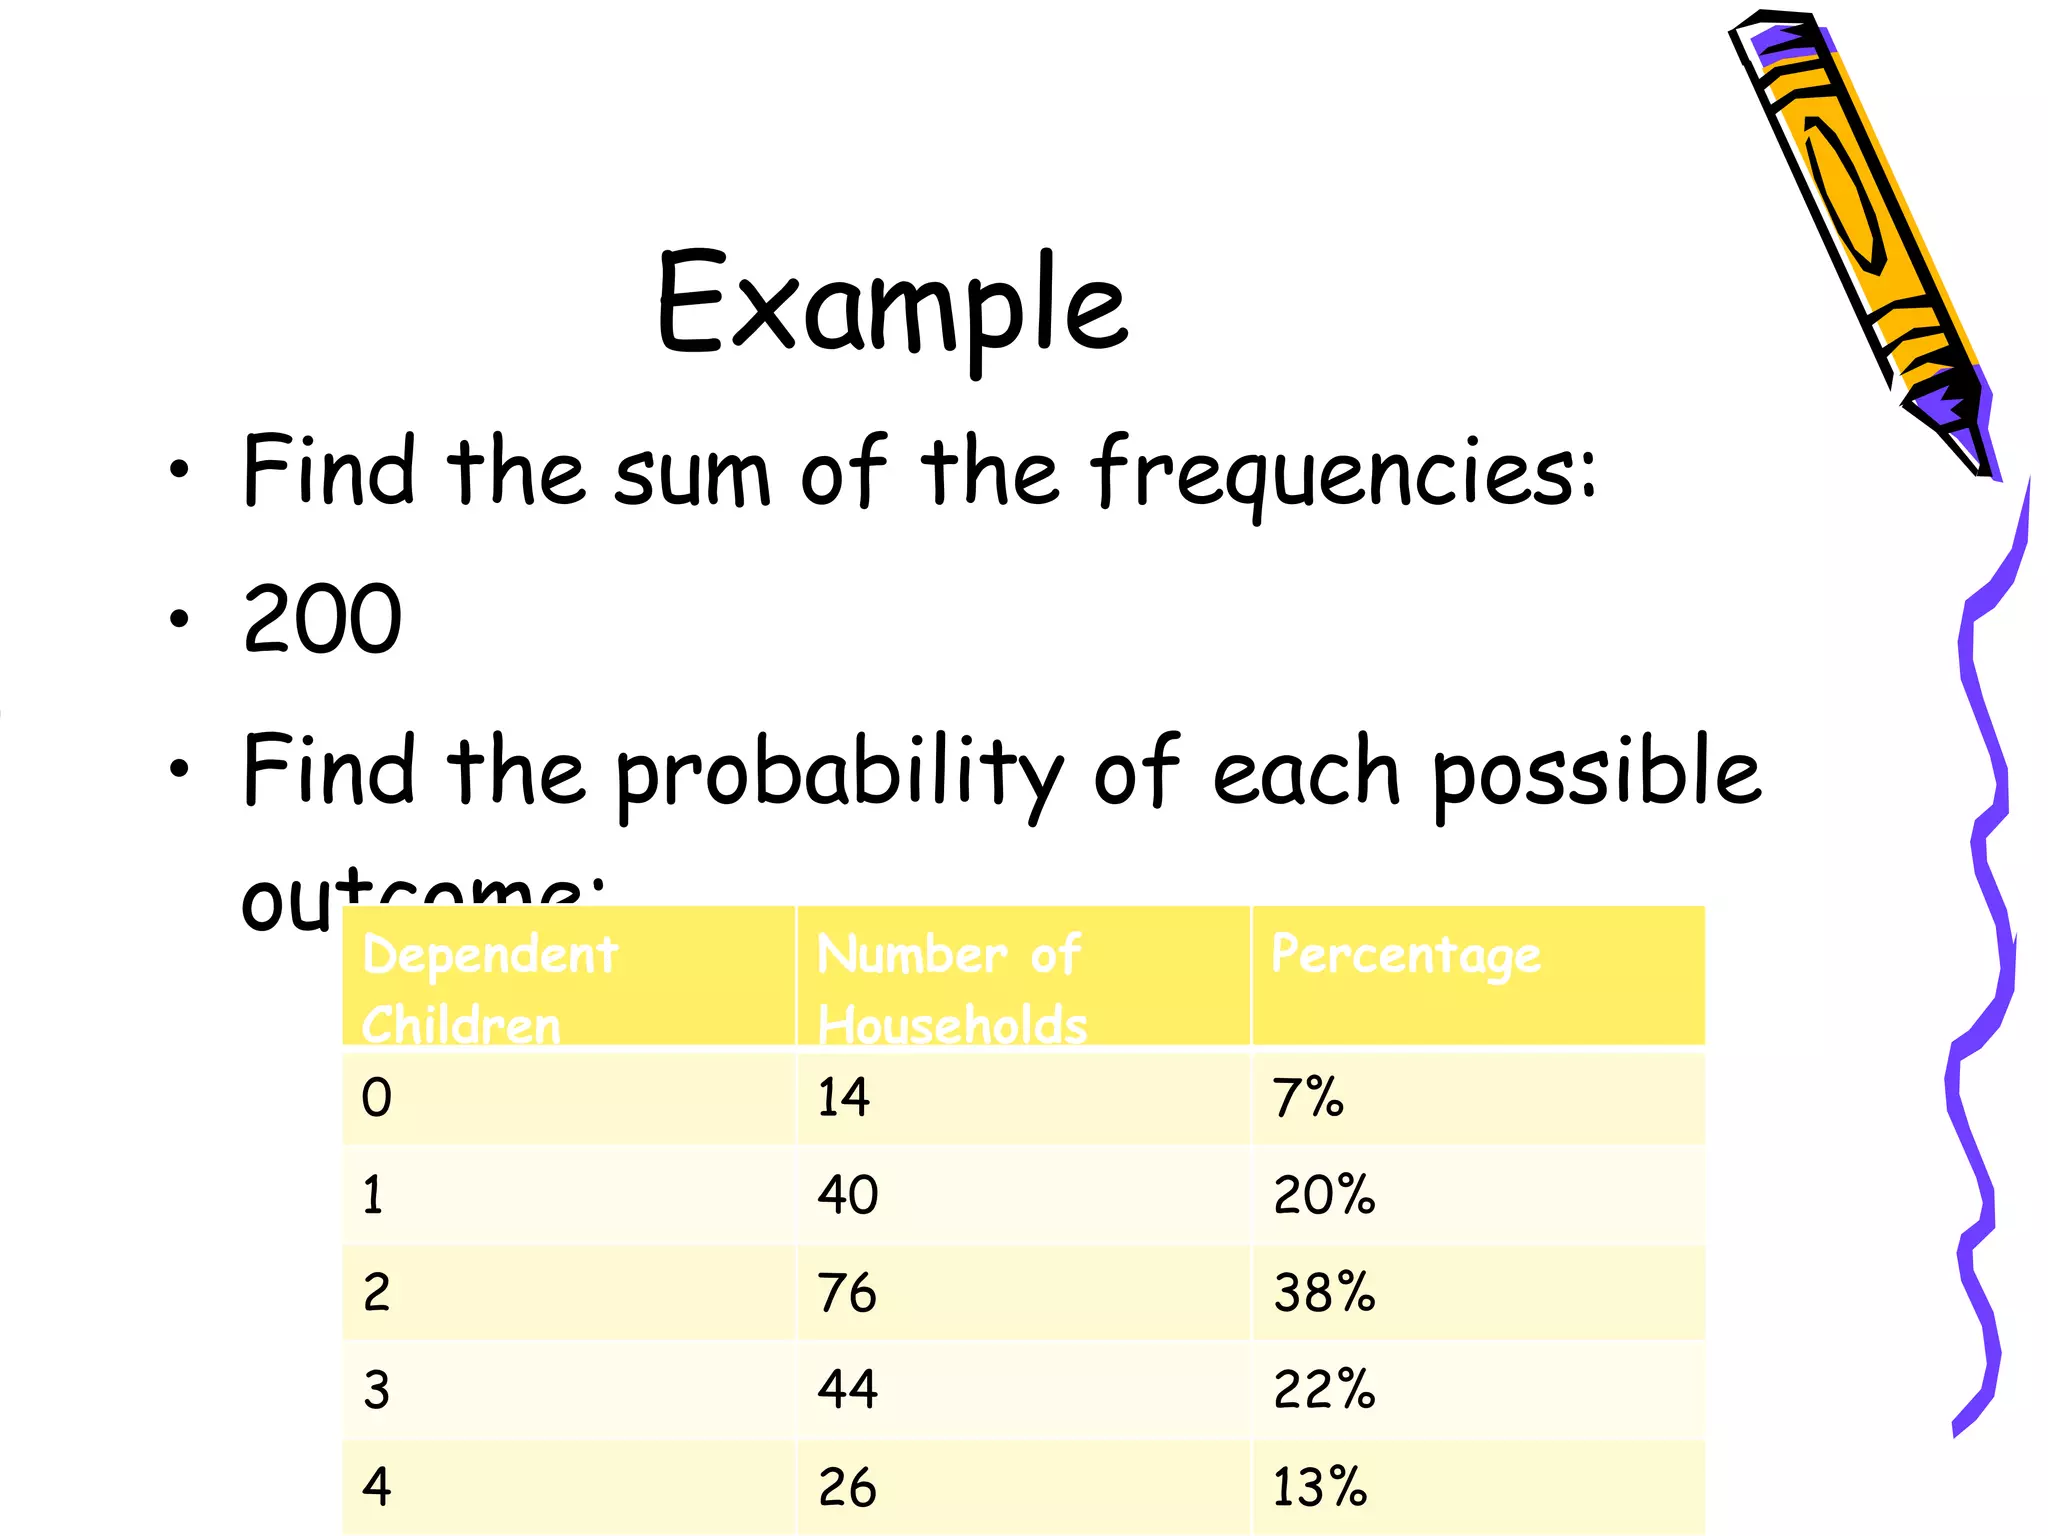
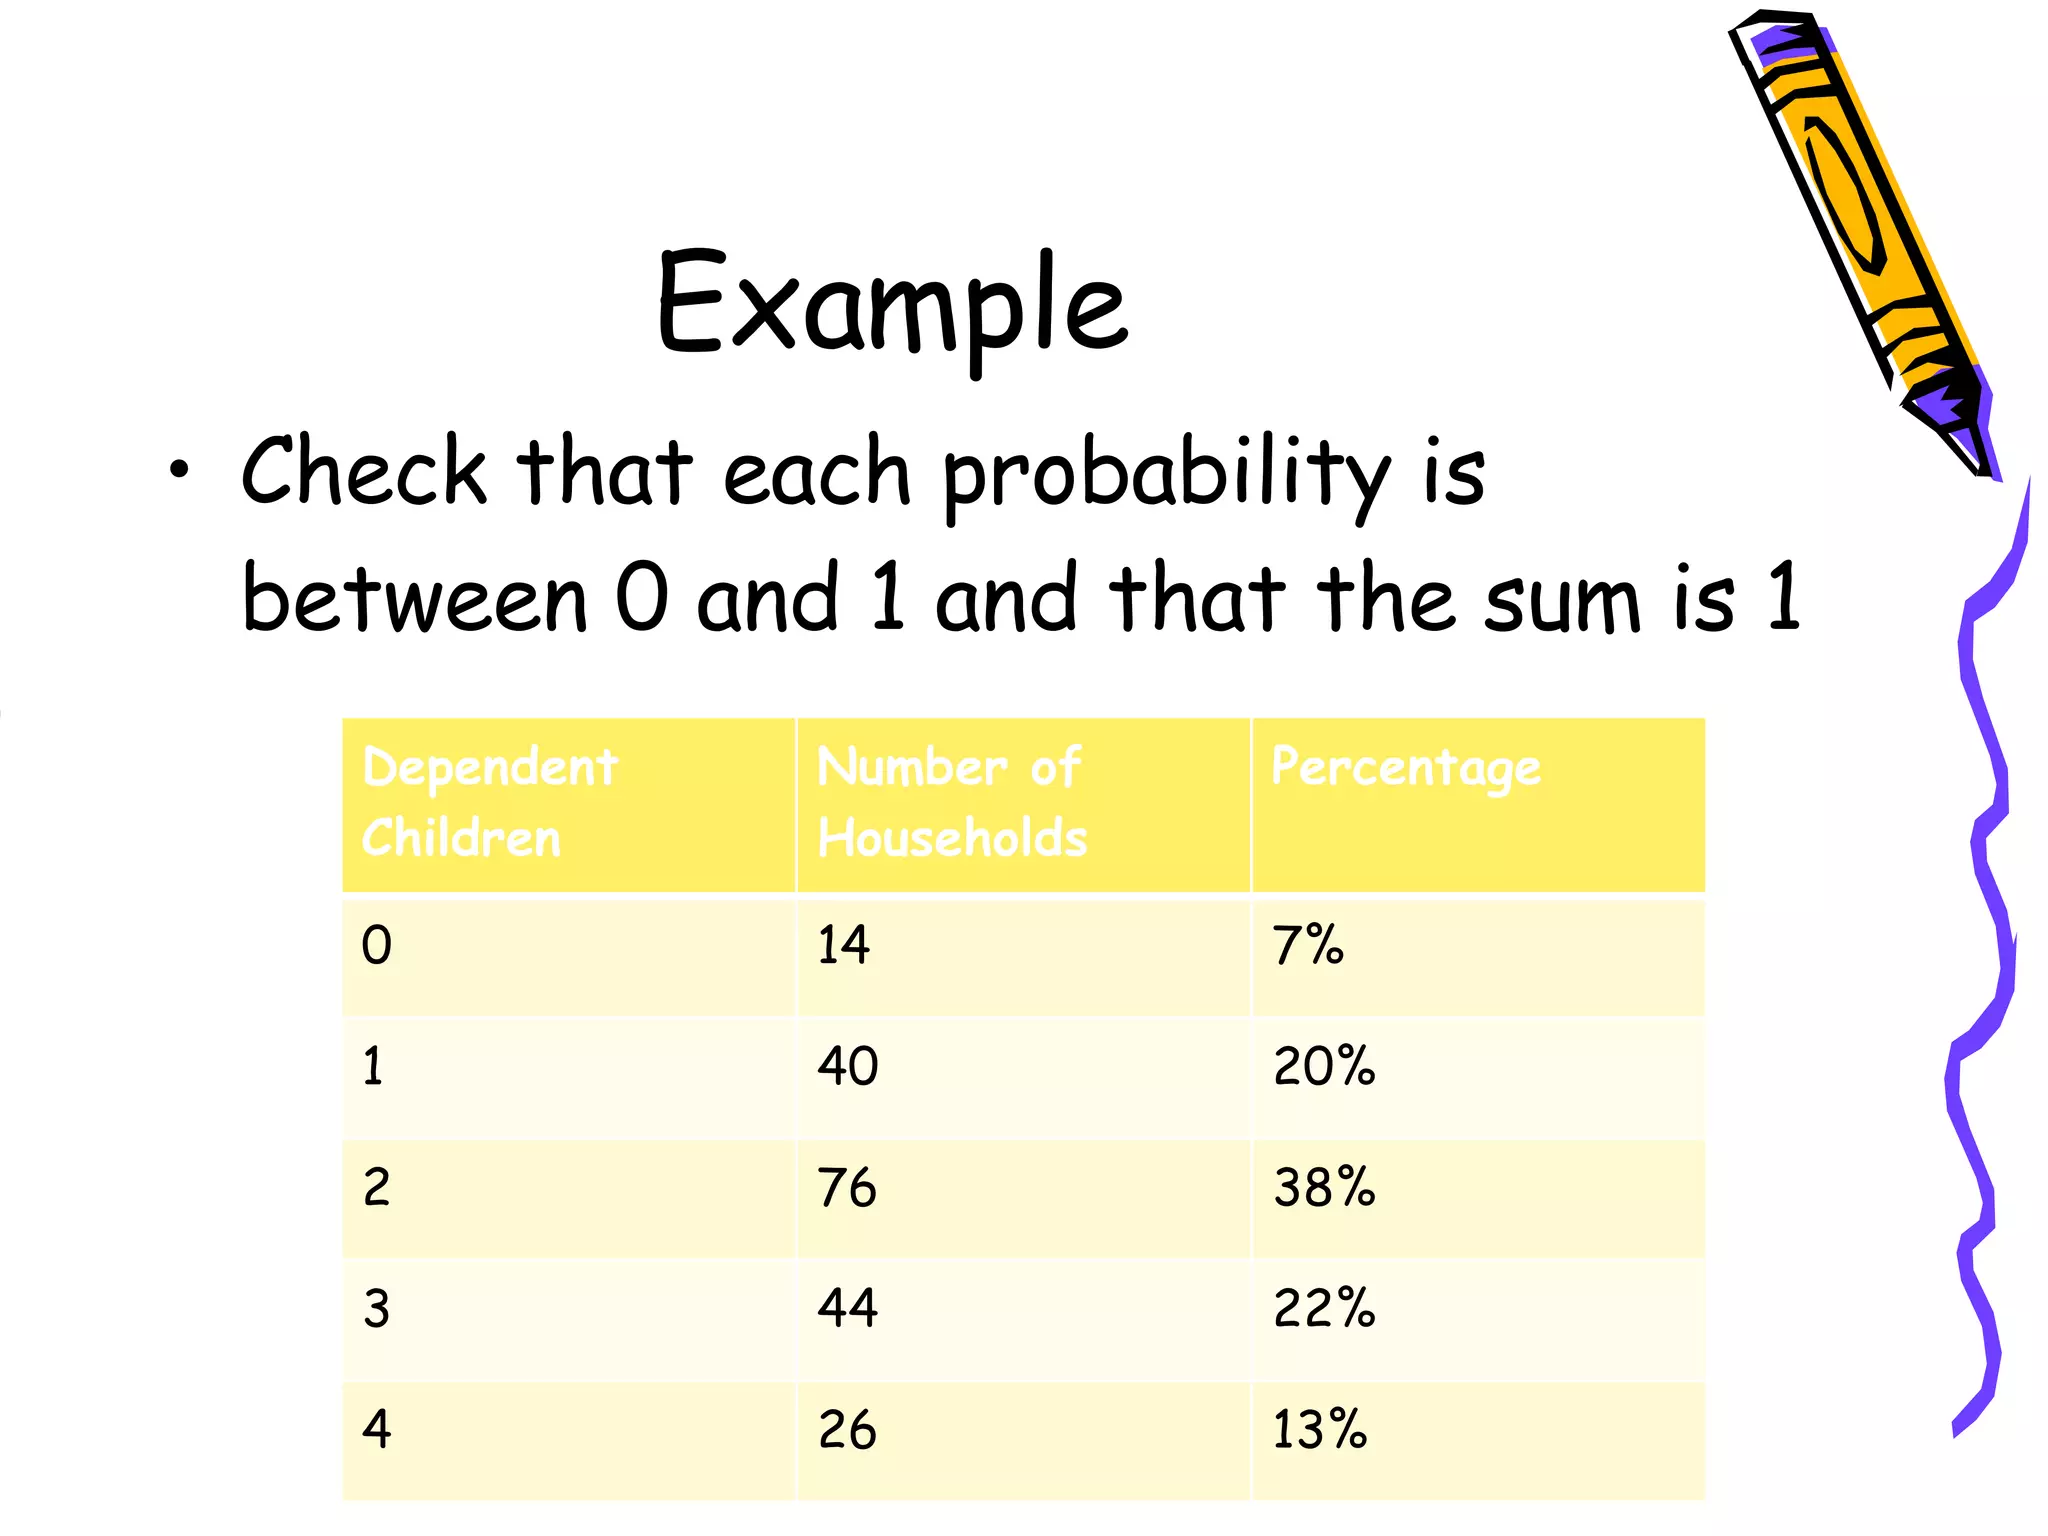
- Constructing a discrete probability distribution from sample data and calculating probabilities
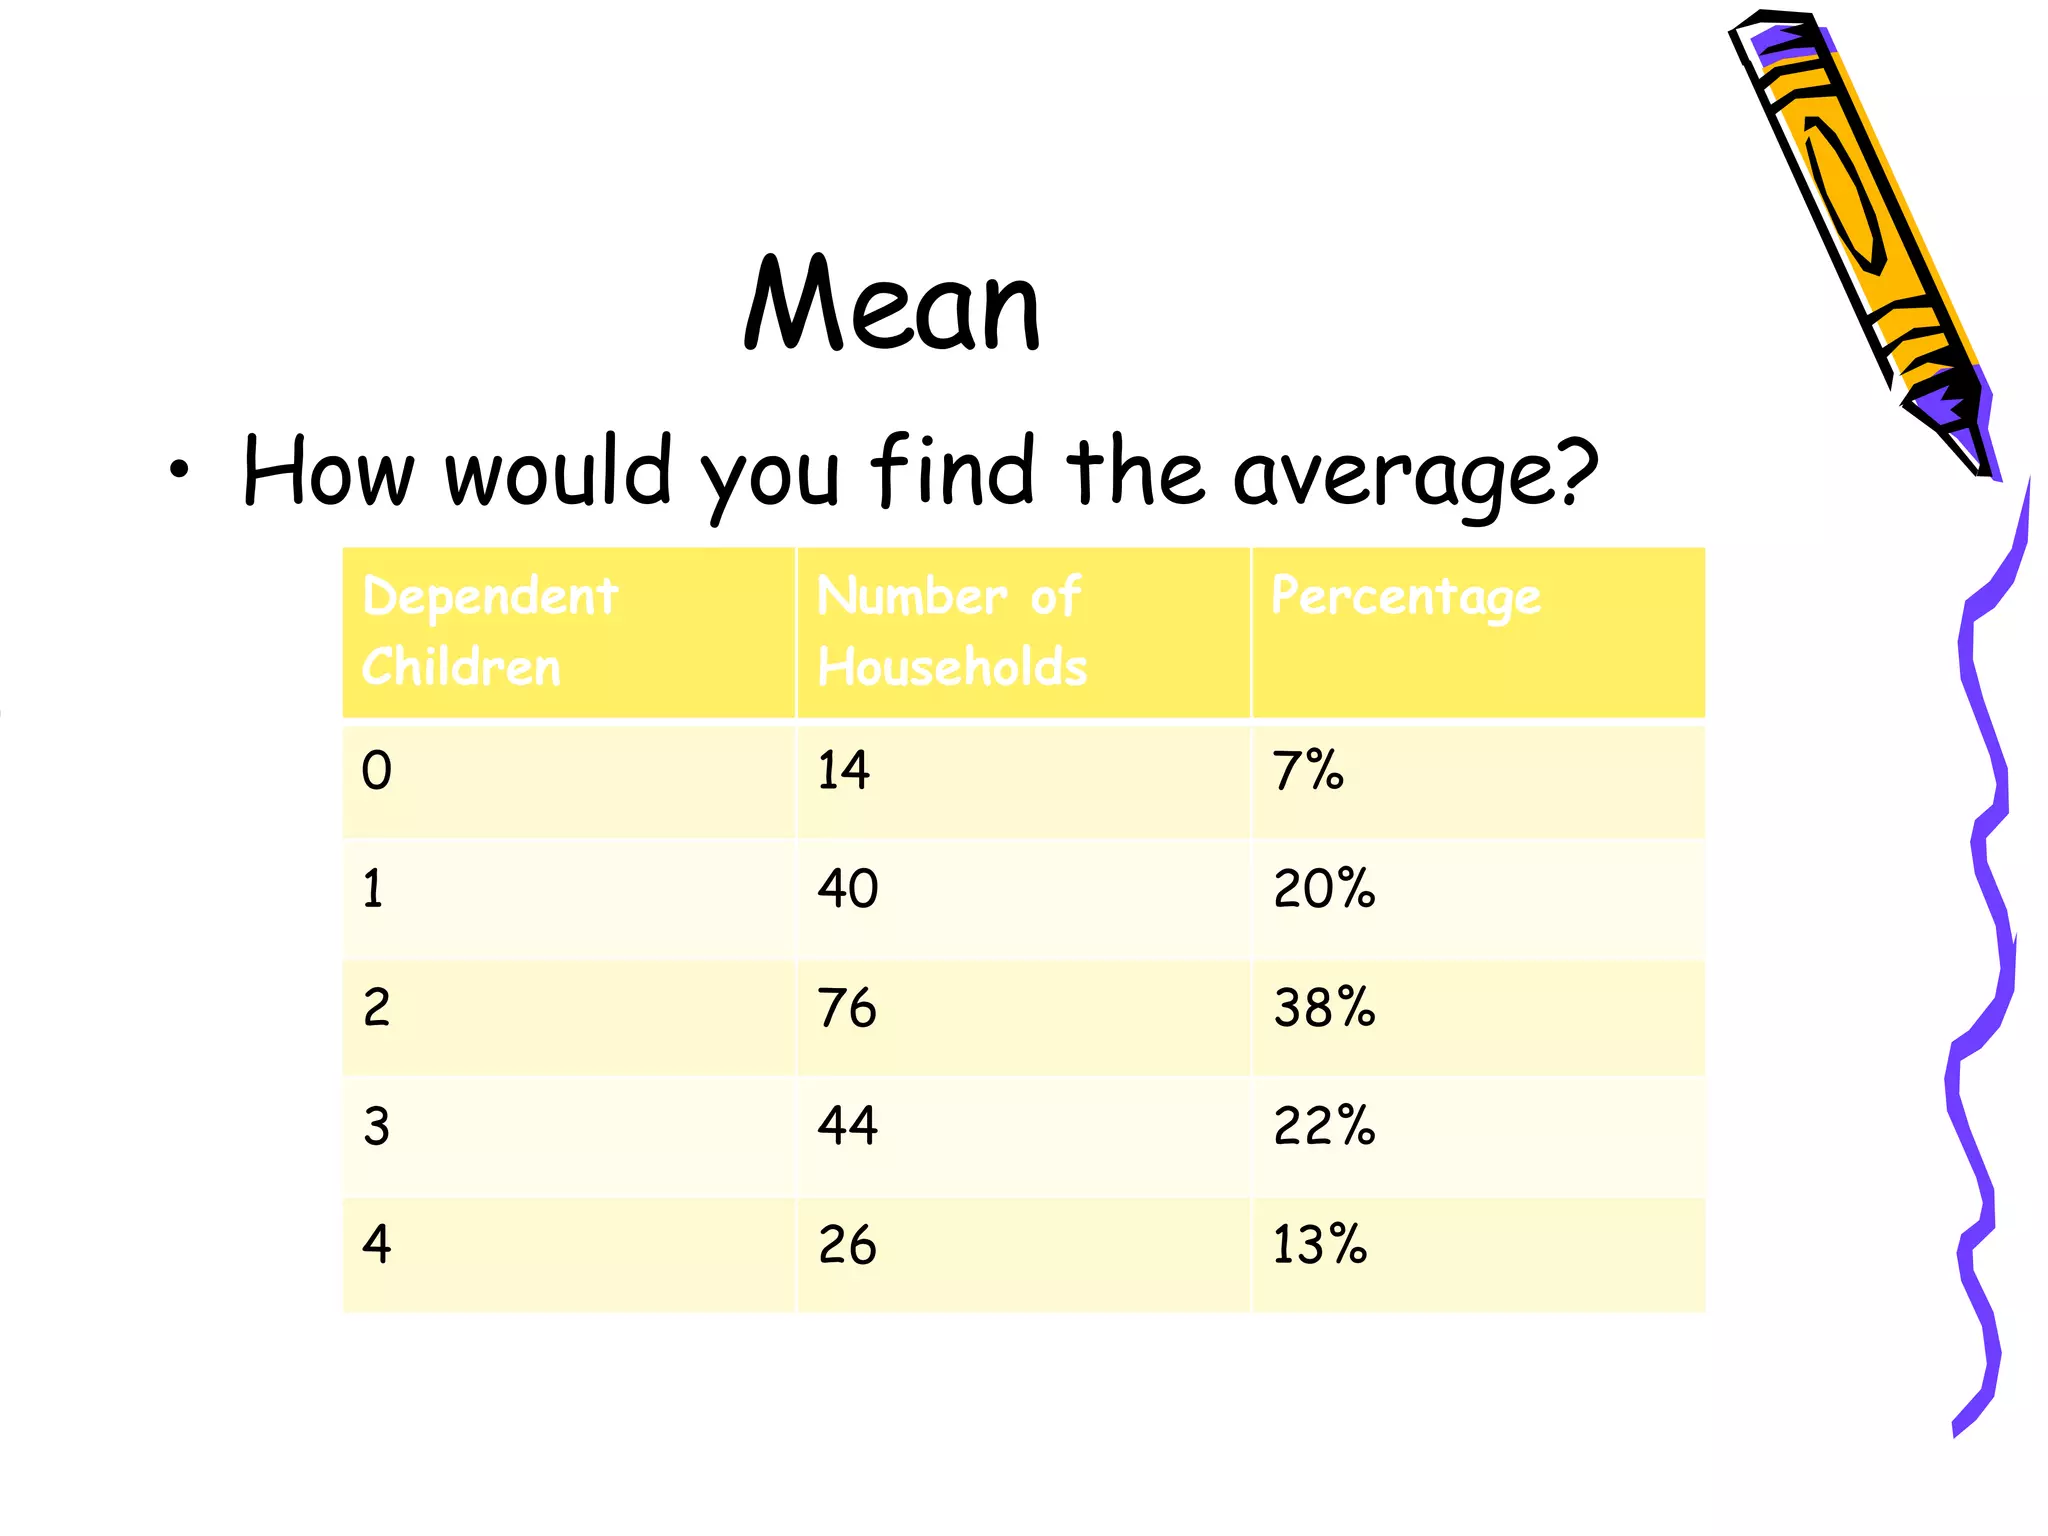
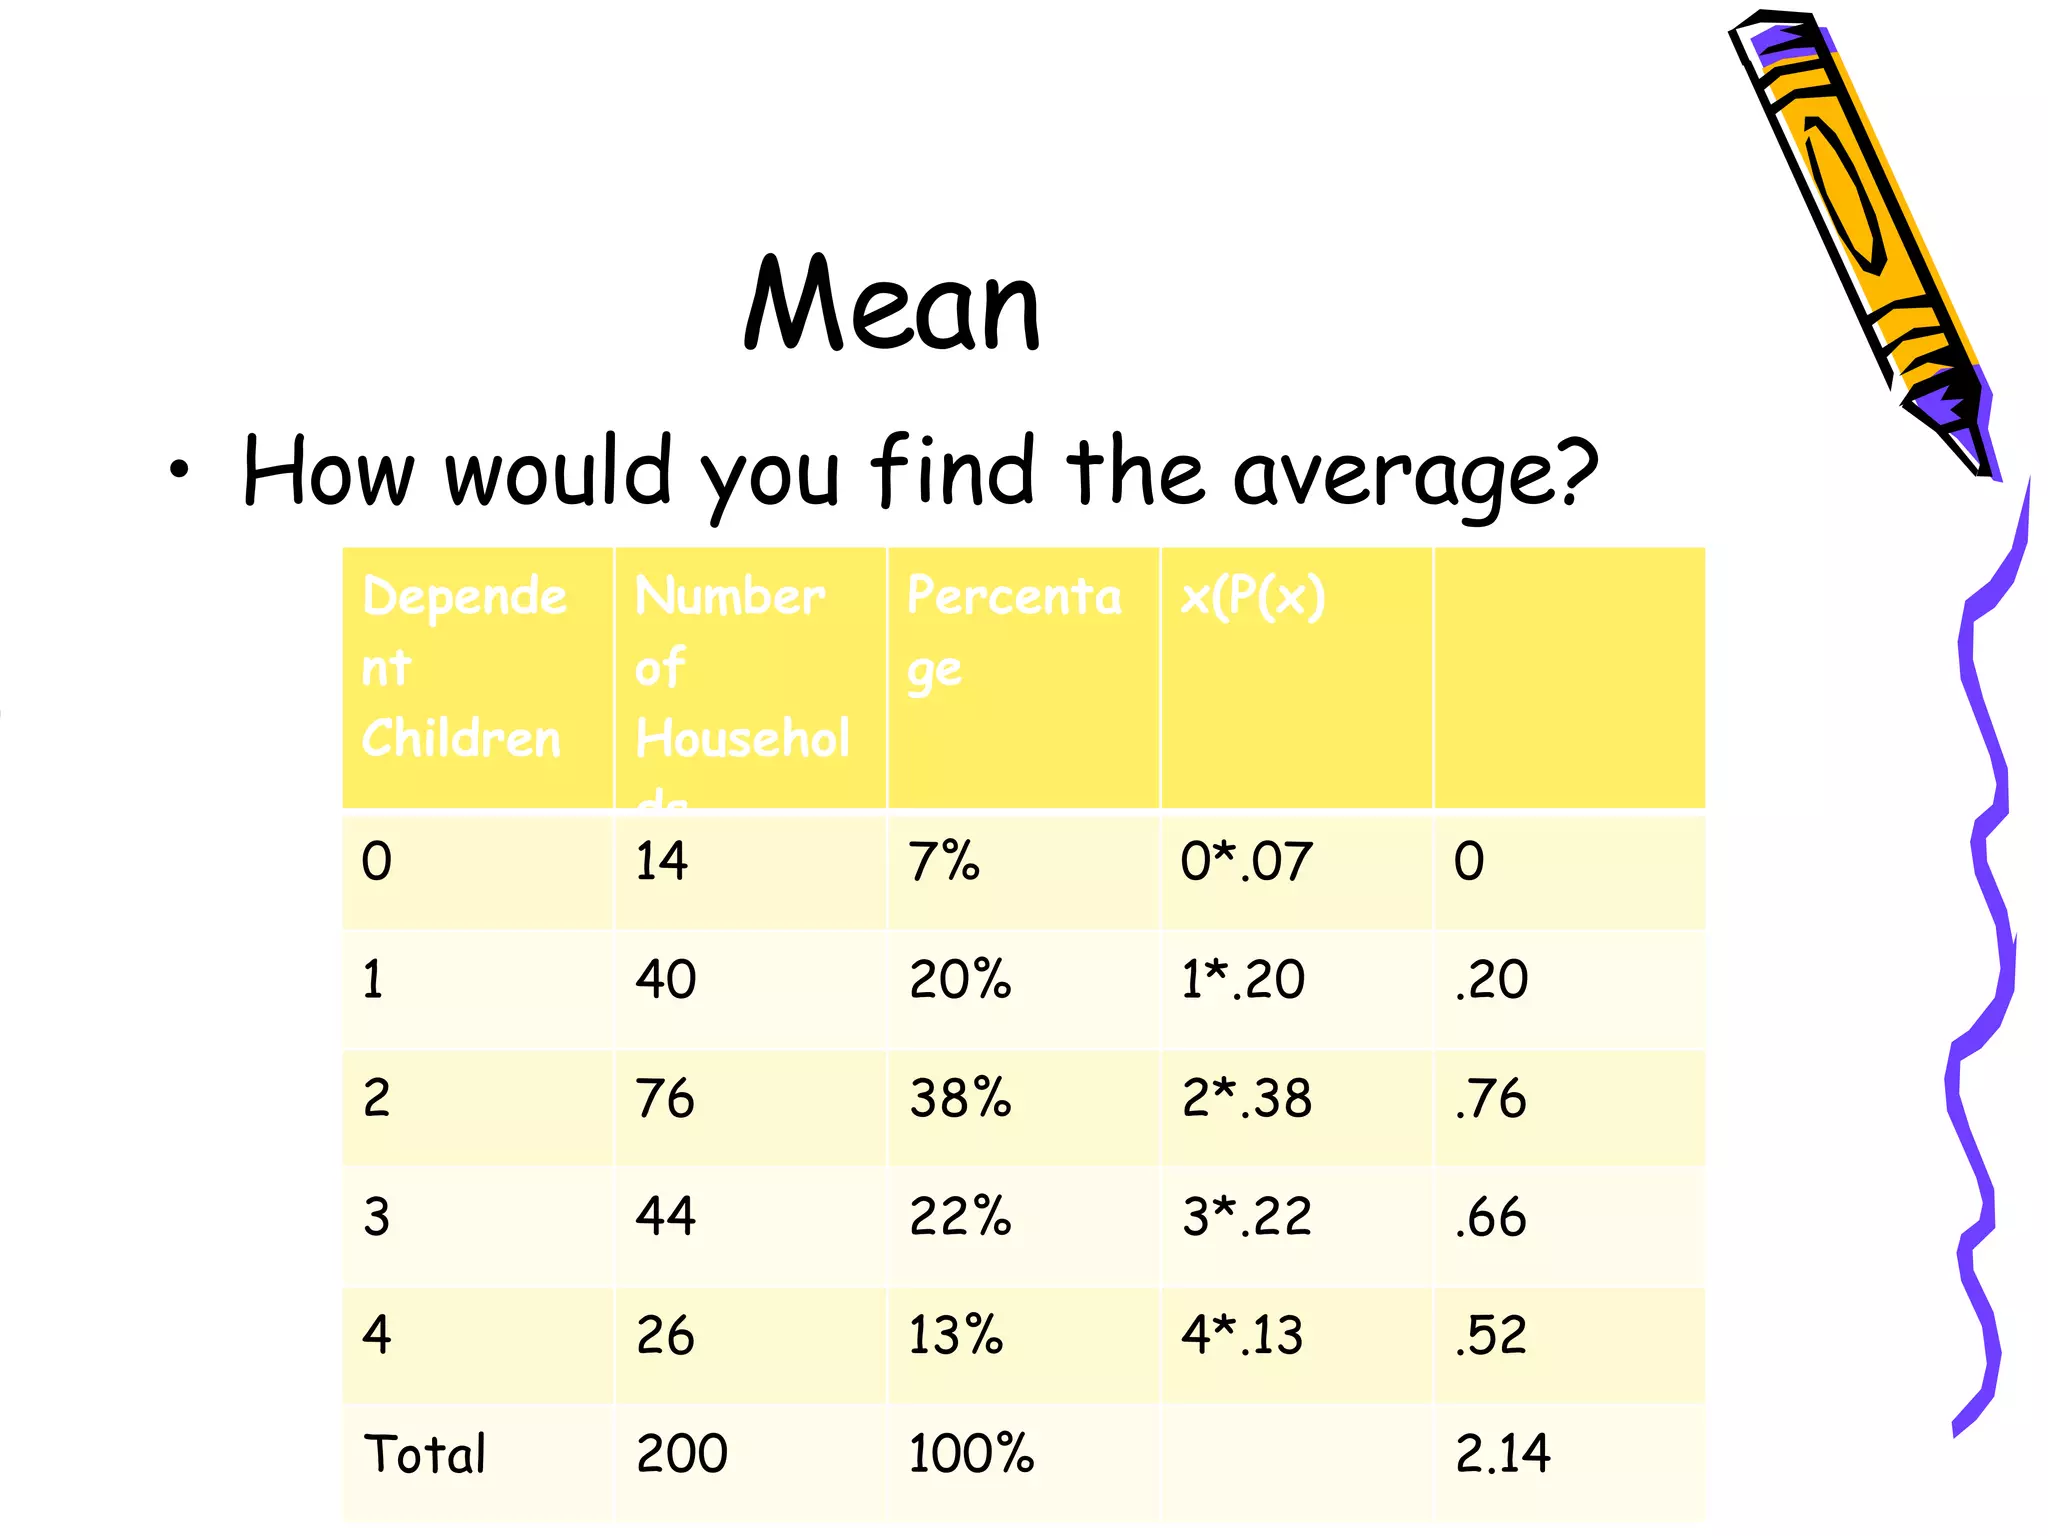
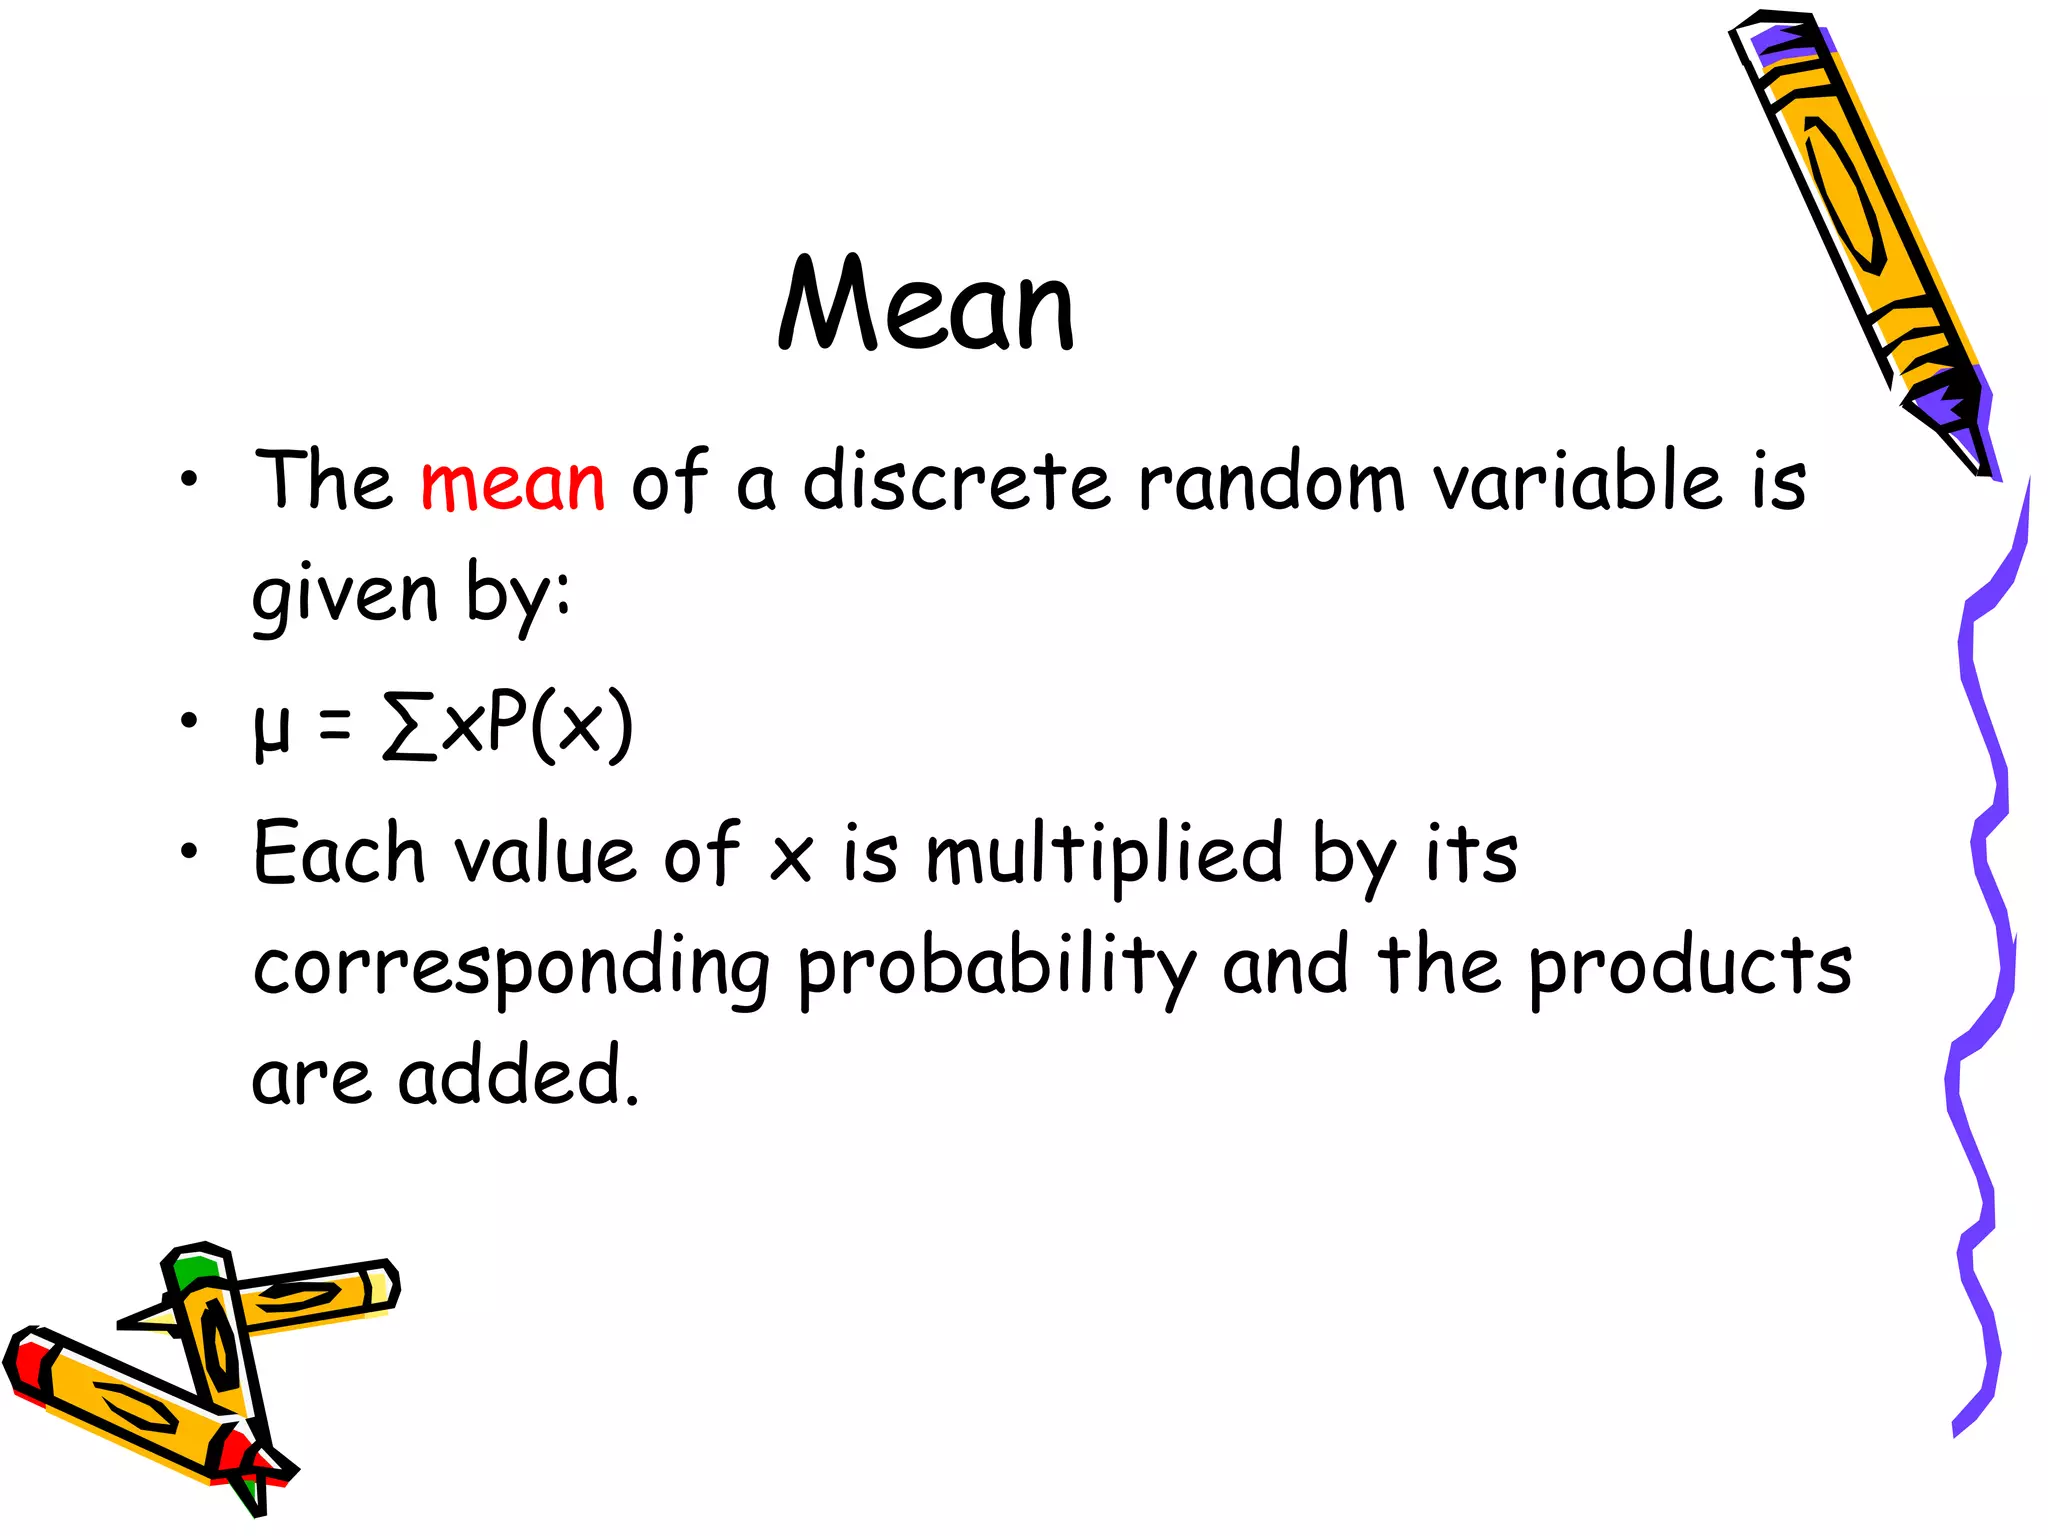
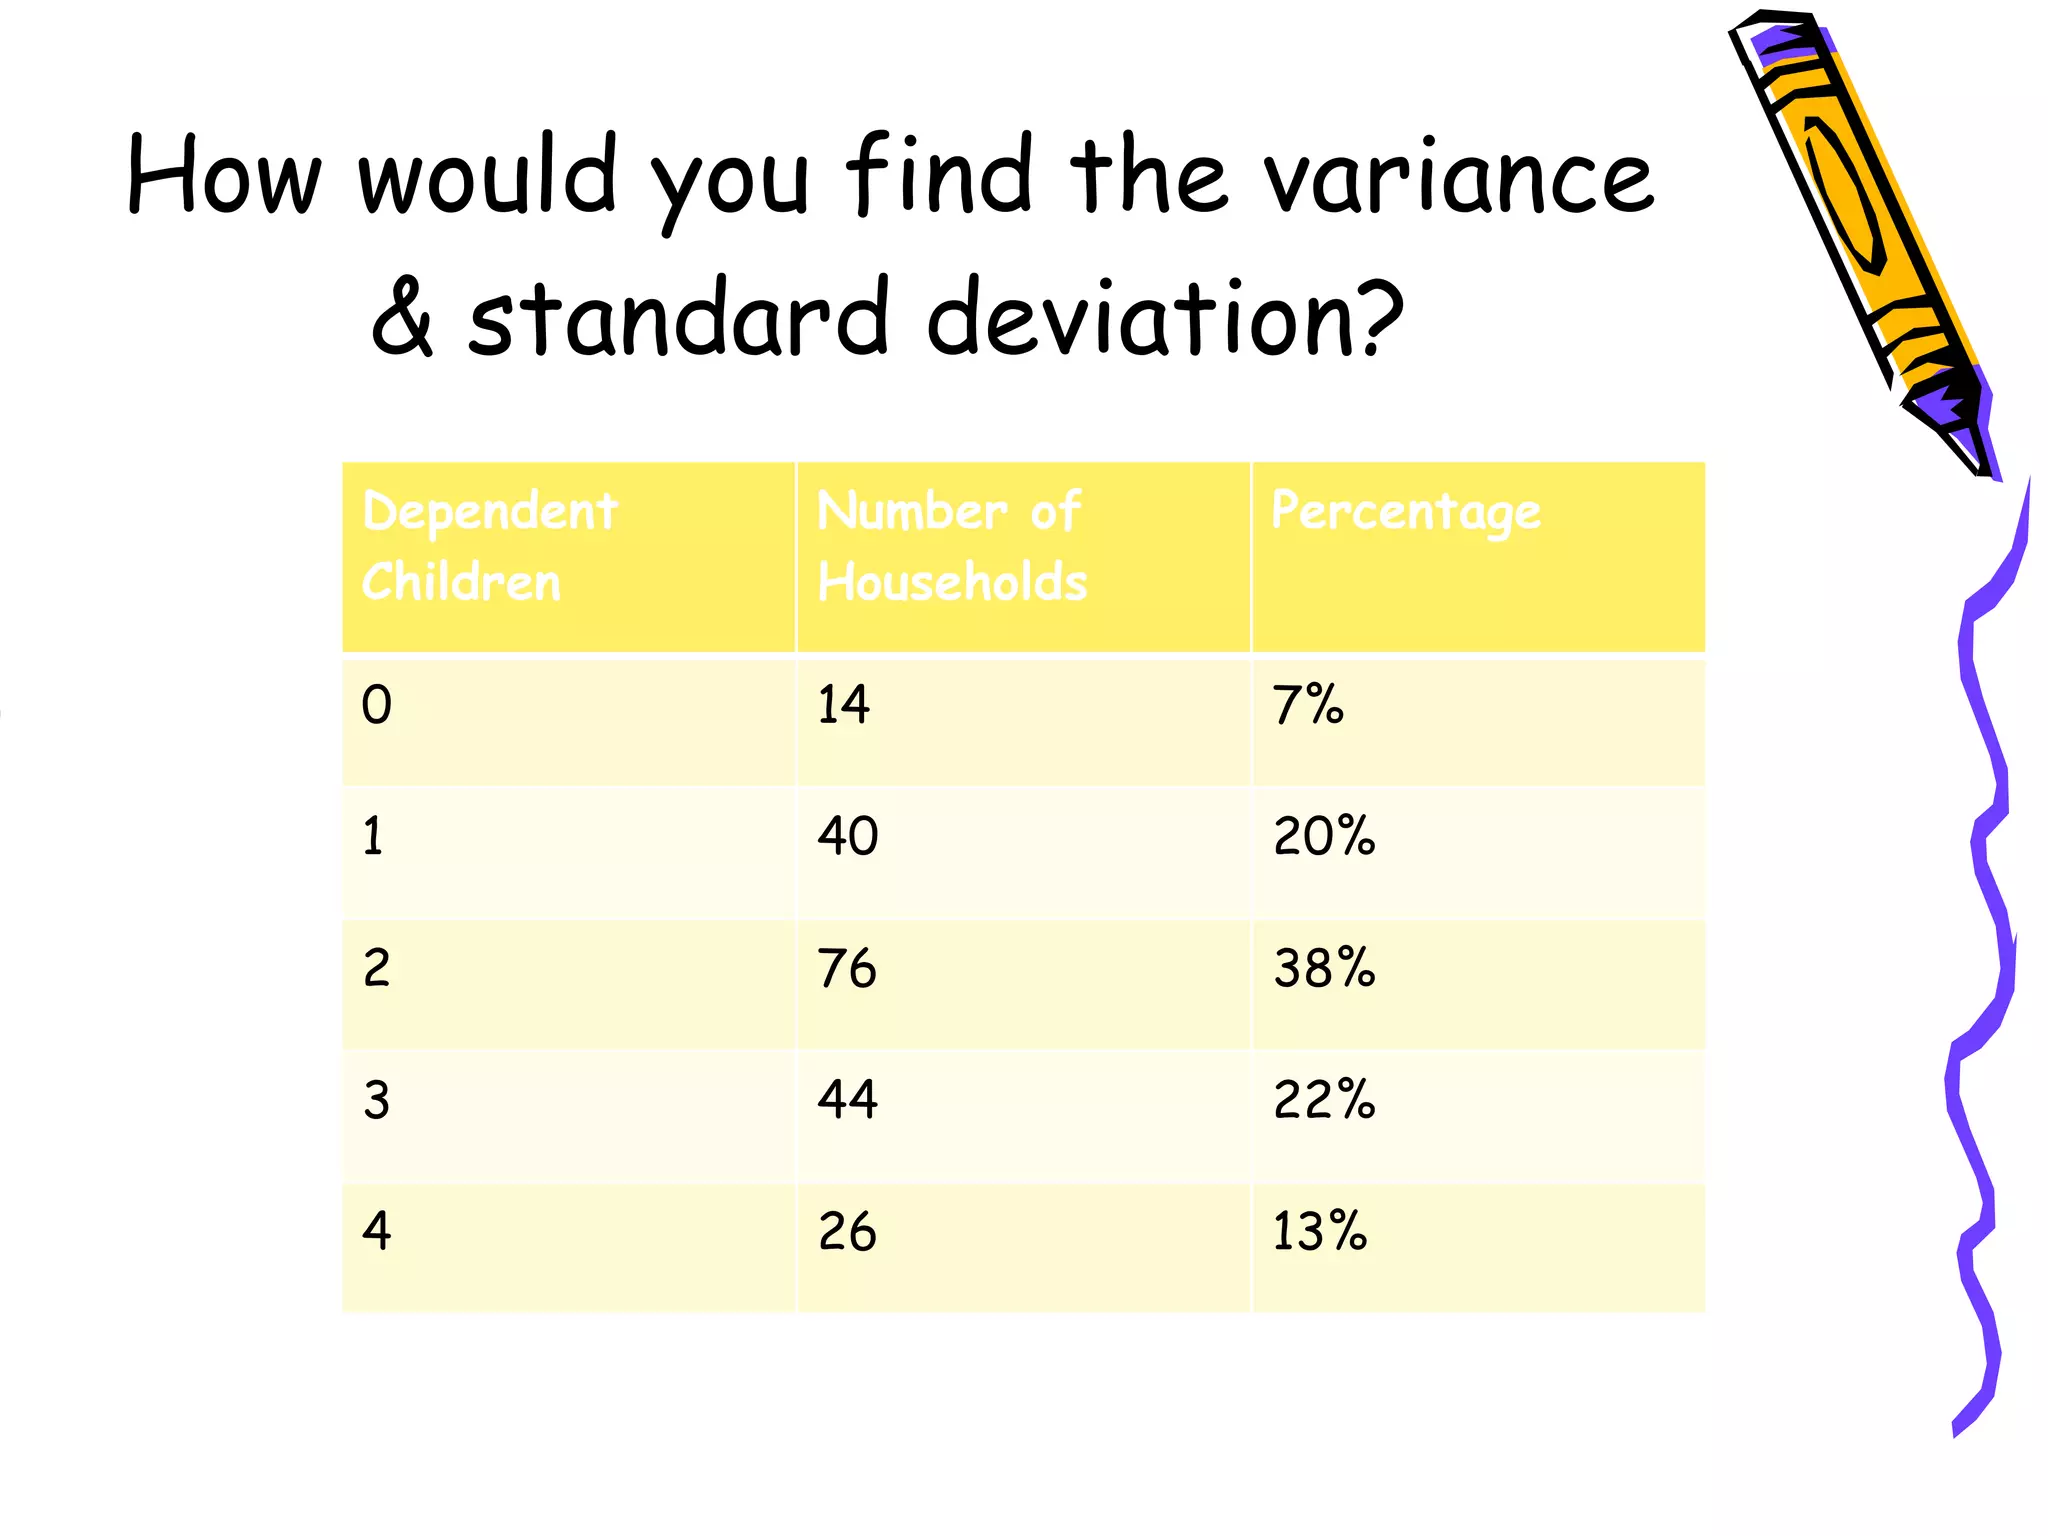
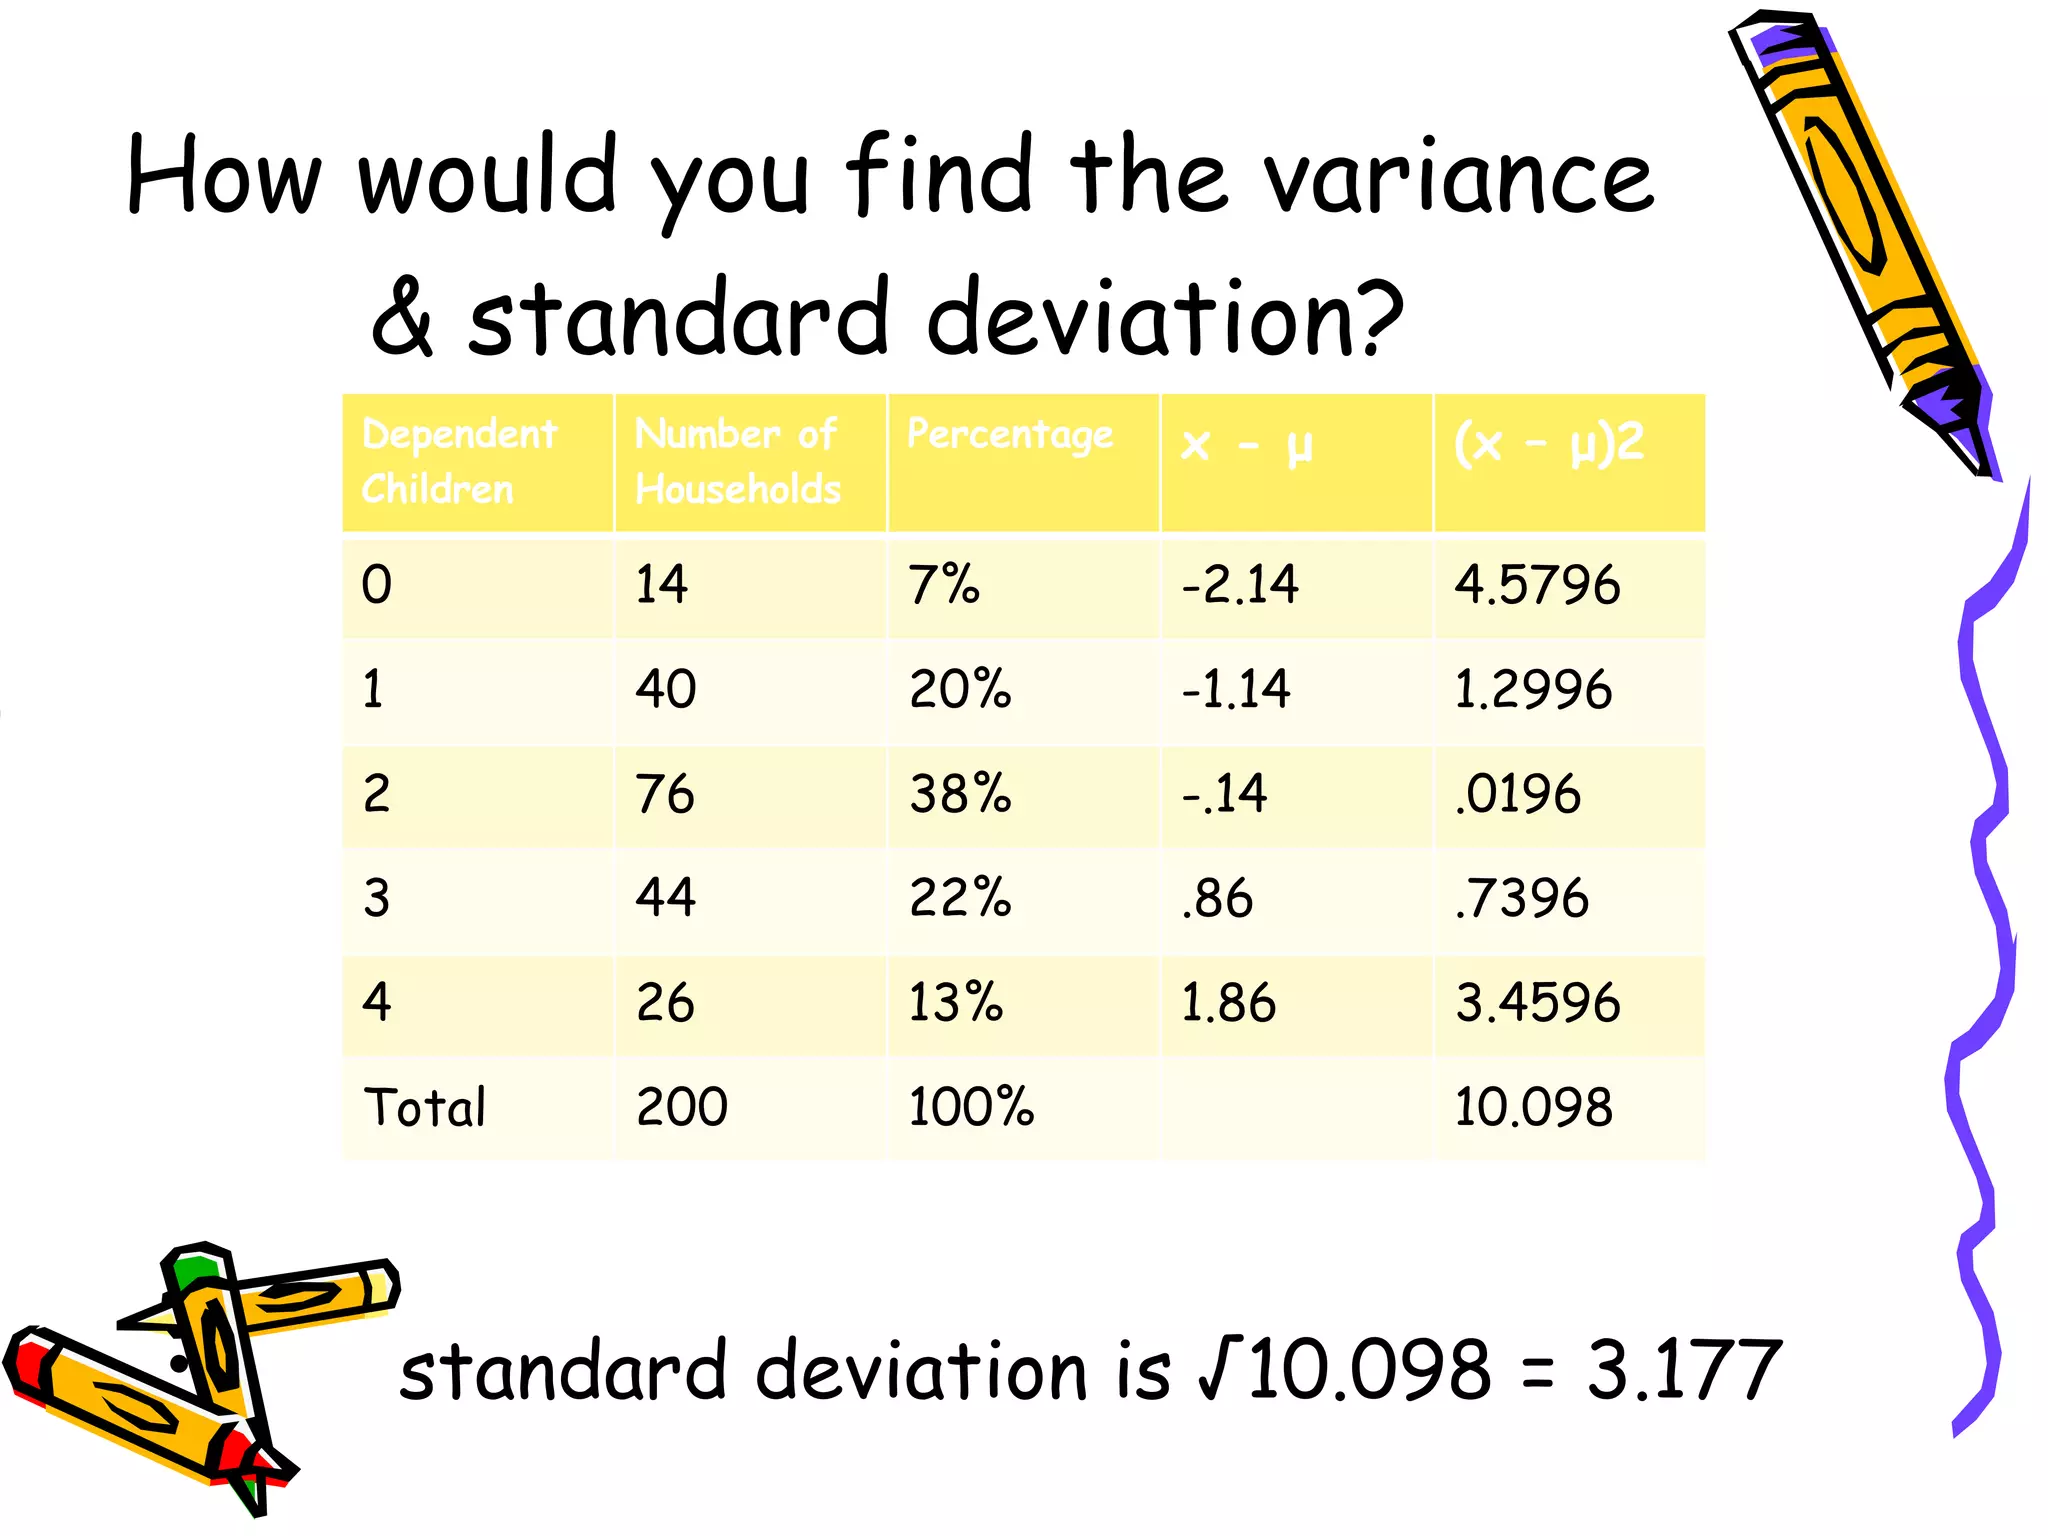
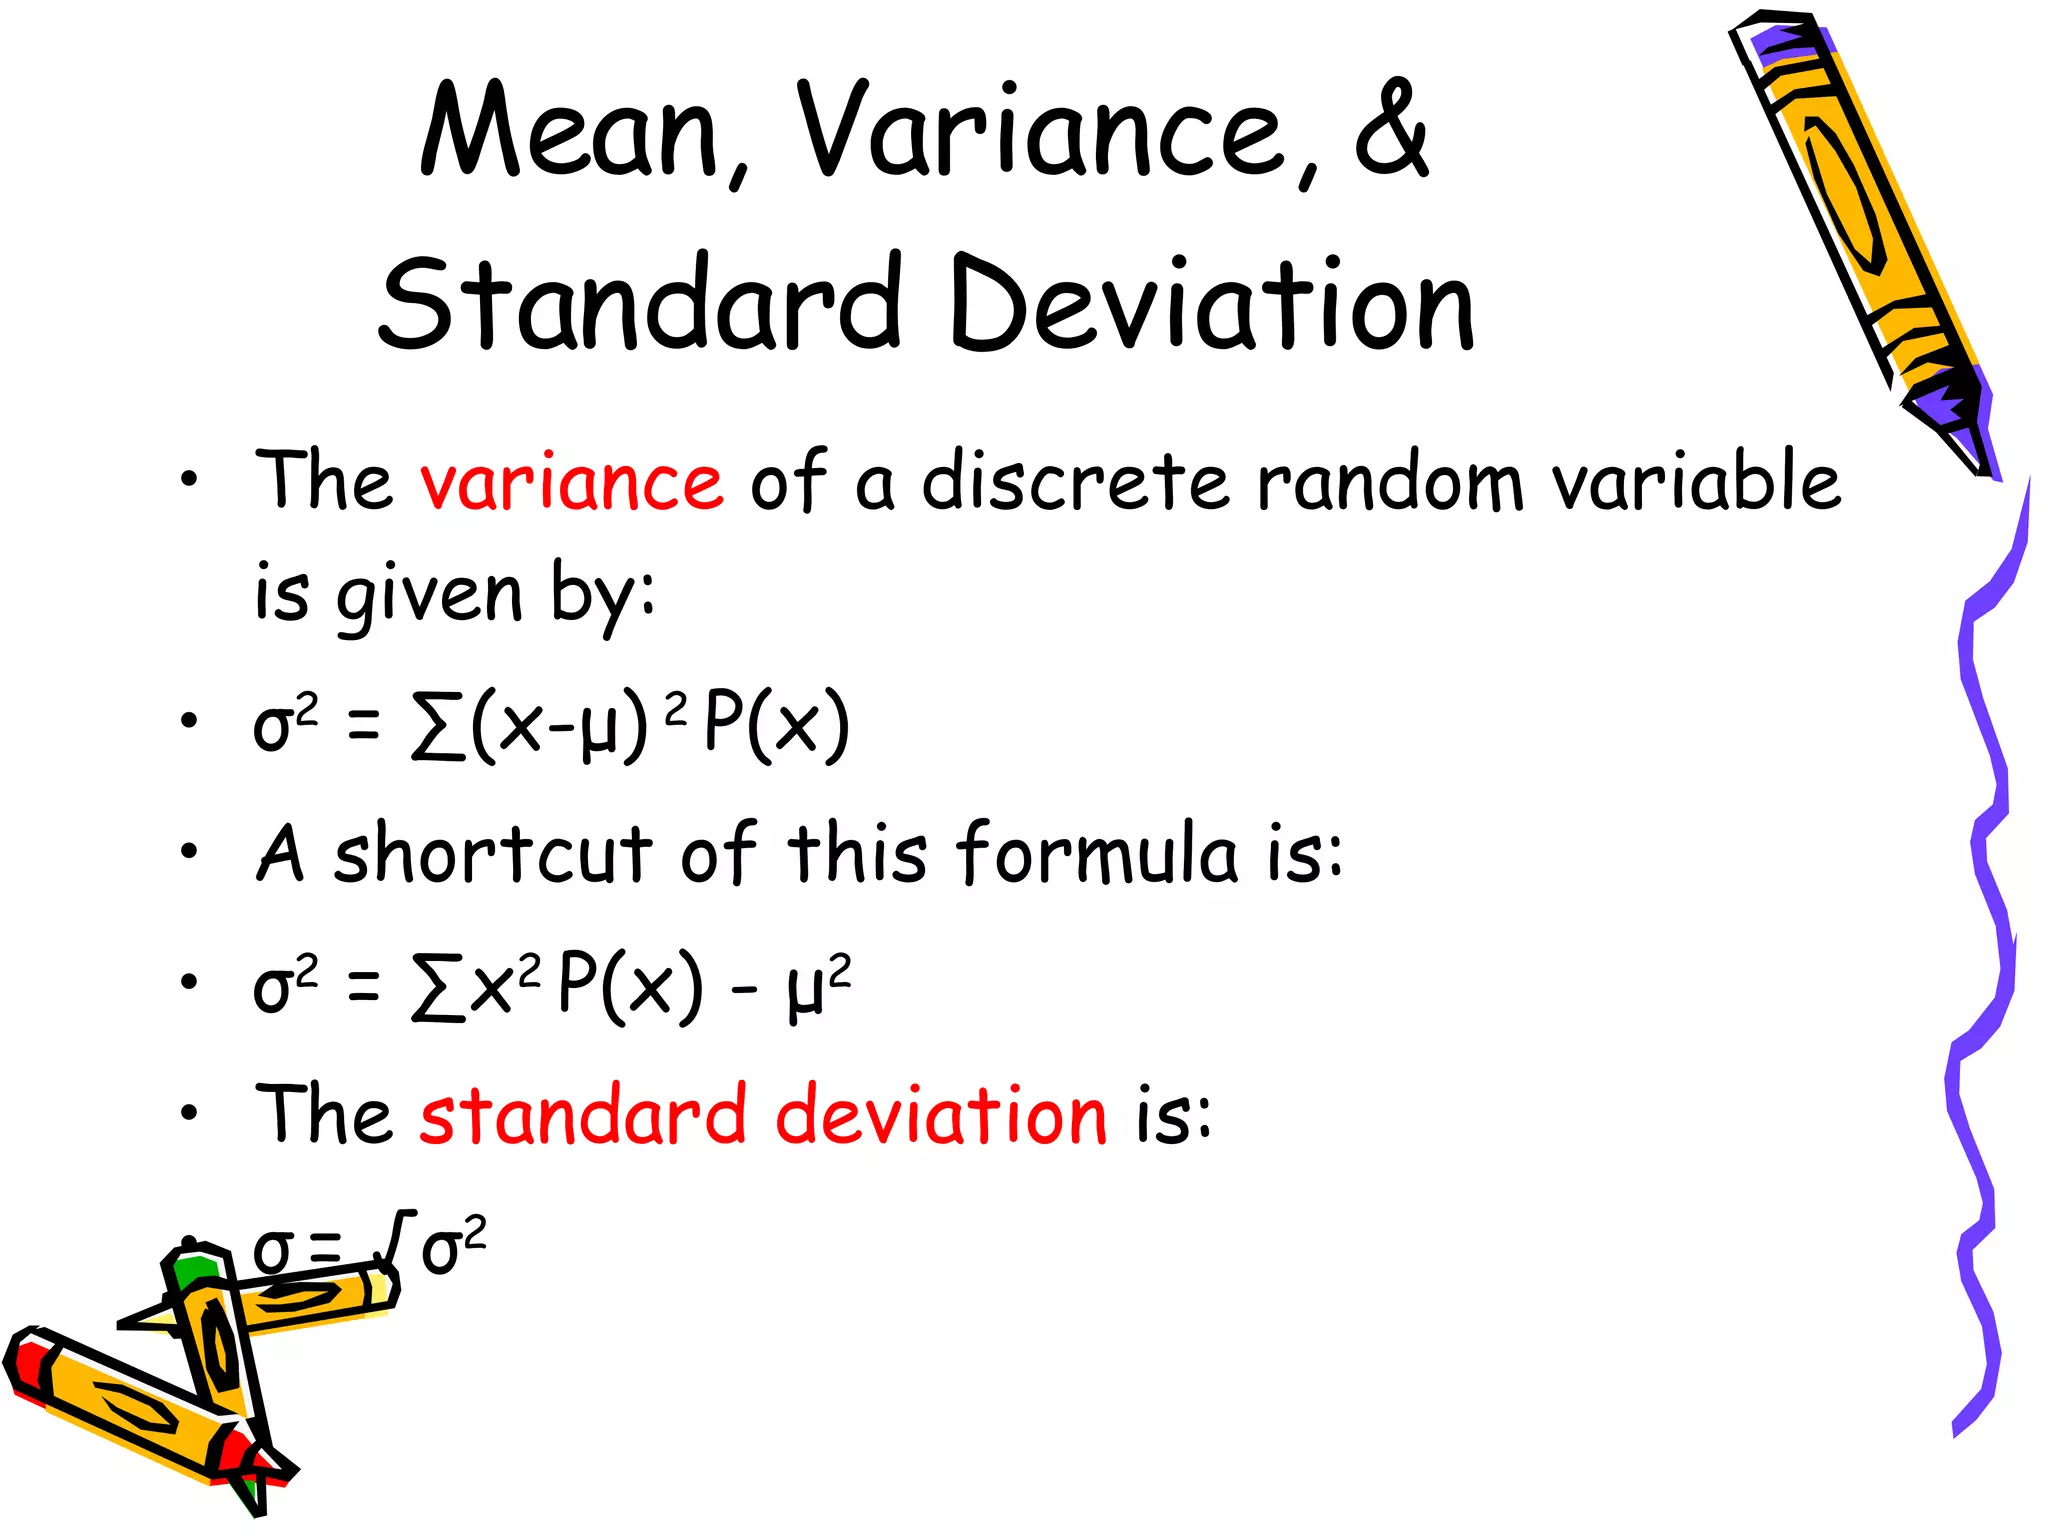
- Finding the mean, variance, and standard deviation of a discrete probability distribution
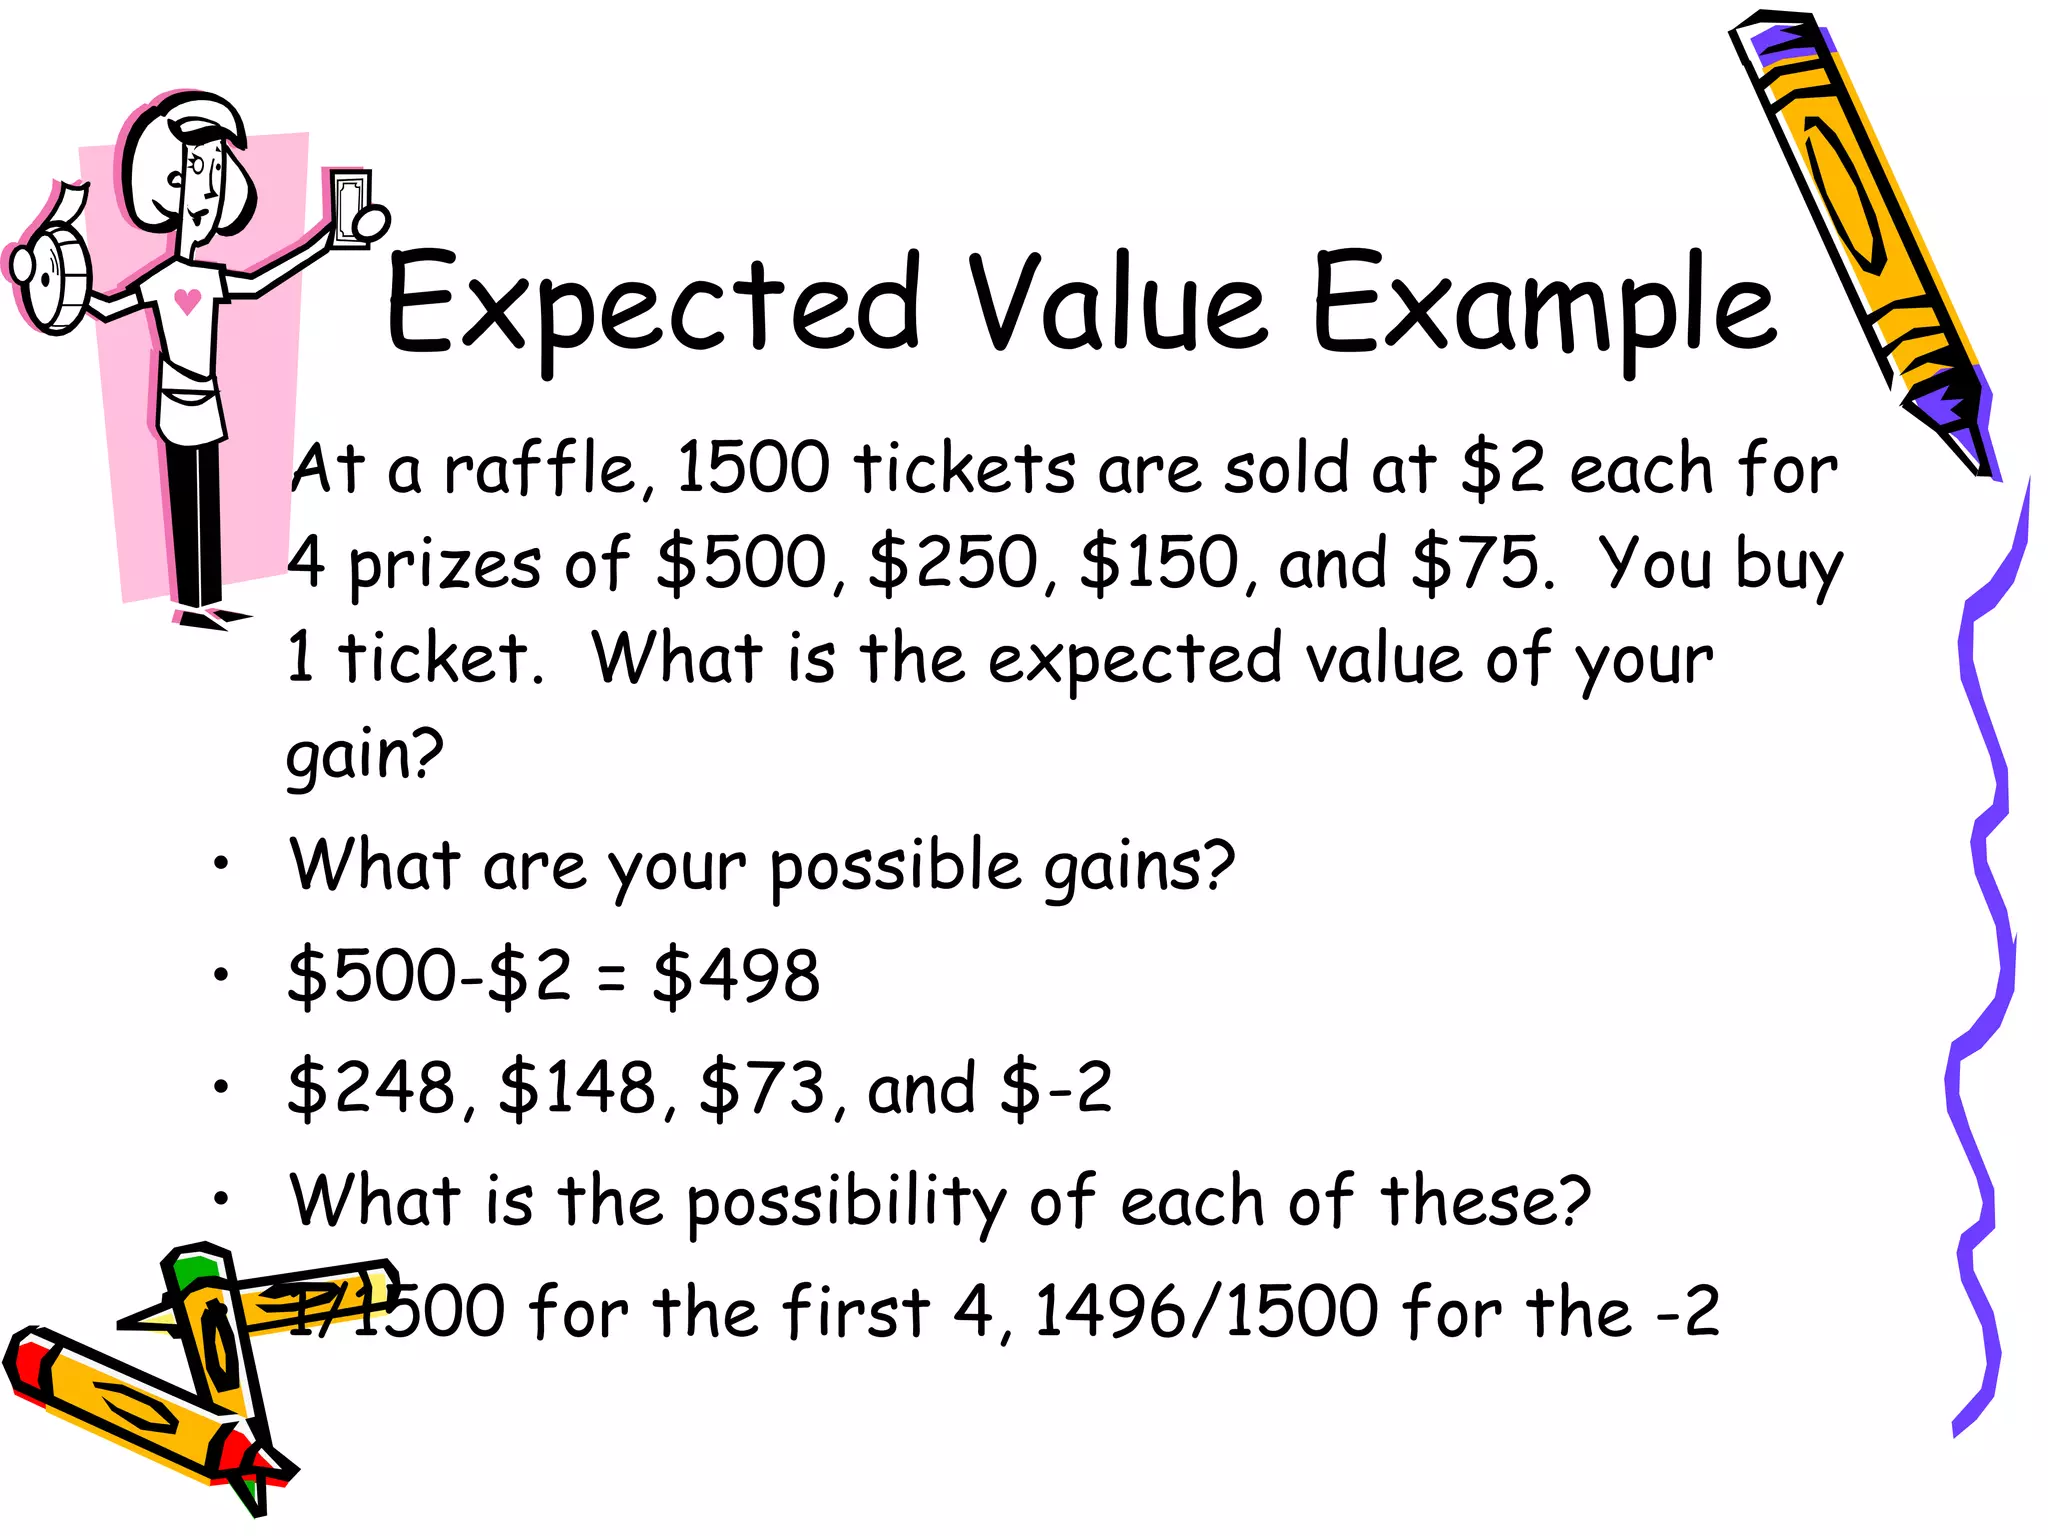
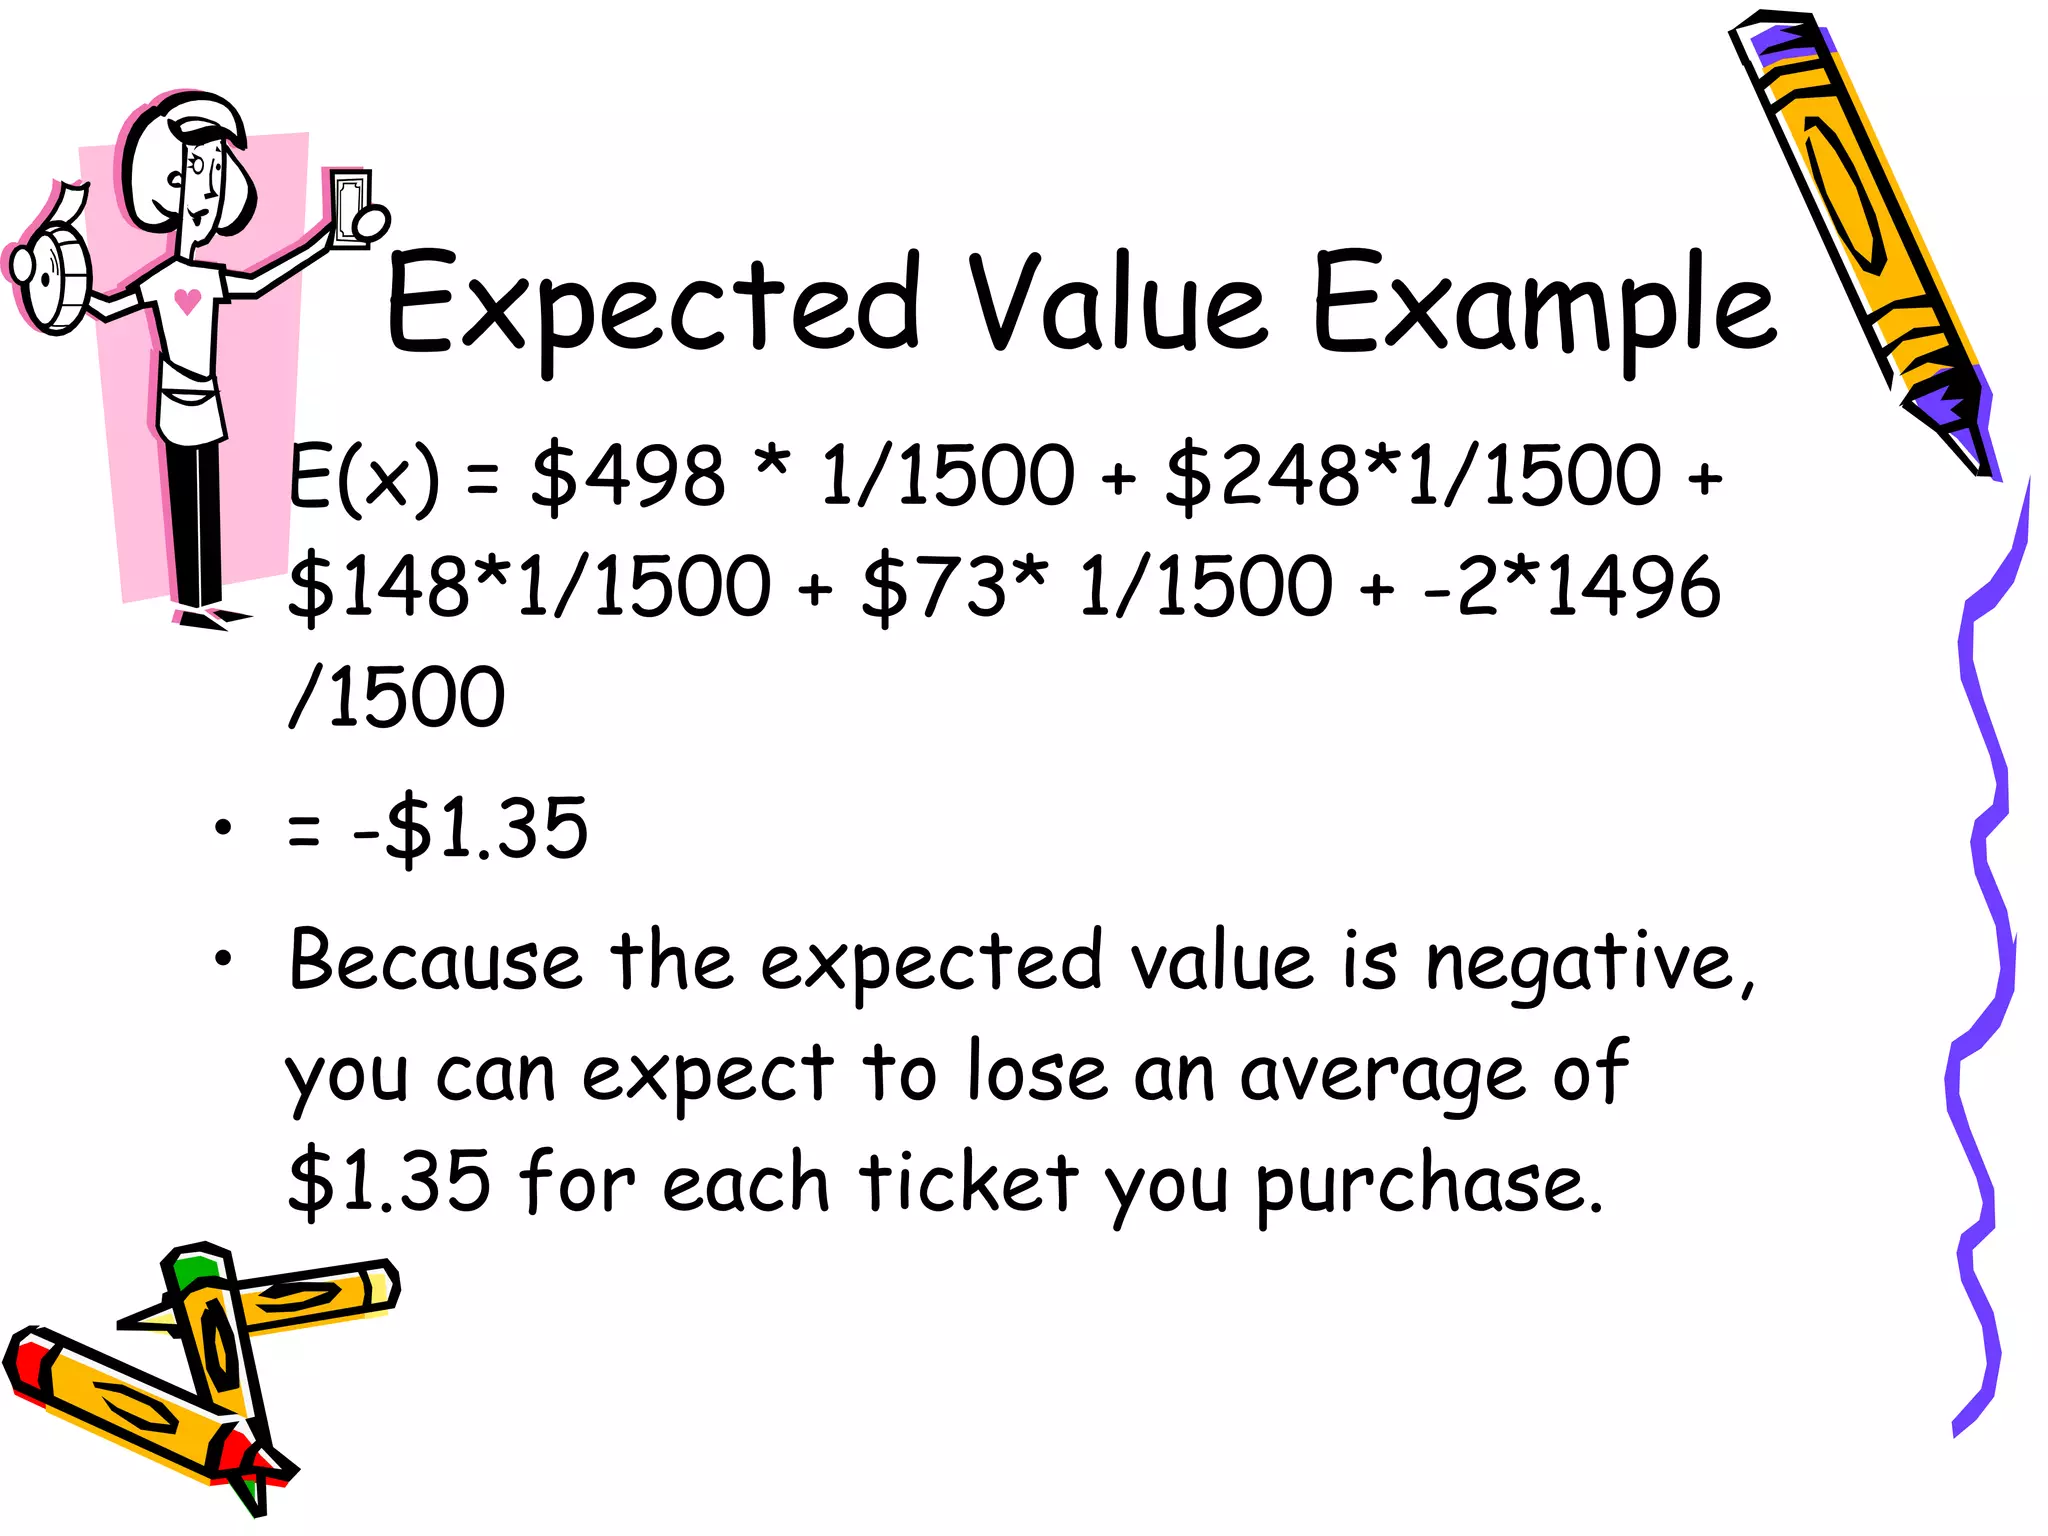
- Calculating the expected value of a discrete random variable from its possible outcomes and probabilities