Download as PDF, PPTX

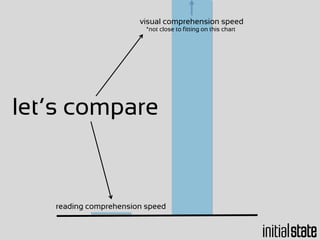

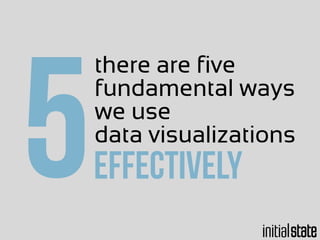
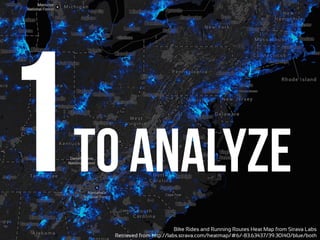
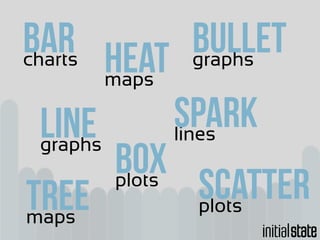
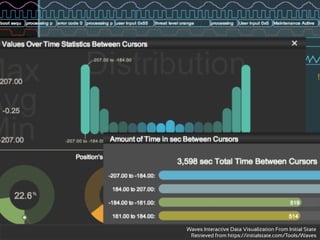
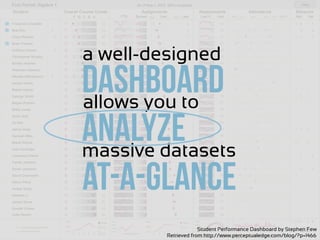
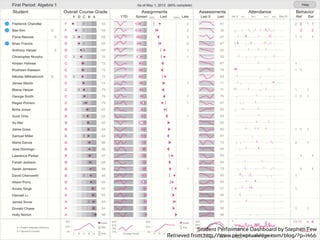

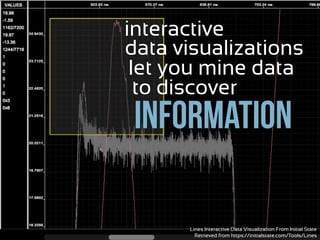
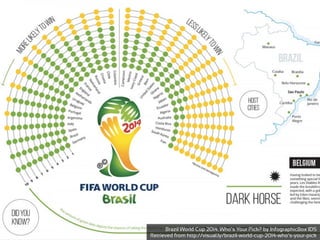

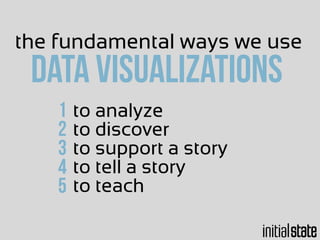


The document discusses 5 fundamental ways that data visualizations are used: 1. To analyze data through visual representations like charts, graphs, maps and plots in order to see trends, anomalies, correlations and patterns. 2. To discover information buried in large datasets through interactive visualizations that allow exploration of data to find unknown information. 3. To support a story by providing context, engaging audiences and emphasizing key points, as effective speakers use visuals to make stories memorable. 4. To tell a story on its own, with some data visualizations serving as the story without text. 5. To teach, as visual learning is more efficient and retains information better than text alone.


![제 23회 보아즈(BOAZ) 빅데이터 컨퍼런스 - [MBOAX] : ABSA를 활용한 소비자 반응 분석 기반 운영 효율화 대시보드 설계](https://cdn.slidesharecdn.com/ss_thumbnails/3-1boaz23rdconferencemboax-260203102709-9d519923-thumbnail.jpg?width=640&height=640&fit=bounds)


