Downloaded 67 times


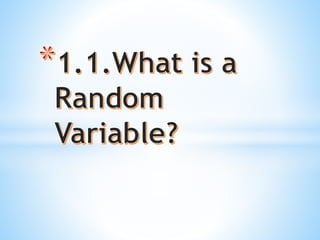
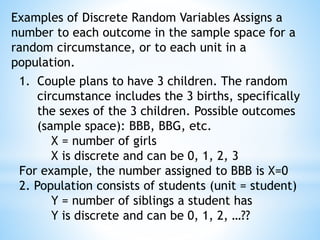


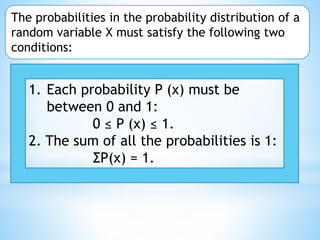
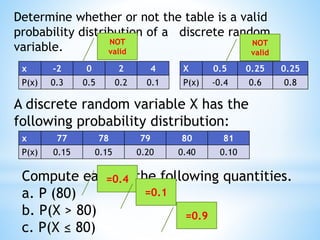
![Definition
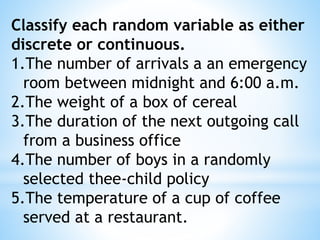
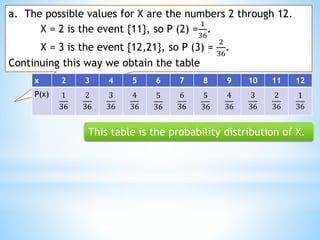
The mean (also called the
expected value) of a discrete random
variable X is the number
μ = Σ [x·P(x)]
The mean of a random variable may be
interpreted as the average of the
values assumed by the random variable
in repeated trials of the experiment.](https://image.slidesharecdn.com/whatisarandomvariable-190713074339/85/Statistics-and-Probability-Random-Variables-and-Probability-Distribution-30-320.jpg)
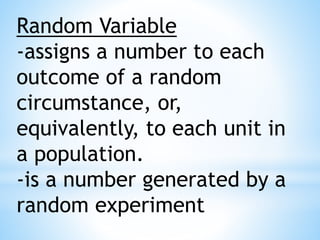
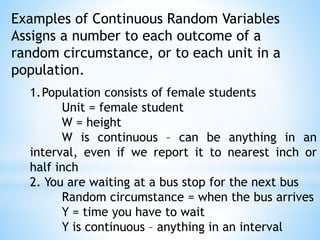
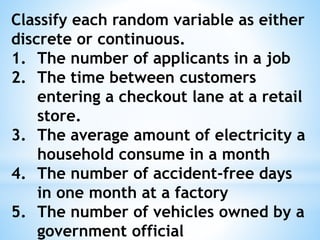
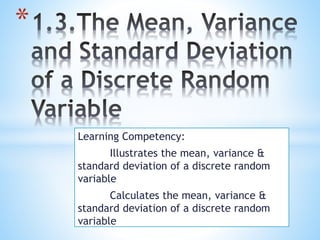
![Definition
The variance, σ2, of a discrete
random variable X is the
number σ2= Σ(x − μ)2P(x)
which by algebra is equivalent
to the formula
σ2=[Σ x2P(x)]−μ2](https://image.slidesharecdn.com/whatisarandomvariable-190713074339/85/Statistics-and-Probability-Random-Variables-and-Probability-Distribution-32-320.jpg)
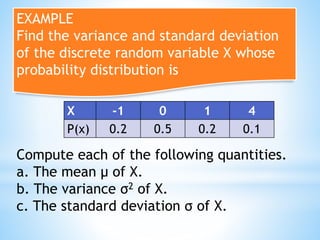
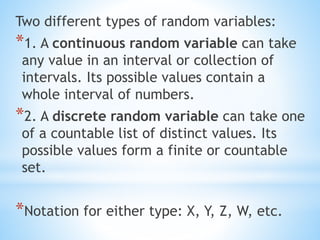
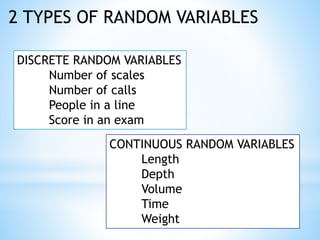
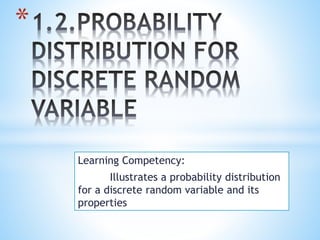
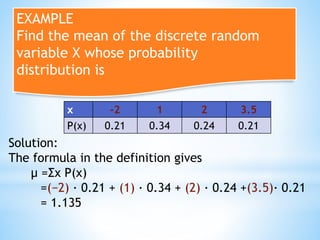
![Solution:
a.Using the formula in the definition of μ,
μ = Σx P (x)
= (−1) · 0.2 + 0 · 0.5 + 1 · 0.2 + 4 · 0.1
= 0.4
b. Using the formula in the definition of σ2 and
the value of μ that was just computed,
σ2=[Σ x2P(x)]−μ2
= [(−1)2 ·0.2 + 02 ·0.5 + 12 ·0.2 + 42 ·0.1]-0.42
=1.84
c. Using the result of b,
σ = 1.84
= 1.3565](https://image.slidesharecdn.com/whatisarandomvariable-190713074339/85/Statistics-and-Probability-Random-Variables-and-Probability-Distribution-35-320.jpg)
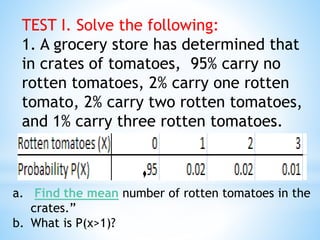

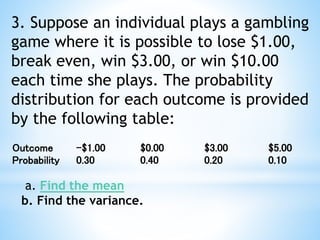
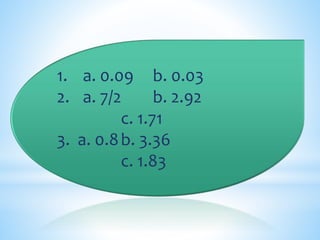
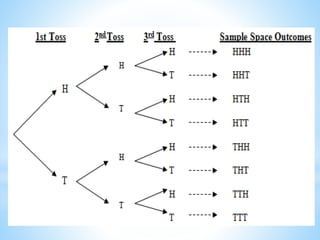
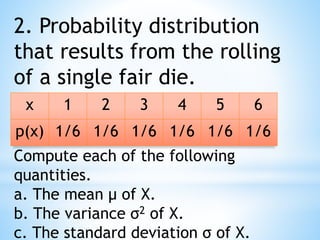

Here are the solutions to the problems: 1. a) Mean = 0.05 rotten tomatoes b) P(x>1) = 0.03 2. a) Mean = 3.5 b) Variance = 35/12 = 2.91667 c) Standard deviation = 1.7321 3. a) Mean = $0.80 b) Variance = $2.40 4. X Probability 0 1/8 1 3/8 2 3/8 3 1/8