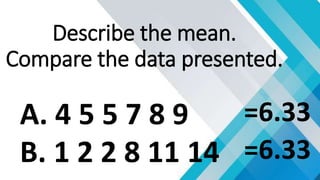
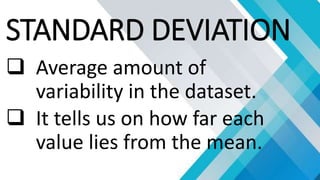
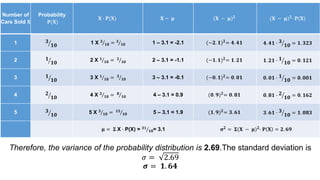
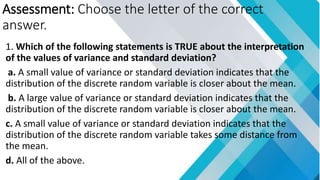
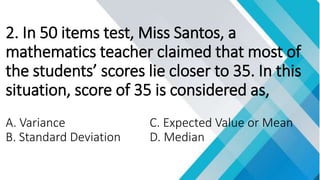
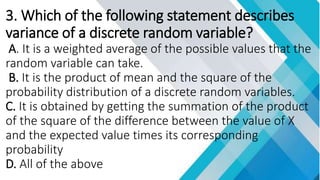
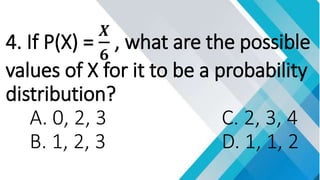
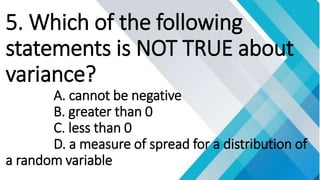
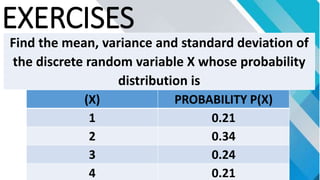
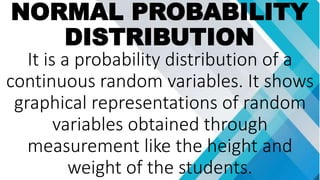
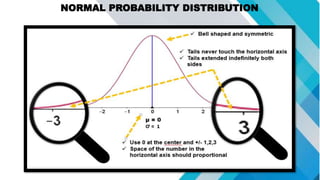
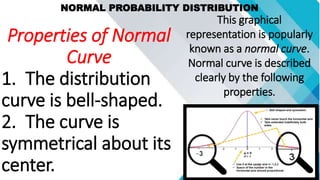
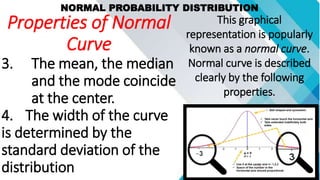
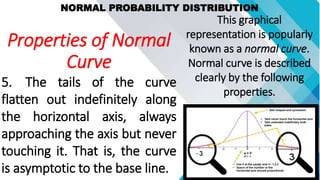
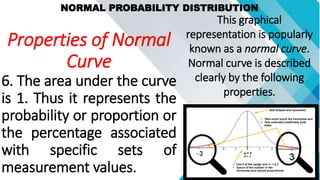
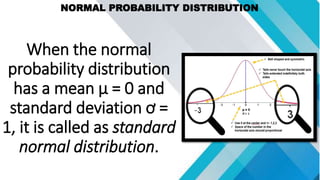
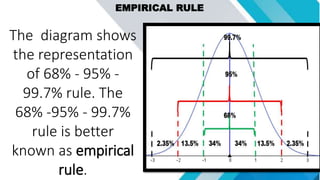
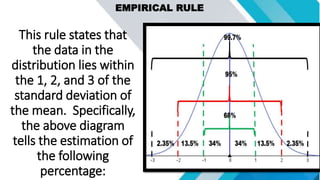
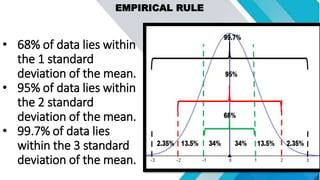
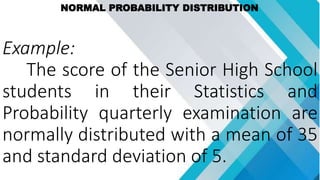
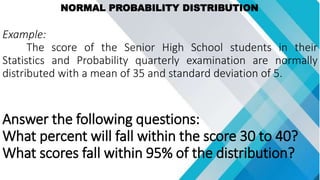
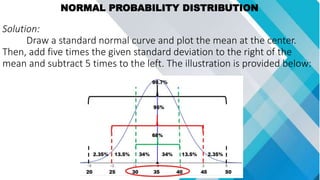
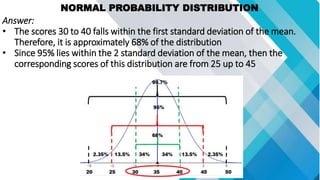
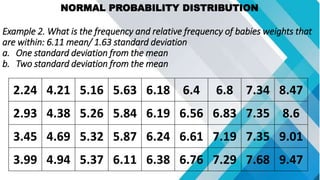
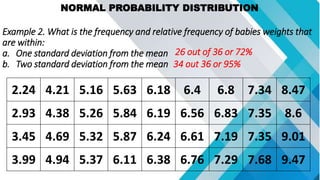
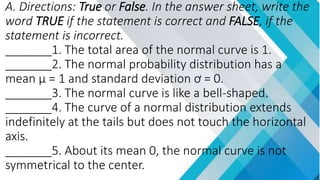
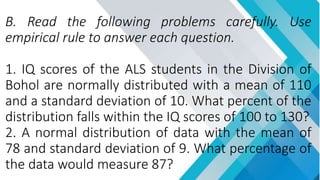
MEAN AND VARIANCE
OF A DISCRETE
RANDOM VARIABLE
A. 4 5 5 7 8 9
B. 1 2 2 8 11 14
CONSIDER THE FOLLOWING
DATA:
A. 4 5 5 7 8 9
B. 1 2 2 8 11 14
FIND THE MEAN.
A. 4 5 5 7 8 9
B. 1 2 2 8 11 14
FIND THE MEAN.
=6.33
=6.33
A. 4 5 5 7 8 9
B. 1 2 2 8 11 14
Describe the mean.
Compare the data presented.
=6.33
=6.33
MEAN
 Average
 The sum of a collection of
numbers divided by the
count of numbers in the
collection.
VARIANCE
Dispersion of data
in the data set.
STANDARD DEVIATION
 Average amount of
variability in the dataset.
 It tells us on how far each
value lies from the mean.
Therefore, the variance of the probability distribution is 2.69.The standard deviation is
𝜎 = 2.69
𝝈 = 𝟏. 𝟔𝟒
Number of
Cars Sold 𝐗
Probability
𝐏(𝐗)
𝐗 ∙ 𝐏(𝐗) 𝐗 − 𝛍 (𝐗 − 𝛍)𝟐
(𝐗 − 𝛍)𝟐
∙ 𝐏(𝐗)
1 𝟑
𝟏𝟎 1 X 𝟑
𝟏𝟎 = 𝟑
𝟏𝟎 1 – 3.1 = -2.1 (−𝟐. 𝟏)𝟐
= 𝟒. 𝟒𝟏 𝟒. 𝟒𝟏 ∙ 𝟑
𝟏𝟎 = 𝟏. 𝟑𝟐𝟑
2 𝟏
𝟏𝟎 2 X 𝟏
𝟏𝟎 = 𝟐
𝟏𝟎 2 – 3.1 = -1.1 (−𝟏. 𝟏)𝟐
= 𝟏. 𝟐𝟏 𝟏. 𝟐𝟏 ∙ 𝟏
𝟏𝟎 = 𝟎. 𝟏𝟐𝟏
3 𝟏
𝟏𝟎 3 X 𝟏
𝟏𝟎 = 𝟑
𝟏𝟎 3 – 3.1 = -0.1 (−𝟎. 𝟏)𝟐
= 𝟎. 𝟎𝟏 𝟎. 𝟎𝟏 ∙ 𝟏
𝟏𝟎 = 𝟎. 𝟎𝟎𝟏
4 𝟐
𝟏𝟎 4 X 𝟐
𝟏𝟎 = 𝟖
𝟏𝟎 4 – 3.1 = 0.9 (𝟎. 𝟗)𝟐
= 𝟎. 𝟖𝟏 𝟎. 𝟖𝟏 ∙ 𝟐
𝟏𝟎 = 𝟎. 𝟏𝟔𝟐
5 𝟑
𝟏𝟎 5 X 𝟑
𝟏𝟎 = 𝟏𝟓
𝟏𝟎 5 – 3.1 = 1.9 (𝟏. 𝟗)𝟐
= 𝟑. 𝟔𝟏 𝟑. 𝟔𝟏 ∙ 𝟑
𝟏𝟎 = 𝟏. 𝟎𝟖𝟑
𝛍 = đšș X ∙ P(X) = 𝟑𝟏
𝟏𝟎= 3.1 𝛔𝟐
= đšș(𝐗 − 𝛍)𝟐
∙ 𝐏 𝐗 = 𝟐. 𝟔𝟗
Assessment: Choose the letter of the correct
answer.
1. Which of the following statements is TRUE about the interpretation
of the values of variance and standard deviation?
a. A small value of variance or standard deviation indicates that the
distribution of the discrete random variable is closer about the mean.
b. A large value of variance or standard deviation indicates that the
distribution of the discrete random variable is closer about the mean.
c. A small value of variance or standard deviation indicates that the
distribution of the discrete random variable takes some distance from
the mean.
d. All of the above.
2. In 50 items test, Miss Santos, a
mathematics teacher claimed that most of
the students’ scores lie closer to 35. In this
situation, score of 35 is considered as,
A. Variance C. Expected Value or Mean
B. Standard Deviation D. Median
3. Which of the following statement describes
variance of a discrete random variable?
A. It is a weighted average of the possible values that the
random variable can take.
B. It is the product of mean and the square of the
probability distribution of a discrete random variables.
C. It is obtained by getting the summation of the product
of the square of the difference between the value of X
and the expected value times its corresponding
probability
D. All of the above
4. If P(X) =
𝑿
𝟔
, what are the possible
values of X for it to be a probability
distribution?
A. 0, 2, 3 C. 2, 3, 4
B. 1, 2, 3 D. 1, 1, 2
5. Which of the following
statements is NOT TRUE about
variance?
A. cannot be negative
B. greater than 0
C. less than 0
D. a measure of spread for a distribution of
a random variable
6. It is a weighted average of the
possible values that the random
variable can take.
A. Mean
B. Variance
C. Standard Deviation
D. Probability Distribution
7. The appropriate formula in
finding the mean of discrete
random variable is
A. E x = ÎŒx = x ∙ p (x)
B. E x = ÎŒx = x + p (x)
C. E x = ÎŒx = x − p (x)
D. E x = ÎŒx = x ∙ p (x)2
8. What formula is used to find the
variance of discrete random
variable?
A. đœŽđ‘„
2
= (đ‘„ + 𝜇)2
∙ 𝑝(đ‘„); for all possible values of x
B. đœŽđ‘„
2
= (đ‘„ − 𝜇)2
∙ 𝑝(đ‘„); for all possible values of X
C. đœŽđ‘„
2
= đ‘„ ∙ 𝑝(đ‘„); for all possible values of x
D. đœŽđ‘„
2
= (𝑃(đ‘„) + 𝜇)2
∙ đ‘„ ; for all possible values of
x
EXERCISES
Find the mean, variance and standard deviation of
the discrete random variable X whose probability
distribution is
(X) PROBABILITY P(X)
1 0.21
2 0.34
3 0.24
4 0.21
NORMAL PROBABILITY
DISTRIBUTION
It is a probability distribution of a
continuous random variables. It shows
graphical representations of random
variables obtained through
measurement like the height and
weight of the students.
NORMAL PROBABILITY DISTRIBUTION
This graphical
representation is popularly
known as a normal curve.
Normal curve is described
clearly by the following
properties.
Properties of Normal
Curve
1. The distribution
curve is bell-shaped.
2. The curve is
symmetrical about its
center.
NORMAL PROBABILITY DISTRIBUTION
This graphical
representation is popularly
known as a normal curve.
Normal curve is described
clearly by the following
properties.
Properties of Normal
Curve
3. The mean, the median
and the mode coincide
at the center.
4. The width of the curve
is determined by the
standard deviation of the
distribution
NORMAL PROBABILITY DISTRIBUTION
This graphical
representation is popularly
known as a normal curve.
Normal curve is described
clearly by the following
properties.
Properties of Normal
Curve
5. The tails of the curve
flatten out indefinitely along
the horizontal axis, always
approaching the axis but never
touching it. That is, the curve
is asymptotic to the base line.
NORMAL PROBABILITY DISTRIBUTION
This graphical
representation is popularly
known as a normal curve.
Normal curve is described
clearly by the following
properties.
Properties of Normal
Curve
6. The area under the curve
is 1. Thus it represents the
probability or proportion or
the percentage associated
with specific sets of
measurement values.
NORMAL PROBABILITY DISTRIBUTION
When the normal
probability distribution
has a mean ” = 0 and
standard deviation ÆĄ =
1, it is called as standard
normal distribution.
EMPIRICAL RULE
The diagram shows
the representation
of 68% - 95% -
99.7% rule. The
68% -95% - 99.7%
rule is better
known as empirical
rule.
EMPIRICAL RULE
This rule states that
the data in the
distribution lies within
the 1, 2, and 3 of the
standard deviation of
the mean. Specifically,
the above diagram
tells the estimation of
the following
percentage:
EMPIRICAL RULE
‱ 68% of data lies within
the 1 standard
deviation of the mean.
‱ 95% of data lies within
the 2 standard
deviation of the mean.
‱ 99.7% of data lies
within the 3 standard
deviation of the mean.
NORMAL PROBABILITY DISTRIBUTION
Example:
The score of the Senior High School
students in their Statistics and
Probability quarterly examination are
normally distributed with a mean of 35
and standard deviation of 5.
NORMAL PROBABILITY DISTRIBUTION
Example:
The score of the Senior High School students in their
Statistics and Probability quarterly examination are normally
distributed with a mean of 35 and standard deviation of 5.
Answer the following questions:
What percent will fall within the score 30 to 40?
What scores fall within 95% of the distribution?
NORMAL PROBABILITY DISTRIBUTION
Solution:
Draw a standard normal curve and plot the mean at the center.
Then, add five times the given standard deviation to the right of the
mean and subtract 5 times to the left. The illustration is provided below:
NORMAL PROBABILITY DISTRIBUTION
Answer:
‱ The scores 30 to 40 falls within the first standard deviation of the mean.
Therefore, it is approximately 68% of the distribution
‱ Since 95% lies within the 2 standard deviation of the mean, then the
corresponding scores of this distribution are from 25 up to 45
NORMAL PROBABILITY DISTRIBUTION
Example 2. What is the frequency and relative frequency of babies weights that
are within: 6.11 mean/ 1.63 standard deviation
a. One standard deviation from the mean
b. Two standard deviation from the mean
2.24 4.21 5.16 5.63 6.18 6.4 6.8 7.34 8.47
2.93 4.38 5.26 5.84 6.19 6.56 6.83 7.35 8.6
3.45 4.69 5.32 5.87 6.24 6.61 7.19 7.35 9.01
3.99 4.94 5.37 6.11 6.38 6.76 7.29 7.68 9.47
NORMAL PROBABILITY DISTRIBUTION
Example 2. What is the frequency and relative frequency of babies weights that
are within:
a. One standard deviation from the mean
b. Two standard deviation from the mean
2.24 4.21 5.16 5.63 6.18 6.4 6.8 7.34 8.47
2.93 4.38 5.26 5.84 6.19 6.56 6.83 7.35 8.6
3.45 4.69 5.32 5.87 6.24 6.61 7.19 7.35 9.01
3.99 4.94 5.37 6.11 6.38 6.76 7.29 7.68 9.47
26 out of 36 or 72%
34 out 36 or 95%
A. Directions: True or False. In the answer sheet, write the
word TRUE if the statement is correct and FALSE, if the
statement is incorrect.
_______1. The total area of the normal curve is 1.
_______2. The normal probability distribution has a
mean ” = 1 and standard deviation ÆĄ = 0.
_______3. The normal curve is like a bell-shaped.
_______4. The curve of a normal distribution extends
indefinitely at the tails but does not touch the horizontal
axis.
_______5. About its mean 0, the normal curve is not
symmetrical to the center.
B. Read the following problems carefully. Use
empirical rule to answer each question.
1. IQ scores of the ALS students in the Division of
Bohol are normally distributed with a mean of 110
and a standard deviation of 10. What percent of the
distribution falls within the IQ scores of 100 to 130?
2. A normal distribution of data with the mean of
78 and standard deviation of 9. What percentage of
the data would measure 87?

wk-2.pptx

  • 1.
    MEAN AND VARIANCE OFA DISCRETE RANDOM VARIABLE
  • 2.
    A. 4 55 7 8 9 B. 1 2 2 8 11 14 CONSIDER THE FOLLOWING DATA:
  • 3.
    A. 4 55 7 8 9 B. 1 2 2 8 11 14 FIND THE MEAN.
  • 4.
    A. 4 55 7 8 9 B. 1 2 2 8 11 14 FIND THE MEAN. =6.33 =6.33
  • 5.
    A. 4 55 7 8 9 B. 1 2 2 8 11 14 Describe the mean. Compare the data presented. =6.33 =6.33
  • 6.
    MEAN  Average  Thesum of a collection of numbers divided by the count of numbers in the collection.
  • 7.
  • 8.
    STANDARD DEVIATION  Averageamount of variability in the dataset.  It tells us on how far each value lies from the mean.
  • 9.
    Therefore, the varianceof the probability distribution is 2.69.The standard deviation is 𝜎 = 2.69 𝝈 = 𝟏. 𝟔𝟒 Number of Cars Sold 𝐗 Probability 𝐏(𝐗) 𝐗 ∙ 𝐏(𝐗) 𝐗 − 𝛍 (𝐗 − 𝛍)𝟐 (𝐗 − 𝛍)𝟐 ∙ 𝐏(𝐗) 1 𝟑 𝟏𝟎 1 X 𝟑 𝟏𝟎 = 𝟑 𝟏𝟎 1 – 3.1 = -2.1 (−𝟐. 𝟏)𝟐 = 𝟒. 𝟒𝟏 𝟒. 𝟒𝟏 ∙ 𝟑 𝟏𝟎 = 𝟏. 𝟑𝟐𝟑 2 𝟏 𝟏𝟎 2 X 𝟏 𝟏𝟎 = 𝟐 𝟏𝟎 2 – 3.1 = -1.1 (−𝟏. 𝟏)𝟐 = 𝟏. 𝟐𝟏 𝟏. 𝟐𝟏 ∙ 𝟏 𝟏𝟎 = 𝟎. 𝟏𝟐𝟏 3 𝟏 𝟏𝟎 3 X 𝟏 𝟏𝟎 = 𝟑 𝟏𝟎 3 – 3.1 = -0.1 (−𝟎. 𝟏)𝟐 = 𝟎. 𝟎𝟏 𝟎. 𝟎𝟏 ∙ 𝟏 𝟏𝟎 = 𝟎. 𝟎𝟎𝟏 4 𝟐 𝟏𝟎 4 X 𝟐 𝟏𝟎 = 𝟖 𝟏𝟎 4 – 3.1 = 0.9 (𝟎. 𝟗)𝟐 = 𝟎. 𝟖𝟏 𝟎. 𝟖𝟏 ∙ 𝟐 𝟏𝟎 = 𝟎. 𝟏𝟔𝟐 5 𝟑 𝟏𝟎 5 X 𝟑 𝟏𝟎 = 𝟏𝟓 𝟏𝟎 5 – 3.1 = 1.9 (𝟏. 𝟗)𝟐 = 𝟑. 𝟔𝟏 𝟑. 𝟔𝟏 ∙ 𝟑 𝟏𝟎 = 𝟏. 𝟎𝟖𝟑 𝛍 = đšș X ∙ P(X) = 𝟑𝟏 𝟏𝟎= 3.1 𝛔𝟐 = đšș(𝐗 − 𝛍)𝟐 ∙ 𝐏 𝐗 = 𝟐. 𝟔𝟗
  • 10.
    Assessment: Choose theletter of the correct answer. 1. Which of the following statements is TRUE about the interpretation of the values of variance and standard deviation? a. A small value of variance or standard deviation indicates that the distribution of the discrete random variable is closer about the mean. b. A large value of variance or standard deviation indicates that the distribution of the discrete random variable is closer about the mean. c. A small value of variance or standard deviation indicates that the distribution of the discrete random variable takes some distance from the mean. d. All of the above.
  • 11.
    2. In 50items test, Miss Santos, a mathematics teacher claimed that most of the students’ scores lie closer to 35. In this situation, score of 35 is considered as, A. Variance C. Expected Value or Mean B. Standard Deviation D. Median
  • 12.
    3. Which ofthe following statement describes variance of a discrete random variable? A. It is a weighted average of the possible values that the random variable can take. B. It is the product of mean and the square of the probability distribution of a discrete random variables. C. It is obtained by getting the summation of the product of the square of the difference between the value of X and the expected value times its corresponding probability D. All of the above
  • 13.
    4. If P(X)= 𝑿 𝟔 , what are the possible values of X for it to be a probability distribution? A. 0, 2, 3 C. 2, 3, 4 B. 1, 2, 3 D. 1, 1, 2
  • 14.
    5. Which ofthe following statements is NOT TRUE about variance? A. cannot be negative B. greater than 0 C. less than 0 D. a measure of spread for a distribution of a random variable
  • 15.
    6. It isa weighted average of the possible values that the random variable can take. A. Mean B. Variance C. Standard Deviation D. Probability Distribution
  • 16.
    7. The appropriateformula in finding the mean of discrete random variable is A. E x = ÎŒx = x ∙ p (x) B. E x = ÎŒx = x + p (x) C. E x = ÎŒx = x − p (x) D. E x = ÎŒx = x ∙ p (x)2
  • 17.
    8. What formulais used to find the variance of discrete random variable? A. đœŽđ‘„ 2 = (đ‘„ + 𝜇)2 ∙ 𝑝(đ‘„); for all possible values of x B. đœŽđ‘„ 2 = (đ‘„ − 𝜇)2 ∙ 𝑝(đ‘„); for all possible values of X C. đœŽđ‘„ 2 = đ‘„ ∙ 𝑝(đ‘„); for all possible values of x D. đœŽđ‘„ 2 = (𝑃(đ‘„) + 𝜇)2 ∙ đ‘„ ; for all possible values of x
  • 18.
    EXERCISES Find the mean,variance and standard deviation of the discrete random variable X whose probability distribution is (X) PROBABILITY P(X) 1 0.21 2 0.34 3 0.24 4 0.21
  • 19.
    NORMAL PROBABILITY DISTRIBUTION It isa probability distribution of a continuous random variables. It shows graphical representations of random variables obtained through measurement like the height and weight of the students.
  • 20.
  • 21.
    NORMAL PROBABILITY DISTRIBUTION Thisgraphical representation is popularly known as a normal curve. Normal curve is described clearly by the following properties. Properties of Normal Curve 1. The distribution curve is bell-shaped. 2. The curve is symmetrical about its center.
  • 22.
    NORMAL PROBABILITY DISTRIBUTION Thisgraphical representation is popularly known as a normal curve. Normal curve is described clearly by the following properties. Properties of Normal Curve 3. The mean, the median and the mode coincide at the center. 4. The width of the curve is determined by the standard deviation of the distribution
  • 23.
    NORMAL PROBABILITY DISTRIBUTION Thisgraphical representation is popularly known as a normal curve. Normal curve is described clearly by the following properties. Properties of Normal Curve 5. The tails of the curve flatten out indefinitely along the horizontal axis, always approaching the axis but never touching it. That is, the curve is asymptotic to the base line.
  • 24.
    NORMAL PROBABILITY DISTRIBUTION Thisgraphical representation is popularly known as a normal curve. Normal curve is described clearly by the following properties. Properties of Normal Curve 6. The area under the curve is 1. Thus it represents the probability or proportion or the percentage associated with specific sets of measurement values.
  • 25.
    NORMAL PROBABILITY DISTRIBUTION Whenthe normal probability distribution has a mean ” = 0 and standard deviation ÆĄ = 1, it is called as standard normal distribution.
  • 26.
    EMPIRICAL RULE The diagramshows the representation of 68% - 95% - 99.7% rule. The 68% -95% - 99.7% rule is better known as empirical rule.
  • 27.
    EMPIRICAL RULE This rulestates that the data in the distribution lies within the 1, 2, and 3 of the standard deviation of the mean. Specifically, the above diagram tells the estimation of the following percentage:
  • 28.
    EMPIRICAL RULE ‱ 68%of data lies within the 1 standard deviation of the mean. ‱ 95% of data lies within the 2 standard deviation of the mean. ‱ 99.7% of data lies within the 3 standard deviation of the mean.
  • 29.
    NORMAL PROBABILITY DISTRIBUTION Example: Thescore of the Senior High School students in their Statistics and Probability quarterly examination are normally distributed with a mean of 35 and standard deviation of 5.
  • 30.
    NORMAL PROBABILITY DISTRIBUTION Example: Thescore of the Senior High School students in their Statistics and Probability quarterly examination are normally distributed with a mean of 35 and standard deviation of 5. Answer the following questions: What percent will fall within the score 30 to 40? What scores fall within 95% of the distribution?
  • 31.
    NORMAL PROBABILITY DISTRIBUTION Solution: Drawa standard normal curve and plot the mean at the center. Then, add five times the given standard deviation to the right of the mean and subtract 5 times to the left. The illustration is provided below:
  • 32.
    NORMAL PROBABILITY DISTRIBUTION Answer: ‱The scores 30 to 40 falls within the first standard deviation of the mean. Therefore, it is approximately 68% of the distribution ‱ Since 95% lies within the 2 standard deviation of the mean, then the corresponding scores of this distribution are from 25 up to 45
  • 33.
    NORMAL PROBABILITY DISTRIBUTION Example2. What is the frequency and relative frequency of babies weights that are within: 6.11 mean/ 1.63 standard deviation a. One standard deviation from the mean b. Two standard deviation from the mean 2.24 4.21 5.16 5.63 6.18 6.4 6.8 7.34 8.47 2.93 4.38 5.26 5.84 6.19 6.56 6.83 7.35 8.6 3.45 4.69 5.32 5.87 6.24 6.61 7.19 7.35 9.01 3.99 4.94 5.37 6.11 6.38 6.76 7.29 7.68 9.47
  • 34.
    NORMAL PROBABILITY DISTRIBUTION Example2. What is the frequency and relative frequency of babies weights that are within: a. One standard deviation from the mean b. Two standard deviation from the mean 2.24 4.21 5.16 5.63 6.18 6.4 6.8 7.34 8.47 2.93 4.38 5.26 5.84 6.19 6.56 6.83 7.35 8.6 3.45 4.69 5.32 5.87 6.24 6.61 7.19 7.35 9.01 3.99 4.94 5.37 6.11 6.38 6.76 7.29 7.68 9.47 26 out of 36 or 72% 34 out 36 or 95%
  • 35.
    A. Directions: Trueor False. In the answer sheet, write the word TRUE if the statement is correct and FALSE, if the statement is incorrect. _______1. The total area of the normal curve is 1. _______2. The normal probability distribution has a mean ” = 1 and standard deviation ÆĄ = 0. _______3. The normal curve is like a bell-shaped. _______4. The curve of a normal distribution extends indefinitely at the tails but does not touch the horizontal axis. _______5. About its mean 0, the normal curve is not symmetrical to the center.
  • 36.
    B. Read thefollowing problems carefully. Use empirical rule to answer each question. 1. IQ scores of the ALS students in the Division of Bohol are normally distributed with a mean of 110 and a standard deviation of 10. What percent of the distribution falls within the IQ scores of 100 to 130? 2. A normal distribution of data with the mean of 78 and standard deviation of 9. What percentage of the data would measure 87?