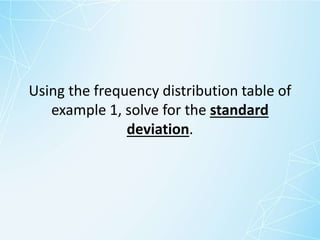
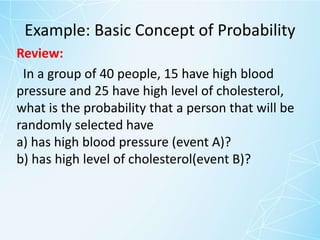
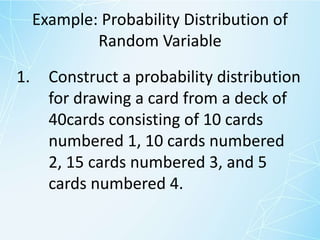
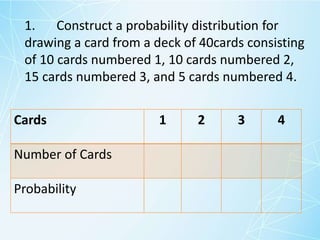
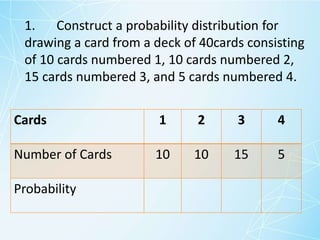
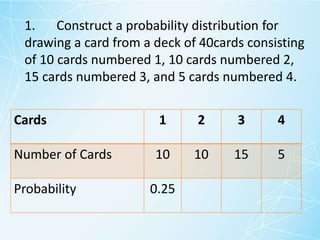
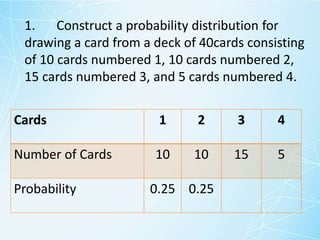
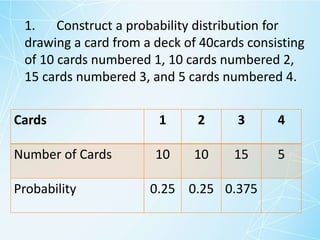
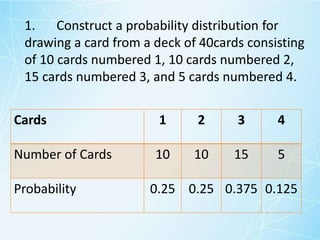
The document discusses discrete random variables and their probability distributions, outlining essential definitions and requirements for valid distributions. It includes examples of calculating probabilities from various scenarios and constructing probability distributions, as well as determining the mean, variance, and standard deviation of discrete random variables. Additionally, it provides references for further study on the topic.
![Formulas
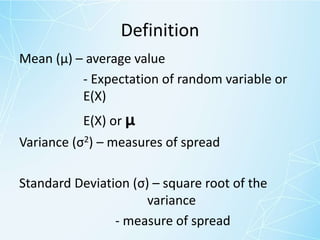
Formula:
Mean: μ = ∑ (x)[p(x)]
Variance: σ2 = ∑ (x – μ) 2 p(x)
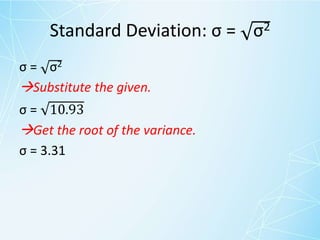
Standard Deviation: σ = σ2](https://image.slidesharecdn.com/discreterandomvariable-200417124112/85/Discrete-Random-Variable-Probability-Distribution-18-320.jpg)
![Mean: μ = ∑ (x)[p(x)]
μ = ∑ (x)[p(x)]
Substitute the given.
μ = (10 x 0.25) + (10 x 0.25) + (15 x 0.375) + (5 x 0.125)
Multiply
μ = 2.5 + 2.5 + 5.625 + 0.625
Add
μ = 11.25](https://image.slidesharecdn.com/discreterandomvariable-200417124112/85/Discrete-Random-Variable-Probability-Distribution-21-320.jpg)
![Variance: σ2 = ∑ (x – μ) 2 p(x)
σ2 = ∑ (x – μ) 2 p(x)
Substitute the given
= [(10 – 11.25) 2 (0.25)] + [(10 – 11.25) 2 (0.25)] +
[(15 – 11.25) 2 (0.375)] + [(5 – 11.25) 2 (0.125)]
Perform the operation
= 0.39 + 0.39 + 5.27 + 4.88
Add
= 10.93](https://image.slidesharecdn.com/discreterandomvariable-200417124112/85/Discrete-Random-Variable-Probability-Distribution-23-320.jpg)