FINAL Mean and Variance of Discrete Random Variable-1.pptx
1.
Mean and Varianceof Discrete
Random Variable
BY :AAYUSH
:RAHUL
:SEJAL
2.
What We aregoing to Explore
● Illustrate the mean and variance of a discrete random variable;
● Calculate the mean and the variance of a discrete random variable;
● Interpret the mean and the variance of a discrete random variable;
and
● Solve problems involving mean and variance of probability
distributions.
3.
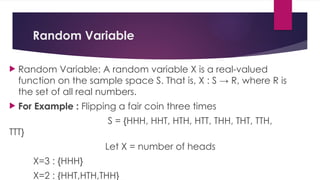
Random Variable
RandomVariable: A random variable X is a real-valued
function on the sample space S. That is, X : S → R, where R is
the set of all real numbers.
For Example : Flipping a fair coin three times
S = {HHH, HHT, HTH, HTT, THH, THT, TTH,
TTT}
Let X = number of heads
X=3 : {HHH}
X=2 : {HHT,HTH,THH}
4.
Probability Distributions forDiscrete
Random Variables
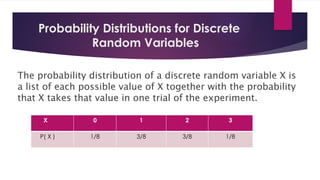
The probability distribution of a discrete random variable X is
a list of each possible value of X together with the probability
that X takes that value in one trial of the experiment.
X 0 1 2 3
P( X ) 1/8 3/8 3/8 1/8
5.
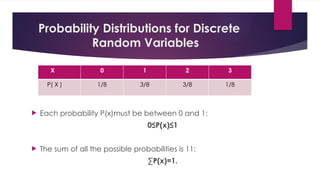
Probability Distributions forDiscrete
Random Variables
Each probability P(x)must be between 0 and 1:
0≤P(x)≤1
The sum of all the possible probabilities is 11:
∑P(x)=1.
X 0 1 2 3
P( X ) 1/8 3/8 3/8 1/8
6.
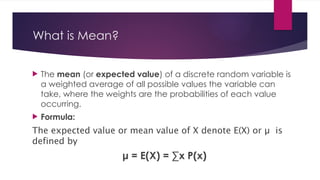
What is Mean?
The mean (or expected value) of a discrete random variable is
a weighted average of all possible values the variable can
take, where the weights are the probabilities of each value
occurring.
Formula:
The expected value or mean value of X denote E(X) or µ is
defined by
μ = E(X) = ∑x P(x)
7.
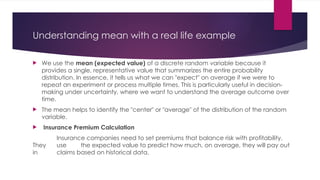
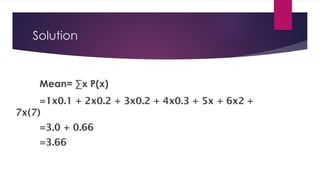
Understanding mean witha real life example
We use the mean (expected value) of a discrete random variable because it
provides a single, representative value that summarizes the entire probability
distribution. In essence, it tells us what we can "expect" on average if we were to
repeat an experiment or process multiple times. This is particularly useful in decision-
making under uncertainty, where we want to understand the average outcome over
time.
The mean helps to identify the "center" or "average" of the distribution of the random
variable.
Insurance Premium Calculation
Insurance companies need to set premiums that balance risk with profitability.
They use the expected value to predict how much, on average, they will pay out
in claims based on historical data.
8.
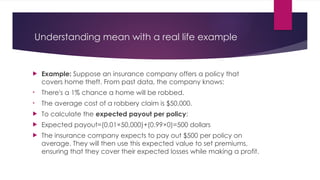
Understanding mean witha real life example
Example: Suppose an insurance company offers a policy that
covers home theft. From past data, the company knows:
• There's a 1% chance a home will be robbed.
• The average cost of a robbery claim is $50,000.
To calculate the expected payout per policy:
Expected payout=(0.01×50,000)+(0.99×0)=500 dollars
The insurance company expects to pay out $500 per policy on
average. They will then use this expected value to set premiums,
ensuring that they cover their expected losses while making a profit.
9.
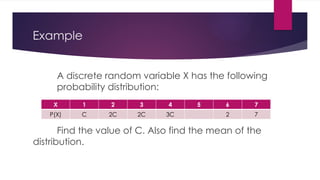
Example
A discrete randomvariable X has the following
probability distribution:
Find the value of C. Also find the mean of the
distribution.
X 1 2 3 4 5 6 7
P(X) C 2C 2C 3C 2 7
10.
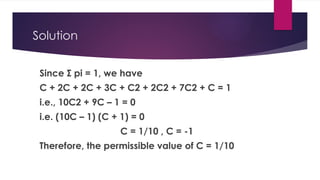
Solution
Since Σ pi= 1, we have
C + 2C + 2C + 3C + C2 + 2C2 + 7C2 + C = 1
i.e., 10C2 + 9C – 1 = 0
i.e. (10C – 1) (C + 1) = 0
C = 1/10 , C = -1
Therefore, the permissible value of C = 1/10
About variance
•Variance measures the average squared
deviation of each value from the mean.
Var ( ) = [] =
𝑋 𝐸
Var ( )
𝑋 =
∑
𝑖=1
𝑛
(𝑥𝑖 −𝜇)
2
𝑃𝑖
13.
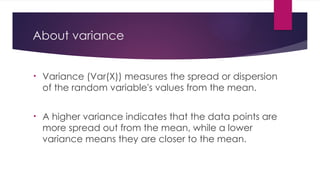
About variance
• Variance(Var(X)) measures the spread or dispersion
of the random variable's values from the mean.
• A higher variance indicates that the data points are
more spread out from the mean, while a lower
variance means they are closer to the mean.
14.
Standard deviation
Thestandard deviation, σ, of a discrete random
variable X is the square root of its variance.
15.
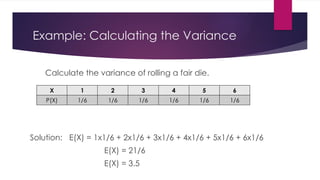
Example: Calculating theVariance
Calculate the variance of rolling a fair die.
Solution: E(X) = 1x1/6 + 2x1/6 + 3x1/6 + 4x1/6 + 5x1/6 + 6x1/6
E(X) = 21/6
E(X) = 3.5
X 1 2 3 4 5 6
P(X) 1/6 1/6 1/6 1/6 1/6 1/6
16.
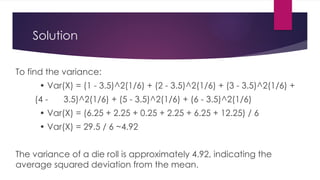
Solution
To find thevariance:
• Var(X) = (1 - 3.5)^2(1/6) + (2 - 3.5)^2(1/6) + (3 - 3.5)^2(1/6) +
(4 - 3.5)^2(1/6) + (5 - 3.5)^2(1/6) + (6 - 3.5)^2(1/6)
• Var(X) = (6.25 + 2.25 + 0.25 + 2.25 + 6.25 + 12.25) / 6
• Var(X) = 29.5 / 6 ~4.92
The variance of a die roll is approximately 4.92, indicating the
average squared deviation from the mean.
17.
Real Life Applicationof Variance
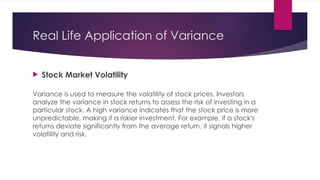
Stock Market Volatility
Variance is used to measure the volatility of stock prices. Investors
analyze the variance in stock returns to assess the risk of investing in a
particular stock. A high variance indicates that the stock price is more
unpredictable, making it a riskier investment. For example, if a stock's
returns deviate significantly from the average return, it signals higher
volatility and risk.


![About variance
• Variance measures the average squared
deviation of each value from the mean.
Var ( ) = [] =
𝑋 𝐸
Var ( )
𝑋 =
∑
𝑖=1
𝑛
(𝑥𝑖 −𝜇)
2
𝑃𝑖](https://image.slidesharecdn.com/finalmeanandvarianceofdiscreterandomvariable-1-250920184030-138c7066/85/FINAL-Mean-and-Variance-of-Discrete-Random-Variable-1-pptx-12-320.jpg)