Downloaded 170 times


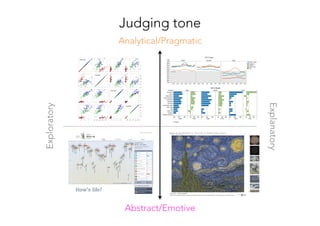
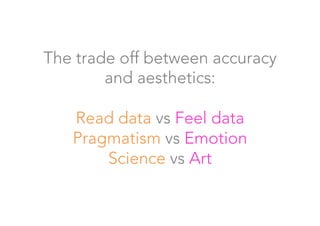
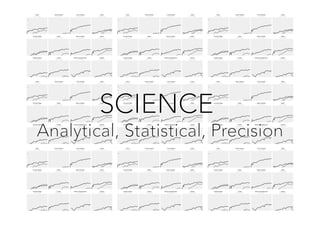
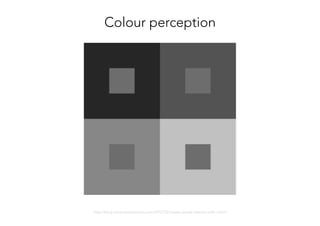
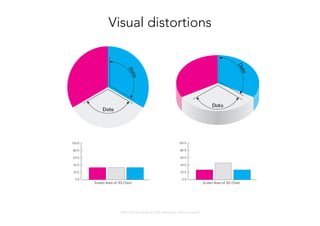
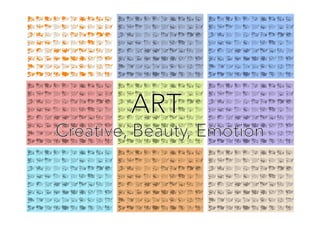


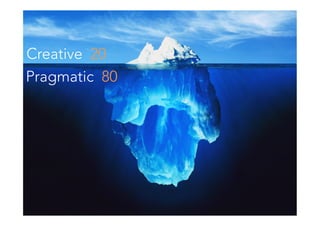

The document discusses the balance between form and function in data visualization, emphasizing the contrast between analytical/pragmatic and emotive approaches. It includes perspectives from various experts on the importance of effective communication through visual means, highlighting that understanding human perception is crucial for creating impactful visualizations. It also stresses that while aesthetics matter, the ultimate goal is to enhance data readability and user engagement.