This presentation helps the students to find the possible values of a random variable. M11/12SP-IIIa-3
and llustrate a probability distribution for a discrete
random variable and its properties.
INSTRUCTIONS:
•The students willhave a race in getting the ball.
•The teacher will randomly pause or stop the
music at any point during the song.
•When the music stops, the student who is not
holding the ball must answer a question
5.
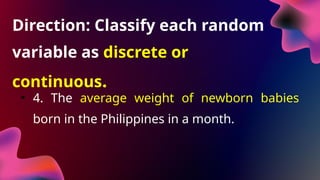
Direction: Classify eachrandom
variable as discrete or
continuous.
• 1. The number of coins that match when
three coins are tossed at once.
6.
Direction: Classify eachrandom
variable as discrete or
continuous.
• 2. The number of games in the next World
Cup Series (best of four up to seven games).
7.
Direction: Classify eachrandom
variable as discrete or
continuous.
• 3. The amount of liquid in a 12-ounce can of
soft drink.
8.
Direction: Classify eachrandom
variable as discrete or
continuous.
• 4. The average weight of newborn babies
born in the Philippines in a month.
9.
Direction: Classify eachrandom
variable as discrete or
continuous.
• 5. The number of heads in two tosses of coin.
INSTRUCTIONS:
1. Divide theclass into six groups.
2. Give each group a flower with a hidden task to
solve.
3. After solving it, one member gets a secret
question from the teacher.
4. Answering the question earns the group 5 points.
12.
QUESTIONS:
• a. Whatdo you call to the value
that we got from our activity?
• b. How do you define mean?
OBJECTIVES:
At the endof the lesson, the students are expected
to:
a. discuss the definition and formula for the value
of mean;
b. calculate the mean of a discrete random variable
using real-life problems; and
c. interpret the result of the mean of a discrete
random variable.
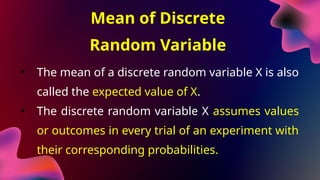
Mean of Discrete
RandomVariable
• The mean of a discrete random variable X is also
called the expected value of X.
• The discrete random variable X assumes values
or outcomes in every trial of an experiment with
their corresponding probabilities.
Mean of Discrete
RandomVariable
• • We can get the mean or expected value of the
probability distribution by getting the sum of the
values under the third column.
• We use the formula:
E(x) = [ x . P(x) ]
∑
19.
• A researchersurveyed the
households in a small town. The
random variable X represents
the number of college
graduates in the households.
The probability distribution of X
is shown on the right. Find the
expected value of the number
of college graudates in the
households
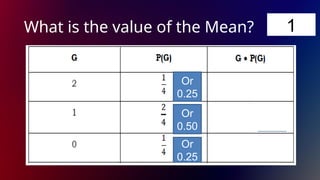
20.
Example 2.
Grade 11students were asked to estimate the
length (in inches) of a table. The error in the
estimated values were recorded and
tabulated as follows:
21.
Example 2.
E(x) =[ x . P(x) ]
∑
= [ (2) ( 0.25) + (3) (0.10) + (4) (0.30) + (5) (0.15) + (6) (0.20) ]
=( 0.5 + 0.3 + 1.2 + 0.75 + 1.2 )
= 3.95 is the average error in the estimated values that were
recorded
22.
• In Grade11 ICT 4 students , the PE teacher is studying the
Body Mass Index (BMI) of students to understand their
health profiles better. The teacher categorizes the BMI into
four distinct groups with the following probabilities:
• 1. Underweight (less than 18.5): Probability = 0.30
• 2. Normal Weight (between 18.5 and 24.9) : Probability= 0.54
• 3. Over Weight ( between 25 and 29.9): Probability= 0.09
• 4. Obesity (greater than 30): Probability= 0.07
23.
• The teacherwants to calculate the Mean category of BMI
among students using the probabilities. For calculation
purposes, the teacher assign the categories numerical
values, such as:
Underweight = 1 Normal Weight = 2
Over Weight =3 Obesity =4
24.
Follow-up Questions:
• 1.If you are underweight, how will you
improve your nutritional status?
• 2. If you have a normal BMI, how will
you maintain your nutritional status?
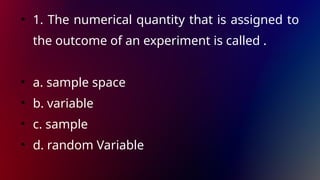
• 1. Thenumerical quantity that is assigned to
the outcome of an experiment is called .
• a. sample space
• b. variable
• c. sample
• d. random Variable
28.
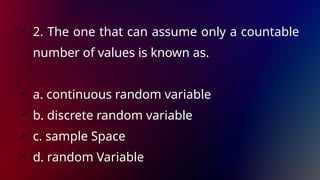
• 2. Theone that can assume only a countable
number of values is known as.
• a. continuous random variable
• b. discrete random variable
• c. sample Space
• d. random Variable
29.
• 3. Therandom variable that can assume an
infinite number of values in one or more
intervals is called .
• a. continuous random variable
• b. discrete random variable
• c. sample Space
• d. random Variable
30.
• 4. Thediscrete random variable is generated
from an experiment in which things are
counted but not measured.
• a. True
• b. False
• c. Neither
• d. Either
31.
• 5. Thefollowing statements are examples of discrete
random variable, except,
• a. the number of senators present in the franchise
hearing
• b. the number of chalks in the box
• c. the number of frontliners who are positive of
COVID-19
• d. the length of wire ropes
32.
• 6. Thefollowing statements are examples of
continuous random variable, except,
• a. the area of lots in a subdivision
• b. the time it takes the virus stay on surfaces
• c. the number of learners who joined the online class
• d. the weight of newborn babies for the month of
May
33.
• 7. Thecorrespondence that assigns
probabilities to the values of a random
variable.
• a. Probability Distribution
• b. Random Variable
• c. Continuous Random Variable
• d. Discrete Random Variable
34.
• 8. Itis a graph that displays the possible values of
discrete random variable on the horizontal axis and
the probabilities of those values on the vertical axis.
• a. Bar graph
• b. Line Graph
• c. Pie Chart
• d. Probability histogram
35.
• 9. Itassociates to any given number the probability
that the random variable will be equal to that
number.
• a. Probability Mass Function
• b. Probability histogram
• c. Continuous Random Variable
• d. Discrete Random Variable
36.
• 10. Theset of all possible outcomes of an
experiment.
• a. Sample space
• b. Variable
• c. Sample
• d. Random Variable
37.
• 10. Theset of all possible outcomes of an
experiment.
• a. Sample space
• b. Variable
• c. Sample
• d. Random Variable
38.
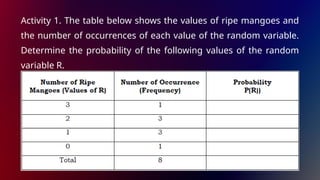
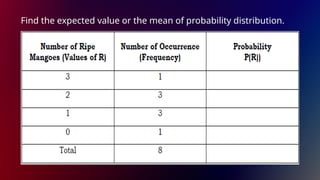
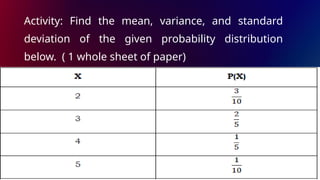
Activity 1. Thetable below shows the values of ripe mangoes and
the number of occurrences of each value of the random variable.
Determine the probability of the following values of the random
variable R.
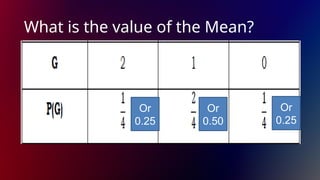
Activity 2: Twoballs are drawn in succession
without replacement from a jar containing 4
green balls and 3 orange balls. What is the
probability distribution for the number of
green balls? Then, solve for the mean, variance,
and the standard deviation of the probability
distribution.
42.
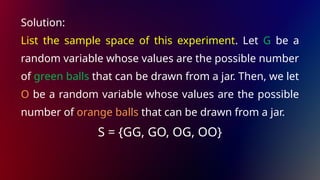
Solution:
List the samplespace of this experiment. Let G be a
random variable whose values are the possible number
of green balls that can be drawn from a jar. Then, we let
O be a random variable whose values are the possible
number of orange balls that can be drawn from a jar.
S = {GG, GO, OG, OO}
43.
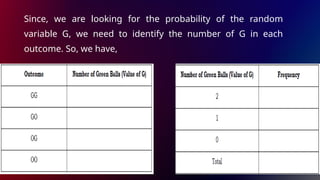
Since, we arelooking for the probability of the random
variable G, we need to identify the number of G in each
outcome. So, we have,


![Mean of Discrete
Random Variable
• • We can get the mean or expected value of the
probability distribution by getting the sum of the
values under the third column.
• We use the formula:
E(x) = [ x . P(x) ]
∑](https://image.slidesharecdn.com/module2-250216215628-800c0efd/85/MODULE-2-3rd-Quarter-in-Statistics-pptx-18-320.jpg)


![Example 2.
E(x) = [ x . P(x) ]
∑
= [ (2) ( 0.25) + (3) (0.10) + (4) (0.30) + (5) (0.15) + (6) (0.20) ]
=( 0.5 + 0.3 + 1.2 + 0.75 + 1.2 )
= 3.95 is the average error in the estimated values that were
recorded](https://image.slidesharecdn.com/module2-250216215628-800c0efd/85/MODULE-2-3rd-Quarter-in-Statistics-pptx-21-320.jpg)


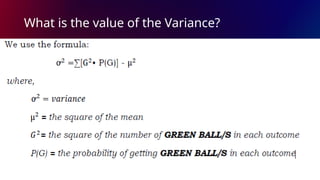
![What is the value of the Variance?
We use the formula:
Ơ^2=Σ[G^2• P(G)] – μ^2
Or
0.50
Or
0.50
Or
0.50](https://image.slidesharecdn.com/module2-250216215628-800c0efd/85/MODULE-2-3rd-Quarter-in-Statistics-pptx-49-320.jpg)


![1 Random Variables and Probability Distribution [Autosaved].pptx](https://cdn.slidesharecdn.com/ss_thumbnails/1randomvariablesandprobabilitydistributionautosaved-260112020748-810f0580-thumbnail.jpg?width=640&height=640&fit=bounds)


