This document provides an overview of random variables and various discrete probability distributions. It defines random variables and describes discrete and continuous random variables. It also covers the mean, variance, and standard deviation of discrete random variables. Various discrete probability distributions are introduced, including the discrete uniform distribution, Bernoulli distribution, and binomial distribution. Examples are provided to illustrate key concepts.


![
)]
(
2
)
(
2 x
P
x
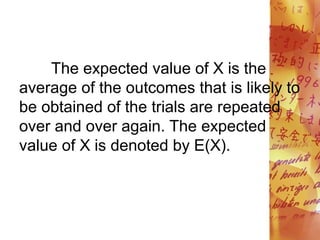
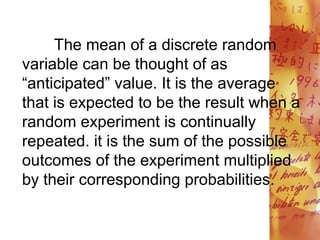
The mean or expected value of a
discrete random variable X is compted
using the following formula:
where: X= discrete random variable
x= outcome or the value of
random variable
P(x)= probability of the outcome x](https://image.slidesharecdn.com/understanding-key-concepts-of-probability-and-random-variables-through-examples-240201061942-f0e900f5/85/understanding-key-concepts-of-probability-and-random-variables-through-examples-pdf-21-320.jpg)

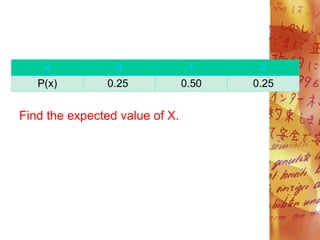


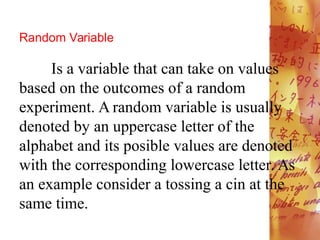
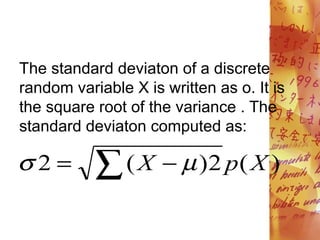
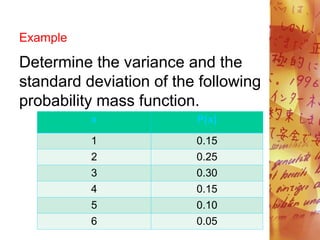
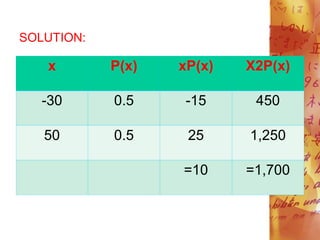
![Variance and Standard Deviation of a Discrete
Random Variable
The variance of a random variable X is
denoted by o2. It can likewise be written as Var
(X). The variance of a random variable is the
expected value of the square of the difference
between the assumed value of random variable
and the mean. The variance of X is:
)]
(
2
)
(
2 x
P
x
](https://image.slidesharecdn.com/understanding-key-concepts-of-probability-and-random-variables-through-examples-240201061942-f0e900f5/85/understanding-key-concepts-of-probability-and-random-variables-through-examples-pdf-27-320.jpg)
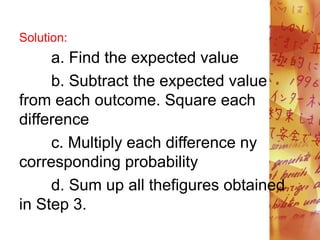
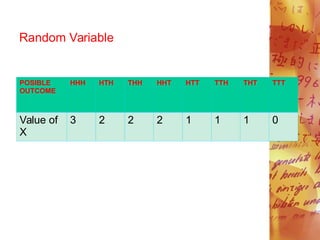
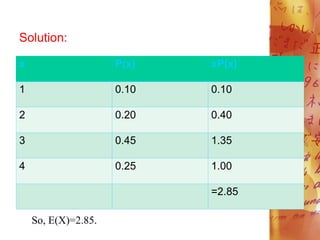
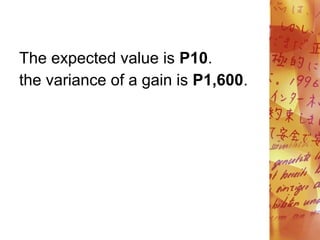
![E(X)= 2. 95
=1.8475 or 1.85
Therefore, the standard deviation
is 1.85.
)]
(
2
)
(
2 x
P
x
](https://image.slidesharecdn.com/understanding-key-concepts-of-probability-and-random-variables-through-examples-240201061942-f0e900f5/85/understanding-key-concepts-of-probability-and-random-variables-through-examples-pdf-33-320.jpg)


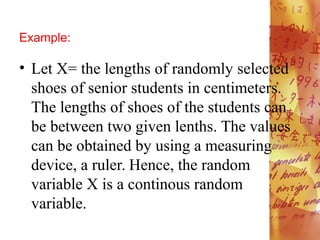
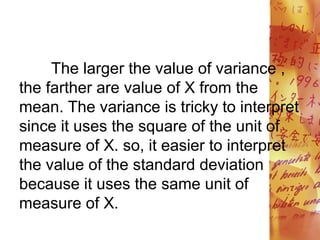
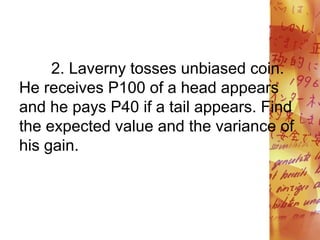
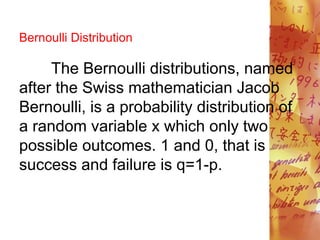
![SOLUTION:
x P(x) xP(x)
0 0.995 0
5000 0.005 25
=25
The expected gain is P25.00.
)]
(
[ x
xP](https://image.slidesharecdn.com/understanding-key-concepts-of-probability-and-random-variables-through-examples-240201061942-f0e900f5/85/understanding-key-concepts-of-probability-and-random-variables-through-examples-pdf-39-320.jpg)

![SOLUTION:
x P(x) xP(x) X2P(x)
0 0.99375 0 0
3000 0.00625 18.75 56,250
=18.75 =56,250
)]
(
[ x
xP )]
(
2
[ x
P
x](https://image.slidesharecdn.com/understanding-key-concepts-of-probability-and-random-variables-through-examples-240201061942-f0e900f5/85/understanding-key-concepts-of-probability-and-random-variables-through-examples-pdf-41-320.jpg)
![a. E(X)= [xP(x)]
=18.75
b. = [x2P(x) - ([xP(x)])2
= 56,250 - (18.75)2
= 56,250 - 351.5625
= 55,898.44
2
](https://image.slidesharecdn.com/understanding-key-concepts-of-probability-and-random-variables-through-examples-240201061942-f0e900f5/85/understanding-key-concepts-of-probability-and-random-variables-through-examples-pdf-42-320.jpg)


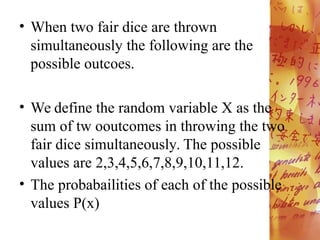
![a. E(X)= [xP(x)]
=10
b. =[x2P(x) - ([xP(x)])2
= 1,700 - (10)2
= 1,700 - 100
= 1,600](https://image.slidesharecdn.com/understanding-key-concepts-of-probability-and-random-variables-through-examples-240201061942-f0e900f5/85/understanding-key-concepts-of-probability-and-random-variables-through-examples-pdf-46-320.jpg)


![Determining the Dependent and Independent Variables [Autosaved].pptx](https://cdn.slidesharecdn.com/ss_thumbnails/determiningthedependentandindependentvariablesautosaved-221125062001-e11bf218-thumbnail.jpg?width=640&height=640&fit=bounds)