Probability Distribution (Discrete Random Variable)Cess011697
Learning Competencies:
- to find the possible values of a random variable.
illustrates a probability distribution for a discrete random variable and its properties.
- to compute probabilities corresponding to a given random variable.
There are some exercises for you to answer.
Presentation on Marine Insurance by law students from the Polytechnic University of the Philippines-College of Law, for Insurance Law under Commissioner Wilfredo Reyes.
A General Manger of Harley-Davidson has to decide on the size of a.docxevonnehoggarth79783
A General Manger of Harley-Davidson has to decide on the size of a new facility. The GM has narrowed the choices to two: large facility or small facility. The company has collected information on the payoffs. It now has to decide which option is the best using probability analysis, the decision tree model, and expected monetary value.
Options:
Facility
Demand Options
Probability
Actions
Expected Payoffs
Large
Low Demand
0.4
Do Nothing
($10)
Low Demand
0.4
Reduce Prices
$50
High Demand
0.6
$70
Small
Low Demand
0.4
$40
High Demand
0.6
Do Nothing
$40
High Demand
0.6
Overtime
$50
High Demand
0.6
Expand
$55
Determination of chance probability and respective payoffs:
Build Small:
Low Demand
0.4($40)=$16
High Demand
0.6($55)=$33
Build Large:
Low Demand
0.4($50)=$20
High Demand
0.6($70)=$42
Determination of Expected Value of each alternative
Build Small: $16+$33=$49
Build Large: $20+$42=$62
Click here for the Statistical Terms review sheet.
Submit your conclusion in a Word document to the M4: Assignment 2 Dropbox byWednesday, November 18, 2015.
A General Manger of Harley
-
Davidson has to decide on the size of a new facility. The GM has narrowed
the choices to two: large facility or small facility. The company has collected information on the payoffs. It
now has to decide which option is the best u
sing probability analysis, the decision tree model, and
expected monetary value.
Options:
Facility
Demand
Options
Probability
Actions
Expected
Payoffs
Large
Low Demand
0.4
Do Nothing
($10)
Low Demand
0.4
Reduce Prices
$50
High Demand
0.6
$70
Small
Low Demand
0.4
$40
High Demand
0.6
Do Nothing
$40
High Demand
0.6
Overtime
$50
High Demand
0.6
Expand
$55
A General Manger of Harley-Davidson has to decide on the size of a new facility. The GM has narrowed
the choices to two: large facility or small facility. The company has collected information on the payoffs. It
now has to decide which option is the best using probability analysis, the decision tree model, and
expected monetary value.
Options:
Facility
Demand
Options
Probability Actions
Expected
Payoffs
Large Low Demand 0.4 Do Nothing ($10)
Low Demand 0.4 Reduce Prices $50
High Demand 0.6
$70
Small Low Demand 0.4
$40
High Demand 0.6 Do Nothing $40
High Demand 0.6 Overtime $50
High Demand 0.6 Expand $55
SAMPLING MEAN:
DEFINITION:
The term sampling mean is a statistical term used to describe the properties of statistical distributions. In statistical terms, the sample meanfrom a group of observations is an estimate of the population mean. Given a sample of size n, consider n independent random variables X1, X2... Xn, each corresponding to one randomly selected observation. Each of these variables has the distribution of the population, with mean and standard deviation. The sample mean is defined to be
WHAT IT IS USED FOR:
It is also used to measure central tendency of the numbers in a .
Answer the questions in one paragraph 4-5 sentences. · Why did t.docxboyfieldhouse
Answer the questions in one paragraph 4-5 sentences.
· Why did the class collectively sign a blank check? Was this a wise decision; why or why not? we took a decision all the class without hesitation
· What is something that I said individuals should always do; what is it; why wasn't it done this time? Which mitigation strategies were used; what other strategies could have been used/considered? individuals should always participate in one group and take one decision
SAMPLING MEAN:
DEFINITION:
The term sampling mean is a statistical term used to describe the properties of statistical distributions. In statistical terms, the sample meanfrom a group of observations is an estimate of the population mean. Given a sample of size n, consider n independent random variables X1, X2... Xn, each corresponding to one randomly selected observation. Each of these variables has the distribution of the population, with mean and standard deviation. The sample mean is defined to be
WHAT IT IS USED FOR:
It is also used to measure central tendency of the numbers in a database. It can also be said that it is nothing more than a balance point between the number and the low numbers.
HOW TO CALCULATE IT:
To calculate this, just add up all the numbers, then divide by how many numbers there are.
Example: what is the mean of 2, 7, and 9?
Add the numbers: 2 + 7 + 9 = 18
Divide by how many numbers (i.e., we added 3 numbers): 18 ÷ 3 = 6
So the Mean is 6
SAMPLE VARIANCE:
DEFINITION:
The sample variance, s2, is used to calculate how varied a sample is. A sample is a select number of items taken from a population. For example, if you are measuring American people’s weights, it wouldn’t be feasible (from either a time or a monetary standpoint) for you to measure the weights of every person in the population. The solution is to take a sample of the population, say 1000 people, and use that sample size to estimate the actual weights of the whole population.
WHAT IT IS USED FOR:
The sample variance helps you to figure out the spread out in the data you have collected or are going to analyze. In statistical terminology, it can be defined as the average of the squared differences from the mean.
HOW TO CALCULATE IT:
Given below are steps of how a sample variance is calculated:
· Determine the mean
· Then for each number: subtract the Mean and square the result
· Then work out the mean of those squared differences.
To work out the mean, add up all the values then divide by the number of data points.
First add up all the values from the previous step.
But how do we say "add them all up" in mathematics? We use the Roman letter Sigma: Σ
The handy Sigma Notation says to sum up as many terms as we want.
· Next we need to divide by the number of data points, which is simply done by multiplying by "1/N":
Statistically it can be stated by the following:
·
· This value is the variance
EXAMPLE:
Sam has 20 Rose Bushes.
The number of flowers on each b.
SAMPLING MEAN DEFINITION The term sampling mean .docxanhlodge
SAMPLING MEAN:
DEFINITION:
The term sampling mean is a statistical term used to describe the properties of statistical
distributions. In statistical terms, the sample mean from a group of observations is an
estimate of the population mean . Given a sample of size n, consider n independent random
variables X1, X2... Xn, each corresponding to one randomly selected observation. Each of these
variables has the distribution of the population, with mean and standard deviation . The
sample mean is defined to be
WHAT IT IS USED FOR:
It is also used to measure central tendency of the numbers in a database. It can also be said that
it is nothing more than a balance point between the number and the low numbers.
HOW TO CALCULATE IT:
To calculate this, just add up all the numbers, then divide by how many numbers there are.
Example: what is the mean of 2, 7, and 9?
Add the numbers: 2 + 7 + 9 = 18
Divide by how many numbers (i.e., we added 3 numbers): 18 ÷ 3 = 6
So the Mean is 6
SAMPLE VARIANCE:
DEFINITION:
The sample variance, s2, is used to calculate how varied a sample is. A sample is a select number
of items taken from a population. For example, if you are measuring American people’s weights,
it wouldn’t be feasible (from either a time or a monetary standpoint) for you to measure the
weights of every person in the population. The solution is to take a sample of the population, say
1000 people, and use that sample size to estimate the actual weights of the whole population.
WHAT IT IS USED FOR:
The sample variance helps you to figure out the spread out in the data you have collected or are
going to analyze. In statistical terminology, it can be defined as the average of the squared
differences from the mean.
HOW TO CALCULATE IT:
Given below are steps of how a sample variance is calculated:
• Determine the mean
• Then for each number: subtract the Mean and square the result
• Then work out the mean of those squared differences.
To work out the mean, add up all the values then divide by the number of data points.
First add up all the values from the previous step.
But how do we say "add them all up" in mathematics? We use the Roman letter Sigma: Σ
The handy Sigma Notation says to sum up as many terms as we want.
• Next we need to divide by the number of data points, which is simply done by
multiplying by "1/N":
Statistically it can be stated by the following:
•
http://www.statisticshowto.com/find-sample-size-statistics/
http://www.mathsisfun.com/algebra/sigma-notation.html
• This value is the variance
EXAMPLE:
Sam has 20 Rose Bushes.
The number of flowers on each bush is
9, 2, 5, 4, 12, 7, 8, 11, 9, 3, 7, 4, 12, 5, 4, 10, 9, 6, 9, 4
Work out the sample variance
Step 1. Work out the mean
In the formula above, μ (the Greek letter "mu") is the mean of all our values.
For this example, the data points are: 9, 2, 5, 4, 12, 7, 8,.
SAMPLING MEANDEFINITIONThe term sampling mean is a stati.docxanhlodge
SAMPLING MEAN:
DEFINITION:
The term sampling mean is a statistical term used to describe the properties of statistical distributions. In statistical terms, the sample meanfrom a group of observations is an estimate of the population mean. Given a sample of size n, consider n independent random variables X1, X2... Xn, each corresponding to one randomly selected observation. Each of these variables has the distribution of the population, with mean and standard deviation. The sample mean is defined to be
WHAT IT IS USED FOR:
It is also used to measure central tendency of the numbers in a database. It can also be said that it is nothing more than a balance point between the number and the low numbers.
HOW TO CALCULATE IT:
To calculate this, just add up all the numbers, then divide by how many numbers there are.
Example: what is the mean of 2, 7, and 9?
Add the numbers: 2 + 7 + 9 = 18
Divide by how many numbers (i.e., we added 3 numbers): 18 ÷ 3 = 6
So the Mean is 6
SAMPLE VARIANCE:
DEFINITION:
The sample variance, s2, is used to calculate how varied a sample is. A sample is a select number of items taken from a population. For example, if you are measuring American people’s weights, it wouldn’t be feasible (from either a time or a monetary standpoint) for you to measure the weights of every person in the population. The solution is to take a sample of the population, say 1000 people, and use that sample size to estimate the actual weights of the whole population.
WHAT IT IS USED FOR:
The sample variance helps you to figure out the spread out in the data you have collected or are going to analyze. In statistical terminology, it can be defined as the average of the squared differences from the mean.
HOW TO CALCULATE IT:
Given below are steps of how a sample variance is calculated:
· Determine the mean
· Then for each number: subtract the Mean and square the result
· Then work out the mean of those squared differences.
To work out the mean, add up all the values then divide by the number of data points.
First add up all the values from the previous step.
But how do we say "add them all up" in mathematics? We use the Roman letter Sigma: Σ
The handy Sigma Notation says to sum up as many terms as we want.
· Next we need to divide by the number of data points, which is simply done by multiplying by "1/N":
Statistically it can be stated by the following:
·
· This value is the variance
EXAMPLE:
Sam has 20 Rose Bushes.
The number of flowers on each bush is
9, 2, 5, 4, 12, 7, 8, 11, 9, 3, 7, 4, 12, 5, 4, 10, 9, 6, 9, 4
Work out the sample variance
Step 1. Work out the mean
In the formula above, μ (the Greek letter "mu") is the mean of all our values.
For this example, the data points are: 9, 2, 5, 4, 12, 7, 8, 11, 9, 3, 7, 4, 12, 5, 4, 10, 9, 6, 9, 4
The mean is:
(9+2+5+4+12+7+8+11+9+3+7+4+12+5+4+10+9+6+9+4) / 20 = 140/20 = 7
So:
μ = 7
Step 2. Then for each number: subtract the Mean and square the result
This is t.
SAMPLING MEANDEFINITIONThe term sampling mean is a stati.docxagnesdcarey33086
SAMPLING MEAN:
DEFINITION:
The term sampling mean is a statistical term used to describe the properties of statistical distributions. In statistical terms, the sample meanfrom a group of observations is an estimate of the population mean. Given a sample of size n, consider n independent random variables X1, X2... Xn, each corresponding to one randomly selected observation. Each of these variables has the distribution of the population, with mean and standard deviation. The sample mean is defined to be
WHAT IT IS USED FOR:
It is also used to measure central tendency of the numbers in a database. It can also be said that it is nothing more than a balance point between the number and the low numbers.
HOW TO CALCULATE IT:
To calculate this, just add up all the numbers, then divide by how many numbers there are.
Example: what is the mean of 2, 7, and 9?
Add the numbers: 2 + 7 + 9 = 18
Divide by how many numbers (i.e., we added 3 numbers): 18 ÷ 3 = 6
So the Mean is 6
SAMPLE VARIANCE:
DEFINITION:
The sample variance, s2, is used to calculate how varied a sample is. A sample is a select number of items taken from a population. For example, if you are measuring American people’s weights, it wouldn’t be feasible (from either a time or a monetary standpoint) for you to measure the weights of every person in the population. The solution is to take a sample of the population, say 1000 people, and use that sample size to estimate the actual weights of the whole population.
WHAT IT IS USED FOR:
The sample variance helps you to figure out the spread out in the data you have collected or are going to analyze. In statistical terminology, it can be defined as the average of the squared differences from the mean.
HOW TO CALCULATE IT:
Given below are steps of how a sample variance is calculated:
· Determine the mean
· Then for each number: subtract the Mean and square the result
· Then work out the mean of those squared differences.
To work out the mean, add up all the values then divide by the number of data points.
First add up all the values from the previous step.
But how do we say "add them all up" in mathematics? We use the Roman letter Sigma: Σ
The handy Sigma Notation says to sum up as many terms as we want.
· Next we need to divide by the number of data points, which is simply done by multiplying by "1/N":
Statistically it can be stated by the following:
·
· This value is the variance
EXAMPLE:
Sam has 20 Rose Bushes.
The number of flowers on each bush is
9, 2, 5, 4, 12, 7, 8, 11, 9, 3, 7, 4, 12, 5, 4, 10, 9, 6, 9, 4
Work out the sample variance
Step 1. Work out the mean
In the formula above, μ (the Greek letter "mu") is the mean of all our values.
For this example, the data points are: 9, 2, 5, 4, 12, 7, 8, 11, 9, 3, 7, 4, 12, 5, 4, 10, 9, 6, 9, 4
The mean is:
(9+2+5+4+12+7+8+11+9+3+7+4+12+5+4+10+9+6+9+4) / 20 = 140/20 = 7
So:
μ = 7
Step 2. Then for each number: subtract the Mean and square the result
This is t.
In this slide, variables types, probability theory behind the algorithms and its uses including distribution is explained. Also theorems like bayes theorem is also explained.
SAMPLING MEAN DEFINITION The term sampling mean is.docxagnesdcarey33086
SAMPLING MEAN:
DEFINITION:
The term sampling mean is a statistical term used to describe the properties of statistical
distributions. In statistical terms, the sample mean from a group of observations is an
estimate of the population mean . Given a sample of size n, consider n independent random
variables X1, X2... Xn, each corresponding to one randomly selected observation. Each of these
variables has the distribution of the population, with mean and standard deviation . The
sample mean is defined to be
WHAT IT IS USED FOR:
It is also used to measure central tendency of the numbers in a database. It can also be said that
it is nothing more than a balance point between the number and the low numbers.
HOW TO CALCULATE IT:
To calculate this, just add up all the numbers, then divide by how many numbers there are.
Example: what is the mean of 2, 7, and 9?
Add the numbers: 2 + 7 + 9 = 18
Divide by how many numbers (i.e., we added 3 numbers): 18 ÷ 3 = 6
So the Mean is 6
SAMPLE VARIANCE:
DEFINITION:
The sample variance, s2, is used to calculate how varied a sample is. A sample is a select number
of items taken from a population. For example, if you are measuring American people’s weights,
it wouldn’t be feasible (from either a time or a monetary standpoint) for you to measure the
weights of every person in the population. The solution is to take a sample of the population, say
1000 people, and use that sample size to estimate the actual weights of the whole population.
WHAT IT IS USED FOR:
The sample variance helps you to figure out the spread out in the data you have collected or are
going to analyze. In statistical terminology, it can be defined as the average of the squared
differences from the mean.
HOW TO CALCULATE IT:
Given below are steps of how a sample variance is calculated:
• Determine the mean
• Then for each number: subtract the Mean and square the result
• Then work out the mean of those squared differences.
To work out the mean, add up all the values then divide by the number of data points.
First add up all the values from the previous step.
But how do we say "add them all up" in mathematics? We use the Roman letter Sigma: Σ
The handy Sigma Notation says to sum up as many terms as we want.
• Next we need to divide by the number of data points, which is simply done by
multiplying by "1/N":
Statistically it can be stated by the following:
•
• This value is the variance
EXAMPLE:
Sam has 20 Rose Bushes.
The number of flowers on each bush is
9, 2, 5, 4, 12, 7, 8, 11, 9, 3, 7, 4, 12, 5, 4, 10, 9, 6, 9, 4
Work out the sample variance
Step 1. Work out the mean
In the formula above, µ (the Greek letter "mu") is the mean of all our values.
For this example, the data points are: 9, 2, 5, 4, 12, 7, 8, 11, 9, 3, 7, 4, 12, 5, 4, 10, 9, 6, 9, 4
The mean is:
(9+2+5+4+12+7+8+11+9+3+7+4+12+5+4+10+9+6+9+4) / 20 = 140/20 = 7
So:
µ.
Francesca Gottschalk - How can education support child empowerment.pptxEduSkills OECD
Francesca Gottschalk from the OECD’s Centre for Educational Research and Innovation presents at the Ask an Expert Webinar: How can education support child empowerment?
Embracing GenAI - A Strategic ImperativePeter Windle
Artificial Intelligence (AI) technologies such as Generative AI, Image Generators and Large Language Models have had a dramatic impact on teaching, learning and assessment over the past 18 months. The most immediate threat AI posed was to Academic Integrity with Higher Education Institutes (HEIs) focusing their efforts on combating the use of GenAI in assessment. Guidelines were developed for staff and students, policies put in place too. Innovative educators have forged paths in the use of Generative AI for teaching, learning and assessments leading to pockets of transformation springing up across HEIs, often with little or no top-down guidance, support or direction.
This Gasta posits a strategic approach to integrating AI into HEIs to prepare staff, students and the curriculum for an evolving world and workplace. We will highlight the advantages of working with these technologies beyond the realm of teaching, learning and assessment by considering prompt engineering skills, industry impact, curriculum changes, and the need for staff upskilling. In contrast, not engaging strategically with Generative AI poses risks, including falling behind peers, missed opportunities and failing to ensure our graduates remain employable. The rapid evolution of AI technologies necessitates a proactive and strategic approach if we are to remain relevant.
Unit 8 - Information and Communication Technology (Paper I).pdfThiyagu K
This slides describes the basic concepts of ICT, basics of Email, Emerging Technology and Digital Initiatives in Education. This presentations aligns with the UGC Paper I syllabus.
How to Make a Field invisible in Odoo 17Celine George
It is possible to hide or invisible some fields in odoo. Commonly using “invisible” attribute in the field definition to invisible the fields. This slide will show how to make a field invisible in odoo 17.
Palestine last event orientationfvgnh .pptxRaedMohamed3
An EFL lesson about the current events in Palestine. It is intended to be for intermediate students who wish to increase their listening skills through a short lesson in power point.
Macroeconomics- Movie Location
This will be used as part of your Personal Professional Portfolio once graded.
Objective:
Prepare a presentation or a paper using research, basic comparative analysis, data organization and application of economic information. You will make an informed assessment of an economic climate outside of the United States to accomplish an entertainment industry objective.
Welcome to TechSoup New Member Orientation and Q&A (May 2024).pdfTechSoup
In this webinar you will learn how your organization can access TechSoup's wide variety of product discount and donation programs. From hardware to software, we'll give you a tour of the tools available to help your nonprofit with productivity, collaboration, financial management, donor tracking, security, and more.
June 3, 2024 Anti-Semitism Letter Sent to MIT President Kornbluth and MIT Cor...Levi Shapiro
Letter from the Congress of the United States regarding Anti-Semitism sent June 3rd to MIT President Sally Kornbluth, MIT Corp Chair, Mark Gorenberg
Dear Dr. Kornbluth and Mr. Gorenberg,
The US House of Representatives is deeply concerned by ongoing and pervasive acts of antisemitic
harassment and intimidation at the Massachusetts Institute of Technology (MIT). Failing to act decisively to ensure a safe learning environment for all students would be a grave dereliction of your responsibilities as President of MIT and Chair of the MIT Corporation.
This Congress will not stand idly by and allow an environment hostile to Jewish students to persist. The House believes that your institution is in violation of Title VI of the Civil Rights Act, and the inability or
unwillingness to rectify this violation through action requires accountability.
Postsecondary education is a unique opportunity for students to learn and have their ideas and beliefs challenged. However, universities receiving hundreds of millions of federal funds annually have denied
students that opportunity and have been hijacked to become venues for the promotion of terrorism, antisemitic harassment and intimidation, unlawful encampments, and in some cases, assaults and riots.
The House of Representatives will not countenance the use of federal funds to indoctrinate students into hateful, antisemitic, anti-American supporters of terrorism. Investigations into campus antisemitism by the Committee on Education and the Workforce and the Committee on Ways and Means have been expanded into a Congress-wide probe across all relevant jurisdictions to address this national crisis. The undersigned Committees will conduct oversight into the use of federal funds at MIT and its learning environment under authorities granted to each Committee.
• The Committee on Education and the Workforce has been investigating your institution since December 7, 2023. The Committee has broad jurisdiction over postsecondary education, including its compliance with Title VI of the Civil Rights Act, campus safety concerns over disruptions to the learning environment, and the awarding of federal student aid under the Higher Education Act.
• The Committee on Oversight and Accountability is investigating the sources of funding and other support flowing to groups espousing pro-Hamas propaganda and engaged in antisemitic harassment and intimidation of students. The Committee on Oversight and Accountability is the principal oversight committee of the US House of Representatives and has broad authority to investigate “any matter” at “any time” under House Rule X.
• The Committee on Ways and Means has been investigating several universities since November 15, 2023, when the Committee held a hearing entitled From Ivory Towers to Dark Corners: Investigating the Nexus Between Antisemitism, Tax-Exempt Universities, and Terror Financing. The Committee followed the hearing with letters to those institutions on January 10, 202
Introduction to AI for Nonprofits with Tapp NetworkTechSoup
Dive into the world of AI! Experts Jon Hill and Tareq Monaur will guide you through AI's role in enhancing nonprofit websites and basic marketing strategies, making it easy to understand and apply.
Operation “Blue Star” is the only event in the history of Independent India where the state went into war with its own people. Even after about 40 years it is not clear if it was culmination of states anger over people of the region, a political game of power or start of dictatorial chapter in the democratic setup.
The people of Punjab felt alienated from main stream due to denial of their just demands during a long democratic struggle since independence. As it happen all over the word, it led to militant struggle with great loss of lives of military, police and civilian personnel. Killing of Indira Gandhi and massacre of innocent Sikhs in Delhi and other India cities was also associated with this movement.
Biological screening of herbal drugs: Introduction and Need for
Phyto-Pharmacological Screening, New Strategies for evaluating
Natural Products, In vitro evaluation techniques for Antioxidants, Antimicrobial and Anticancer drugs. In vivo evaluation techniques
for Anti-inflammatory, Antiulcer, Anticancer, Wound healing, Antidiabetic, Hepatoprotective, Cardio protective, Diuretics and
Antifertility, Toxicity studies as per OECD guidelines
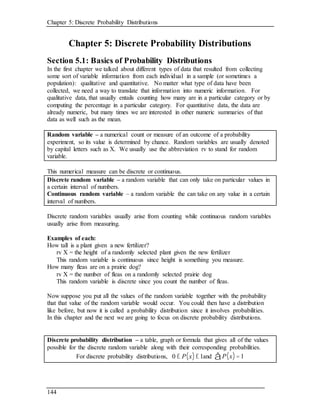
1. Chapter 5: Discrete Probability Distributions
144
Chapter 5: Discrete Probability Distributions
Section 5.1: Basics of Probability Distributions
In the first chapter we talked about different types of data that resulted from collecting
some sort of variable information from each individual in a sample (or sometimes a
population): qualitative and quantitative. No matter what type of data have been
collected, we need a way to translate that information into numeric information. For
qualitative data, that usually entails counting how many are in a particular category or by
computing the percentage in a particular category. For quantitative data, the data are
already numeric, but many times we are interested in other numeric summaries of that
data as well such as the mean.
Random variable – a numerical count or measure of an outcome of a probability
experiment, so its value is determined by chance. Random variables are usually denoted
by capital letters such as X. We usually use the abbreviation rv to stand for random
variable.
This numerical measure can be discrete or continuous.
Discrete random variable – a random variable that can only take on particular values in
a certain interval of numbers.
Continuous random variable – a random variable the can take on any value in a certain
interval of numbers.
Discrete random variables usually arise from counting while continuous random variables
usually arise from measuring.
Examples of each:
How tall is a plant given a new fertilizer?
rv X = the height of a randomly selected plant given the new fertilizer
This random variable is continuous since height is something you measure.
How many fleas are on a prairie dog?
rv X = the number of fleas on a randomly selected prairie dog
This random variable is discrete since you count the number of fleas.
Now suppose you put all the values of the random variable together with the probability
that that value of the random variable would occur. You could then have a distribution
like before, but now it is called a probability distribution since it involves probabilities.
In this chapter and the next we are going to focus on discrete probability distributions.
Discrete probability distribution – a table, graph or formula that gives all of the values
possible for the discrete random variable along with their corresponding probabilities.
For discrete probability distributions, 0 £ P x( )£1and P x( )å =1
2. Chapter 5: Discrete Probability Distributions
145
Example #5.1.1: Probability Distribution
The 2010 U.S. Census found the chance of a household being a certain size. The
data is in table #5.1.1 ("Households by age," 2013).
Table #5.1.1: Household Size from U.S. Census of 2010
Size of household 1 2 3 4 5 6 7 or more
Probability 26.7% 33.6% 15.8% 13.7% 6.3% 2.4% 1.5%
Solution:
In this case, the random variable is X = number of people in a household. This is
a discrete random variable, since you are counting the number of people in a
household. This is a discrete probability distribution since you have each x value
and the probabilities that go with it, all of the probabilities are between zero and
one, and the sum of all of the probabilities is 100% which is 1.
You can give a probability distribution in table form (as in table #5.1.1) or as a graph.
The graph looks like a histogram. A discrete probability distribution is basically a
relative frequency distribution based on a very large sample.
Example #5.1.2: Graphing a Probability Distribution
The 2010 U.S. Census found the chance of a household being a certain size. The
data is in the table ("Households by age," 2013). Draw a histogram of the
probability distribution.
Table #5.1.2: Household Size from U.S. Census of 2010
Size of
household 1 2 3 4 5 6
7 or
more
Probability 26.7% 33.6% 15.8% 13.7% 6.3% 2.4% 1.5%
Solution:
State random variable:
rv X = number of people in a household
You draw a histogram, where the x values are on the horizontal axis and are the x
values of the classes (for the 7 or more category, just call it 7). The probabilities
are on the vertical axis.
Graph #5.1.1: Histogram of Household Size from U.S. Census of 2010
Notice that this distribution of U.S. household size in 2010 is skewed right.
3. Chapter 5: Discrete Probability Distributions
146
In problems involving a probability distribution function (pdf), you consider the
probability distribution the population even though the pdf in most cases comes from
repeating an experiment many times. This is because you are using the data from
repeated experiments to estimate the true probability (remember the Law of Large
Numbers from the last chapter). Since a pdf is basically a population, we use the
population parameter symbols for the mean and standard deviation. Note: the mean can
be thought of as the expected value. It is the value you expect to get on average if the
trials were repeated infinite number of times. The mean or expected value does not need
to be a whole number, even if the possible values of the random variable X are whole
numbers.
For a discrete probability distribution function,
The mean or expected value is 𝜇 𝑥 = ∑ 𝑥 ∙ 𝑃(𝑥)
The standard deviation is 𝜎𝑥 = √(∑( 𝑥 − 𝜇 𝑥)2 ∙ 𝑃(𝑥))
where x = the value of the random variable and P(x) = the probability corresponding to
that particular x value.
NOTE: Formulas are included here but you will always be using technology to compute
these.
TECHNOLOGY: MEAN AND STANDARD DEVIATION OF DISCRETE PDF
Using StatCrunch:
Enter the data into a column in the spreadsheet (see earlier instructions on entering
a list of data)
Click Stat, Calculators, Custom
In the popup window that opens choose the column with the values of X from
“Values in” and choose the column with the corresponding probabilities from
“Weights in”
Then click “Compute!”
Using your TI84:
First push STAT 1 and enter the values of X into L1 and the corresponding
probabilities into L2 (or any other two lists)
Push STAT → 1 to open 1-Var Stats.
You need to make your input screen look like one of the screens below (depending
on which operating system your calculator has). Push 2nd 1 to type L1 and push
2nd 2 to type L2.
or
Then push ENTER or highlight “Calculate” and push ENTER
4. Chapter 5: Discrete Probability Distributions
147
Example #5.1.3: Calculating Meanand Standard Deviation for a Discrete
Probability Distribution
The 2010 U.S. Census found the chance of a household being a certain size. The
data is in the table ("Households by age," 2013). Calculate the mean and standard
deviation.
Table #5.1.3: Household Size from U.S. Census of 2010
Size of
household 1 2 3 4 5 6
7 or
more
Probability 26.7% 33.6% 15.8% 13.7% 6.3% 2.4% 1.5%
Solution:
State random variable:
rv X = number of people in a household
Using StatCrunch:
o Enter the data into two columns in the spreadsheet (upload
Chapter05DataFile) and then click Stat, Calculators, Custom.
o In the popup window that opens choose the column called “Size of
Household” from “Values in” and choose “Prob of Size” from “Weights in”
o Then click “Compute!” to get the following output.
5. Chapter 5: Discrete Probability Distributions
148
Using the correct notation, we would write this as follows:
𝜇 𝑥 = 2.525 people and 𝜎𝑥 ≈ 1.422 people
This means that you expect a household in the U.S. to have an average of
2.525 people in it with a standard deviation of 1.422 people.
Using the TI84:
o First push STAT 1 and enter the data into two lists:
o Push STAT → 1 to open 1-Var Stats and enter the lists names like below:
or
o Highlight “Calculate” and push ENTER you will see the output below.
Figure #5.1.1: TI-84 Output
The calculator assumes you have sample data and does not display the correct
symbol for the mean when using probability distributions. The correct
notation here would be 𝜇 𝑥 = 2.525 people and 𝜎𝑥 ≈ 1.422 people.
This means that you expect a household in the U.S. to have an average of 2.525
people in it with a standard deviation of 1.422 people.
6. Chapter 5: Discrete Probability Distributions
149
Example #5.1.4: Calculating the Expected Value
In the Arizona lottery called Pick 3, a player pays $1 and then picks a three-digit
number. If those three numbers are picked in that specific order the person wins
$500. What are the expected winnings in this game?
Solution:
To find the expected winnings, you need to first create the probability
distribution. In this case, the random variable X = winnings. If you pick the right
numbers in the right order, then you win $500, but you paid $1 to play, so you
actually win $499. If you didn’t pick the right numbers, you lose the $1, the x
value is -$1. You also need the probability of winning and losing. Since you are
picking a three-digit number, and for each digit there are 10 numbers you can pick
with each independent of the others, you can use the multiplication rule. To win,
you have to pick the right numbers in the right order. The first digit, you pick 1
number out of 10, the second digit you pick 1 number out of 10, and the third
digit you pick 1 number out of 10. The probability of picking the right number in
the right order is
1
10
*
1
10
*
1
10
=
1
1000
= 0.001. The probability of losing (not
winning) would be 1-
1
1000
=
999
1000
= 0.999. Putting this information into a table
will help to calculate the expected value.
Table #5.1.6: Finding Expected Value
Win or lose x P(x)
Win $499 0.001
Lose -$1 0.999
Now, for this one the table is small enough and we only have to compute the
mean so we could use the formula and get the following:
𝜇 𝑥 = $499(0.001) − $1(0.999) = $ − 0.50
In the long run, you will expect to lose $0.50 per game on average. Notice that
you can never play the lottery and lose 50 cents: you either win $499 or you lose
$1. But if you were to play this lottery many, many times, and record your
winnings each time, the list of winnings if you add it up and divide by how many
times you played would tend to get closer to $ − 0.50 the more times you played.
Sometimes with games we are interested in whether a game is fair or not. A game
that is fair is one where the expected winnings are $0. Since the expected
winnings for the lottery are not $0, this game is not fair. Since you lose money,
Arizona makes money, which is why they have the lottery.
The reason probability is studied in statistics is to help in making decisions in inferential
statistics. To understand how that is done, the concept of a rare event is needed.
Rare (unusual) event – an event that has a small chance of happening. For now, we are
going to define an event as rare (unusual) if its probability is less than or equal to 0.05
7. Chapter 5: Discrete Probability Distributions
150
This leads us to the rare event rule that we will be using for inferential statistics.
Rare Event Rule for Inferential Statistics
If, under a given assumption, the probability of a particular observed event is extremely
small, then you can conclude that the assumption is probably not correct.
As an example, suppose that you assume a die is fair and you roll it 100 times and you
roll a 6 on sixty of those rolls. The chance of getting at least sixty rolls with a 6 out of
100 rolls of a fair die is only 0.0284. This is less than 0.05, so it would be reasonable to
believe that the assumption about the die being fair is not true.
Determining if an event is unusual
If you are looking at a value of x for a discrete random variable, and the P(the variable
has a value of x or more) ≤ 0.05, then you can consider the x an unusually high
value. Another way to think of this is if the probability of getting such a high value is
less than 0.05, then the event of getting the value x is unusual.
Similarly, if the P(the variable has a value of x or less) ≤ 0.05, then you can consider the
x an unusually low value. Another way to think of this is if the probability of getting a
value as small as x is less than 0.05, then the event of getting the value x is considered
unusual.
Why is it "x or more" or "x or less" instead of just "x" when you are determining if an
event is unusual? Consider this example: you and your friend go out to lunch every
day. Instead of Going Dutch (each paying for their own lunch), you decide to flip a coin,
and the loser pays for both. Your friend seems to be winning more often than you'd
expect, so you want to determine if this is unusual before you decide to change how you
pay for lunch (or accuse your friend of cheating). The process for how to calculate these
probabilities will be presented in the next section on the binomial distribution. If your
friend won 6 out of 10 lunches, the probability of that happening turns out to be about
20.5%, not unusual. The probability of winning 6 or more is about 37.7%. But what
happens if your friend won 501 out of 1,000 lunches? That doesn't seem so
unlikely! The probability of winning 501 or more lunches is about 47.8%, and that is
consistent with your hunch that this isn't so unusual. But the probability of winning
exactly 501 lunches is much less, only about 2.5%. That is why the probability of getting
exactly that value is not the right question to ask: you should ask the probability of
getting that value or more (or that value or less on the other side).
8. Chapter 5: Discrete Probability Distributions
151
The value 0.05 will be explained later, and it is not the only value you can use.
Below are the common wordings for inequality symbols that you should make sure you
know.
is at least ≥ is greater than or equal to ≥
is at most ≤ is less than or equal to ≤
is less than < exceeds >
is greater than > does not exceed ≤
is a maximum of ≤ is below <
is a minimum of ≥ is above >
is no less than ≥ is no greater than ≤
is between < < is between inclusive ≤ ≤
Example #5.1.5: Is the Event Unusual
The 2010 U.S. Census found the chance of a household being a certain size. The
data is in the table ("Households by age," 2013).
Table #5.1.7: Household Size from U.S. Census of 2010
Size of
household 1 2 3 4 5 6
7 or
more
Probability 26.7% 33.6% 15.8% 13.7% 6.3% 2.4% 1.5%
Solution:
State random variable:
rv X = number of people in a household
a.) Is it unusual for a household to have six people in the family?
Solution:
To determine this, you need to look at two probabilities and compare each of
them to 0.05. However, you cannot just look at the probability of six people.
You need to look at the probability of x being six or more people or the
probability of x being six or less people.
𝑃( 𝑋 ≤ 6)
= 𝑃( 𝑋 = 1) + 𝑃( 𝑋 = 2) + 𝑃( 𝑋 = 3) + 𝑃( 𝑋 = 4) + 𝑃( 𝑋 = 5) + 𝑃(𝑋 = 6)
𝑃( 𝑋 ≤ 6) = 26.7% + 33.6% + 15.8% + 13.7% + 6.3% + 2.4%
𝑃( 𝑋 ≤ 6) = 98.5%
Since this probability is more than 5%, six is not an unusually low value.
𝑃( 𝑋 ≥ 6) = 𝑃( 𝑋 = 6) + 𝑃(𝑋 = 7)
𝑃( 𝑋 ≥ 6) = 2.4% + 1.5%
𝑃( 𝑋 ≥ 6) = 3.9%
Since this probability is less than 5%, six is an unusually high value.
It is unusual for a household to have six people in the family.
9. Chapter 5: Discrete Probability Distributions
152
b.) If you did come upon many families that had six people in the family, what
would you think?
Solution:
Since it is unusual for a family to have six people in it, then you may think
that either the size of families is increasing from what it was or that you are in
a location where families are larger than in other locations.
c.) Is it unusual for a household to have four people in the family?
Solution:
To determine this, you need to look at probabilities. Again, look at the
probability of x being four or more or the probability of x being four or less.
𝑃( 𝑋 ≥ 4) = 𝑃( 𝑋 = 4) + 𝑃( 𝑋 = 5) + 𝑃(𝑋 = 6) + 𝑃(𝑋 = 7)
𝑃( 𝑋 ≥ 4) = 13.7% + 6.3% + 2.4% + 1.5%
𝑃( 𝑋 ≥ 4) = 23.9%
Since this probability is more than 5%, four is not an unusually high value.
𝑃( 𝑋 ≤ 4) = 𝑃( 𝑋 = 1) + 𝑃( 𝑋 = 2) + 𝑃( 𝑋 = 3) + 𝑃( 𝑋 = 4)
𝑃( 𝑋 ≤ 4) = 26.7% + 33.6% + 15.8% + 13.7%
𝑃( 𝑋 ≤ 4) = 89.8%
Since this probability is more than 5%, four is not an unusually low value.
Thus, four is not an unusual size of a family.
d.) If you did come upon a family that has four people in it, what would you
think?
Solution:
Since it is not unusual for a family to have four members, then you would not
think anything is amiss.
10. Chapter 5: Discrete Probability Distributions
153
Section5.1:Homework
1.) Eyeglassomatic manufactures eyeglasses for different retailers. The number of
days it takes to fix defects in a pair of eyeglasses and the probability that it will
take that number of days are in the table.
Table #5.1.8: Number of Days to Fix Defects
Number of days Probabilities
1 24.9%
2 10.8%
3 9.1%
4 12.3%
5 13.3%
6 11.4%
7 7.0%
8 4.6%
9 1.9%
10 1.3%
11 1.0%
12 0.8%
13 0.6%
14 0.4%
15 0.2%
16 0.2%
17 0.1%
18 0.1%
a.) State the random variable.
b.) Draw a histogram of the number of days to fix defects
c.) Find the mean number of days to fix defects.
d.) Find the standard deviation for the number of days to fix defects.
e.) Find probability that it will take at least 16 days to fix the defect.
f.) Is it unusual for it to take 16 days to fix a defect on a pair of eyeglasses?
g.) If it does take 16 days for a pair of eyeglasses to be repaired, what would you
think?
11. Chapter 5: Discrete Probability Distributions
154
2.) Suppose you have an experiment where you flip a coin three times. You then
count the number of heads.
a.) State the random variable.
b.) Write the probability distribution for the number of heads.
c.) Draw a histogram for the number of heads.
d.) Find the mean number of heads.
e.) Find the standard deviation for the number of heads.
f.) Find the probability of having two or more number of heads.
g.) Is it unusual to flip two heads?
3.) The Ohio lottery has a game called Pick 4 where a player pays $1 and picks a
four-digit number. If the four numbers come up in the order you picked, then you
win $2,500. What are your expected winnings?
4.) An LG Dishwasher, which costs $800, has a 20% chance of needing to be
replaced in the first 2 years of purchase. A two-year extended warrantee costs
$112.10 on a dishwasher. What is the expected value of the extended warranty
assuming the dishwasher is replaced in the first 2 years?
12. Chapter 5: Discrete Probability Distributions
155
Section 5.2: Binomial Probability Distribution
Section 5.1 introduced the concept of a probability distribution. The focus of the section
was on discrete probability distributions (pdf). To find the pdf for a situation, you
usually needed to actually conduct the experiment and collect data. Then you can
calculate the experimental probabilities. Normally you cannot calculate the theoretical
probabilities. However, there are certain types of experiments that allow you to calculate
the theoretical probability. One of those types is called a Binomial Experiment.
Properties of a binomial experiment:
1) Fixed number of trials, n, which means that the experiment is repeated a specific
number of times.
2) The n trials are independent, which means that what happens on one trial does not
influence the outcomes of other trials.
3) There are only two outcomes possible for each trial of the experiment, which are called
a success and a failure.
4) The probability of a success doesn’t change from trial to trial, where p = probability of
success.
If you know you have a binomial experiment, then you can calculate binomial
probabilities. This is important because binomial probabilities come up often in real life.
Examples of binomial experiments are:
Toss a fair coin ten times, and find the probability of getting two heads.
Question twenty people in class, and look for the probability of more than half
being women.
Shoot five arrows at a target, and find the probability of hitting it five times.
To develop the process for calculating the probabilities in a binomial experiment,
consider example #5.2.1.
Example #5.2.1: Deriving the Binomial Probability Formula
Suppose you are given a 3-question multiple-choice test. Each question has 4
responses and only one is correct. Suppose you want to find the probability that
you can just guess at the answers and get 2 questions right. (Teachers do this all
the time when they make up a multiple-choice test to see if students can still pass
without studying. In most cases the students can’t.) To help with the idea that
you are going to guess, suppose the test is in Martian.
a.) What is the random variable?
Solution:
rv X = number of correct answers out of 3
13. Chapter 5: Discrete Probability Distributions
156
b.) Is this a binomial experiment?
Solution:
1.) There are 3 questions, and each question is a trial, so there are a fixed
number of trials. In this case, n = 3.
2.) Getting the first question right has no effect on getting the second or third
question right since you are guessing, thus the trials are independent.
3.) Either you get the question right or you get it wrong, so there are only two
outcomes. In this case, the success is getting the question right.
4.) The probability of getting a question right is one out of four since you are
guessing. This is the same for every trial since each question has 4
responses. In this case, p =
1
4
and q =1-
1
4
=
3
4
This is a binomial experiment, since all of the properties are met.
c.) What is the probability of getting 2 questions right?
Solution:
To answer this question, start with the sample space.
S = {RRR, RRW, RWR, WRR, WWR, WRW, RWW, WWW}, where RRW
means you get the first question right, the second question right, and the third
question wrong. The same is similar for the other outcomes.
Now the event space for getting 2 right is {RRW, RWR, WRR}. What you
did in chapter four was just to find three divided by eight. However, this
would not be right in this case. That is because the probability of getting a
question right is different from getting a question wrong. What else can you
do?
Look at just P(RRW) for the moment. Again, that means
P(RRW) = P(R on 1st, R on 2nd, and W on 3rd)
Since the trials are independent, then
P(RRW) = P(R on 1st, R on 2nd, and W on 3rd)
= P(R on 1st) * P(R on 2nd) * P(W on 3rd)
Just multiply p * p * q
P RRW( )=
1
4
*
1
4
*
3
4
=
1
4
æ
èç
ö
ø÷
2
3
4
æ
èç
ö
ø÷
1
The same is true for P(RWR) and P(WRR). To find the probability of 2
correct answers, just add these three probabilities together. You get
14. Chapter 5: Discrete Probability Distributions
157
P 2 correct answers( ) = P RRW( )+ P RWR( )+ P WRR( )
=
1
4
æ
èç
ö
ø÷
2
3
4
æ
èç
ö
ø÷
1
+
1
4
æ
èç
ö
ø÷
2
3
4
æ
èç
ö
ø÷
1
+
1
4
æ
èç
ö
ø÷
2
3
4
æ
èç
ö
ø÷
1
= 3
1
4
æ
èç
ö
ø÷
2
3
4
æ
èç
ö
ø÷
1
d.) What is the probability of getting zero right, one right, and all three right?
Solution:
You could go through the same argument that you did above and come up
with the following:
x right P(x right)
0 right
1*
1
4
æ
èç
ö
ø÷
0
3
4
æ
èç
ö
ø÷
3
1 right
3*
1
4
æ
èç
ö
ø÷
1
3
4
æ
èç
ö
ø÷
2
2 right
3*
1
4
æ
èç
ö
ø÷
2
3
4
æ
èç
ö
ø÷
1
3 right
1*
1
4
æ
èç
ö
ø÷
3
3
4
æ
èç
ö
ø÷
0
There is a pattern to these probabilities and the formula in the box below is the
mathematical formula to describe that pattern. Thankfully we have technology so
we are never going to have to use this formula.
First, the random variable in a binomial experiment is X = number of successes in n
trials. Be careful, a success is not always a good thing. Sometimes a success is
something that is bad, like finding a defect. A success just means you observed the
outcome you are interested in counting.
Binomial Formula for the probability of x successes in n trials is
𝑃( 𝑋 = 𝑥) =
𝑛!
𝑥! ( 𝑛 − 𝑥)!
𝑝 𝑥
(1 − 𝑝) 𝑛−𝑥
= 𝑏𝑖𝑛𝑜𝑚𝑝𝑑𝑓(𝑛, 𝑝, 𝑥)
NOTE: You are never going to use this formula. This is just in the book so that you
know what the calculator is actually computing when we use binompdf.
There are two built-in functions in the distribution menu on the calculator for computing
binomial probabilities:
1. 𝑃( 𝑋 = 𝑥) = 𝑏𝑖𝑛𝑜𝑚𝑝𝑑𝑓(𝑛, 𝑝, 𝑥)
2. 𝑃( 𝑋 ≤ 𝑥) = 𝑏𝑖𝑛𝑜𝑚𝑐𝑑𝑓(𝑛, 𝑝, 𝑥)
Both binompdf and binomcdf commands are found in the DISTR menu.
15. Chapter 5: Discrete Probability Distributions
158
TECHNOLOGY: BINOMIAL PROBABILITIES
Using StatCrunch:
Click Stat, Calculators, Binomial
In the popup window that opens enter a value of n and p and adjust the inequality
to what is asked for in your problem.
Then click “Compute”
This not only gives you the probability, but it also gives you a picture of the
distribution of X with the bars colored red indicating the probability computed
Using your TI84:
First push 2nd VARS to open the distribution menu and then scroll down until you
find binompdf or binomcdf (depending on what you are wanting to compute)
o binompdf computes the probability that x is equal to a number
o binomcdf computes the probability that x is less than or equal to a number
You will get one of the screens below (depending on your operating system). For
the screen on the left you would enter n,p,x (where the comma key is the key above
the 7 key), For the screen on the right, you would enter n next to “trials”, p next to
“p” and x next to “x value”.
or
Then push ENTER or highlight “Paste” and push ENTER ENTER
Reminder: Wording of a binomial random variable
rv X = the number of n randomly selected objects that are in some category of interest
16. Chapter 5: Discrete Probability Distributions
159
Example #5.2.2: Using the Binomial Command on the TI-84 and StatCrunch
When looking at a person’s eye color, it turns out that 1% of people in the world
have green eyes ("What percentage of," 2013). Consider a group of 20 randomly
selected people.
a.) Explain why this is a binomial experiment
Solution:
1.) There are 20 people, and each person is a trial, so there are a fixed number
of trials. In this case, n = 20.
2.) If you assume that each person in the group is chosen at random the eye
color of one person doesn’t affect the eye color of the next person, thus the
trials are independent.
3.) Either a person has green eyes or they do not have green eyes, so there are
only two outcomes. In this case, the success is a person has green eyes.
4.) The probability of a person having green eyes is 0.01. This is the same for
every trial since each person has the same chance of having green eyes.
p = 0.01
b.) State the random variable.
Solution:
rv X = number of people with green eyes out of 20 randomly selected people
(this can also be stated as “the number of 20 r.s. people who have green eyes”)
Find the probability that …
c.) None have green eyes.
Solution:
You are looking for P(X = 0). Since this problem has the event X = 0, you
use the binompdf command on the TI-84. On the TI-84, you go to the DISTR
menu, select the binompdf, and then enter the values for n = 20, p = 0.01 and
x = 0 and the press ENTER ENTER.
Figure #5.2.1: Calculator Results for binompdf
Using Stat, Calculators, Binomial in StatCrunch you would get the following:
P(X = 0) ≈ 0.8179.
Interpret: There is about an 81.8% chance that in a group of 20 randomly
selected people that none of them will have green eyes.
17. Chapter 5: Discrete Probability Distributions
160
d.) Nine have green eyes.
Solution:
In this case you want to find the P(X = 9). Again, you will use the binompdf
command. Following the procedure above, you will have binompdf 20,.01,9( )
on the TI-84.
Using Stat, Calculators, Binomial in StatCrunch you would get the following:
Your answer is 𝑃(𝑋 = 9) ≈ 1.50 × 10¹³
. (Remember when the calculator
gives you 1.50E -13 this is how it displays scientific notation.)
Interpret: The probability that out of twenty randomly selected people, nine
of them have green eyes is a very small chance.
e.) At most three have green eyes.
Solution:
At most three means that three is the highest value you will have. Find the
probability of being less than or equal to three, which is 𝑃(𝑋 ≤ 3). On the
TI-84, you go to the DISTR menu, select the binomcdf, and then enter the
values for n = 20, p = 0.01 and x = 3 and the press ENTER ENTER.
Figure #5.2.2: Calculator Results for binomcdf
Using Stat, Calculators, Binomial in StatCrunch you would get the following:
You will get with 𝑃( 𝑋 ≤ 3) ≈ 0.99996.
Interpret: Thus there is a really good chance that in a group of 20 randomly
selected people that at most three will have green eyes. (Note: don’t round
this to one, since one means that the event will happen, when in reality there is
a slight chance that it won’t happen. It is best to write the answer out to
enough decimal points so it doesn’t round off to one.)
18. Chapter 5: Discrete Probability Distributions
161
f.) Less than three have green eyes.
Solution:
You are looking for 𝑃(𝑋 < 3). Since the values of the random variable in this
case can only be whole numbers such as 0, 1, 2, 3, etc., that means to have
less than 3 you must have less than or equal to 2. So we are really looking for
𝑃(𝑋 ≤ 2). Again use binomcdf. Following the procedure above you will
have binomcdf 20,.01,2( ) on the TI-84, with 𝑃(𝑋 ≤ 2) ≈ 0.998996.
Using Stat, Calculators, Binomial in StatCrunch you would get the following:
Interpret: Again, there is a really good chance that at most two people in the
room will have green eyes.
g.) At least four have green eyes.
Solution:
At least four means four or more. Find the probability of X being greater than
or equal to four. This is the complement of being less than or equal to 3.
This random variable has the following possible values: 0, 1, 2, 3, 4, 5, …, 20
We want the probabilities for the following values: 4, 5, …., 20
binomcdf can give you the probabilities for the following values: 0, 1, 2, 3
0 1 2 3⏟ 4 5 … . 20⏟
binomcdf(20,0.01,3) 1-binomcdf(20,0.01,3)
𝑃( 𝑋 ≥ 4) = 1 − 𝑃( 𝑋 ≤ 3) = 1 − 𝑏𝑖𝑛𝑜𝑚𝑐𝑑𝑓(20,0.01,3) ≈ 1 − 0.99996
𝑃( 𝑋 ≥ 4) ≈ 0.00004
Using Stat, Calculators, Binomial in StatCrunch you would get the following:
Interpret: It is very unlikely when you randomly pick 20 people to have at
least 4 of them have green eyes.
19. Chapter 5: Discrete Probability Distributions
162
h.) Between 3 and 10, inclusive, have green eyes.
Solution:
This random variable has the following possible values: 0, 1, 2, 3, 4, 5, …, 20
We want the probabilities for the following values: 3, 4, …., 10
binomcdf can give you the probabilities for intervals of values starting at 0
binomcdf(20,0.01,10) - binomcdf(20,0.01,2)
0 1 2⏟ 3 4 5 6 7 8 9 10⏞
⏟ 11… 20
binomcdf(20,0.01,2)
binomcdf(20,0.01,10)
𝑃(3 ≤ 𝑋 ≤ 10) = 𝑏𝑖𝑛𝑜𝑚𝑐𝑑𝑓(20,0.01,10) − 𝑏𝑖𝑛𝑜𝑚𝑐𝑑𝑓(20,0.01,2) ≈ 0.00100
Using Stat, Calculators, Binomial in StatCrunch you would get the following:
Interpret: If you randomly pick 20 people, there is about 1 chance out of
1000 that between 3 and 10, inclusive, have green eyes.
Example #5.2.4: Calculating Binomial Probabilities
According to the Center for Disease Control (CDC), about 1 in 88 children in the
U.S. have been diagnosed with autism ("CDC-data and statistics,," 2013).
Suppose you consider a group of 10 randomly selected children.
a.) State the random variable.
Solution:
rv X = number of children with autism out of 10 randomly selected children.
b.) Explain why this is a binomial experiment
Solution:
1.) There are 10 children, and each child is a trial, so there are a fixed number
of trials. In this case, n = 10.
2.) If you assume that each child in the group is chosen at random, then
whether a child has autism does not affect the chance that the next child
has autism. Thus the trials are independent.
3.) Either a child has autism or they do not have autism, so there are two
outcomes. In this case, the success is a child has autism.
4.) The probability of a child having autism is 1/88. This is the same for
every trial since each child has the same chance of having autism so
p =
1
88
.
So this experiment meets all 4 conditions of a binomial experiment.
20. Chapter 5: Discrete Probability Distributions
163
Find the probability that
c.) None have autism.
Solution:
𝑃( 𝑋 = 0) = 𝑏𝑖𝑛𝑜𝑚𝑝𝑑𝑓(10,1 ÷ 88,0) ≈ 0.892
or
Interpret: If we randomly select 10 children, there is about an 89.2% chance
that none of them have autism.
d.) Seven have autism.
Solution:
𝑃( 𝑋 = 7) = 𝑏𝑖𝑛𝑜𝑚𝑝𝑑𝑓(10,1 ÷ 88,7) ≈ 2.84 × 10⁻¹²
𝑃( 𝑋 = 7) ≈ 0.00000000000284 ≈ 0.000
Notice, the answer is given as 0.000. Don’t write 0, since 0 means that the
event is impossible to happen. The event of exactly seven is very improbable,
but not impossible.
or
Interpret: If we randomly select 10 children, there is almost no chance that
exactly 7 of them have autism.
e.) At least five have autism.
Solution:
To use the calculator you need to use the complement.
𝑃( 𝑋 ≥ 5) = 1 − 𝑃( 𝑋 < 5) = 1 − 𝑃(𝑋 ≤ 4)
𝑃( 𝑋 ≥ 5) = 1 − 𝑏𝑖𝑛𝑜𝑚𝑐𝑑𝑓(10,1 ÷ 88,4)
𝑃( 𝑋 ≥ 5) ≈ 1 − 0.9999999 ≈ 0.000
Notice, the answer is given as 0.000. Don’t write 0, since 0 means that the
event is impossible to happen. The event of five or more is improbable, but
not impossible.
or
Interpret: If we randomly select 10 children, there is almost no chance that
at least 5 of them have autism.
21. Chapter 5: Discrete Probability Distributions
164
f.) Suppose five children out of ten have autism. Is this unusual? What does that
tell you?
Solution:
To determine if x = 5 is an unusual value of X, we need to compute two
probabilities and compare each of them to 0.05: 𝑃( 𝑋 ≥ 5) 𝑎𝑛𝑑 𝑃(𝑋 ≤ 5)
From part e, the probability of five or more children in a group of ten having
autism is much less than 5%, 5 out of 10 with autism is an unusually high
number if the probability of autism really is 1/88. If this does happen, then
one may think that the proportion of children diagnosed with autism is
actually more than 1/88.
g.) At most two have autism.
Solution:
𝑃( 𝑋 ≤ 2) = 𝑏𝑖𝑛𝑜𝑚𝑐𝑑𝑓(10,1 ÷ 88,2) ≈ 0.9998
or
Interpret: If we randomly select 10 children, there is about a 99.98% chance
(almost certain) that at most two of them have autism.
h.) Between 1 and 5 have autism.
Solution1
Notice that this does not say inclusive.
This random variable has the following possible values: 0, 1, 2, 3, 4, 5, …, 10
The only numbers in this list that are between 1 and 5 are 2, 3 and 4
binomcdf can give you the probabilities for intervals of values starting at 0
binomcdf(10,1/88,4) - binomcdf(10,1/88,1)
0 1⏟ 2 3 4⏞
⏟ 5 6 … . 10
binomcdf(10,1/88,1)
binomcdf(10,1/88,4)
𝑃(1 < 𝑋 < 5) = 𝑃(2 ≤ 𝑋 ≤ 4) = 𝑃( 𝑋 ≤ 4) − 𝑃(𝑋 ≤ 1)
𝑃(1 < 𝑋 < 5) = 𝑏𝑖𝑛𝑜𝑚𝑐𝑑𝑓(10,1 ÷ 88,4) − 𝑏𝑖𝑛𝑜𝑚𝑐𝑑𝑓(10,1 ÷ 88,1)
or
Interpret: If we randomly select 10 children, there is about a 0.55% chance
that between 1 and 5 of them have autism.
22. Chapter 5: Discrete Probability Distributions
165
Section5.2:Homework
1.) Suppose a random variable, X, arises from a binomial experiment. If n = 14, and
p = 0.13, find the following probabilities using binompdf or binomcdf.
a.) 𝑃(𝑋 = 5)
b.) 𝑃(𝑋 = 8)
c.) 𝑃(𝑋 = 12)
d.) 𝑃(𝑋 ≤ 4)
e.) 𝑃(𝑋 ≥ 8)
f.) 𝑃(𝑋 < 13)
2.) Suppose a random variable, X, arises from a binomial experiment. If n = 22, and
p = 0.85, find the following probabilities using using binompdf or binomcdf.
a.) 𝑃(𝑋 = 18)
b.) 𝑃(𝑋 = 5)
c.) 𝑃(𝑋 = 20)
d.) 𝑃(𝑋 ≤ 3)
e.) 𝑃(𝑋 ≥ 7)
f.) 𝑃(𝑋 < 5)
3.) Suppose a random variable, X, arises from a binomial experiment. If n = 10, and
p = 0.70, find the following probabilities using using binompdf or binomcdf.
a.) 𝑃(𝑋 = 2)
b.) 𝑃(𝑋 = 8)
c.) 𝑃(𝑋 = 7)
d.) 𝑃(𝑋 ≤ 3)
e.) 𝑃(𝑋 > 6)
f.) 𝑃(𝑋 < 5)
g.) 𝑃(5 ≤ 𝑋 ≤ 8)
4.) Suppose a random variable, X, arises from a binomial experiment. If n = 6, and p
= 0.30, find the following probabilities using the using binompdf or binomcdf.
a.) 𝑃(𝑋 = 1)
b.) 𝑃(𝑋 = 5)
c.) 𝑃(𝑋 = 3)
d.) 𝑃(𝑋 ≤ 3)
e.) 𝑃(𝑋 > 4)
f.) 𝑃(𝑋 < 5)
g.) 𝑃(1 ≤ 𝑋 ≤ 5)
23. Chapter 5: Discrete Probability Distributions
166
5.) Suppose a random variable, X, arises from a binomial experiment. If n = 17, and
p = 0.63, find the following probabilities using using binompdf or binomcdf.
a.) 𝑃(𝑋 = 8)
b.) 𝑃(𝑋 = 15)
c.) 𝑃(𝑋 = 14)
d.) 𝑃(𝑋 ≤ 12)
e.) 𝑃(𝑋 > 9)
f.) 𝑃(𝑋 < 8)
6.) Suppose a random variable, x, arises from a binomial experiment. If n = 23, and p
= 0.22, find the following probabilities using using binompdf or binomcdf.
a.) 𝑃(𝑋 = 21)
b.) 𝑃(𝑋 = 6)
c.) 𝑃(𝑋 = 12)
d.) 𝑃(𝑋 ≤ 14)
e.) 𝑃(𝑋 > 16)
f.) 𝑃(𝑋 < 10)
7.) Approximately 10% of all people are left-handed ("11 little-known facts," 2013).
Consider fifteen randomly selected people.
a.) State the random variable and list the given numbers with correct symbols.
b.) Explain why this is a binomial experiment
Find the probability that
c.) None are left-handed.
d.) Seven are left-handed.
e.) At least two are left-handed.
f.) At most three are left-handed.
g.) At least seven are left-handed.
h.) Seven of the last 15 U.S. Presidents were left-handed. Is this unusual? What
does that tell you?
8.) According to an article in the American Heart Association’s publication
Circulation, 24% of patients who had been hospitalized for an acute myocardial
infarction did not fill their cardiac medication by the seventh day of being
discharged (Ho, Bryson & Rumsfeld, 2009). Suppose there are twelve people
who have been hospitalized for an acute myocardial infarction.
a.) State the random variable and list the given numbers with correct symbols.
b.) Explain why this is a binomial experiment
Find the probability that
c.) All filled their cardiac medication.
d.) Seven did not fill their cardiac medication.
e.) None filled their cardiac medication.
f.) At most two did not fill their cardiac medication.
g.) At least ten did not fill their cardiac medication.
h.) Suppose of the next twelve patients discharged, ten did not fill their cardiac
medication, would this be unusual? What does this tell you
24. Chapter 5: Discrete Probability Distributions
167
9.) Eyeglassomatic manufactures eyeglasses for different retailers. In March 2010,
they tested to see how many defective lenses they made, and there were 16.9%
defective lenses due to scratches. Suppose Eyeglassomatic examined twenty pairs
of eyeglasses.
a.) State the random variable and list the given numbers with correct symbols.
b.) Explain why this is a binomial experiment
Find the probability that
c.) None are scratched.
d.) All are scratched.
e.) At least three are scratched.
f.) At most five are scratched.
g.) At least ten are scratched.
h.) Is it unusual for ten lenses to be scratched? If it turns out that ten lenses out of
twenty are scratched, what might that tell you about the manufacturing
process?
10.) The proportion of brown M&M’s in a milk chocolate packet is approximately
14% (Madison, 2013). Suppose a package of M&M’s typically contains 52
M&M’s.
a.) State the random variable and list the given numbers with correct symbols.
b.) Explain why this is a binomial experiment
Find the probability that
c.) Six M&M’s are brown.
d.) Twenty-five M&M’s are brown.
e.) All of the M&M’s are brown.
f.) Would it be unusual for a package to have only brown M&M’s? If this were
to happen, what would you think is the reason?
25. Chapter 5: Discrete Probability Distributions
168
Section 5.3 Mean and Standard Deviation of Binomial
Distribution
If you list all possible values of a random variable X that has a Binomial distribution
along with each corresponding probability, you get the Binomial Probability
Distribution (pdf). You can draw a histogram of the pdf and find the mean and standard
deviation of it.
For any discrete probability distribution, you can find the mean and standard deviation
for the random variable X using the general formulas:
𝜇 𝑥 = ∑ 𝑥𝑃(𝑥) and 𝜎𝑥 = √( 𝑥 − 𝜇 𝑥)2 ∙ 𝑃(𝑥)
These are really just weighted averages and so we computed these using two lists and 1-
Var Stats on the TI84.
These formulas are useful, but if you know the type of distribution, like Binomial, then
you can find the mean and standard deviation using easier formulas (and by not having to
enter two lists of numbers). They are derived from the general formulas.
For a Binomial distribution, 𝜇 𝑥, the expected number of successes in n trials and 𝜎𝑥, the
standard deviation for the number of success in n trials, are given by the formulas:
𝜇 𝑥 = 𝑛𝑝 and 𝜎𝑥 = √( 𝑛𝑝(1 − 𝑝))
Where p is the probability of success and n is the sample size.
Example #5.3.1: Finding the Probability Distribution, Mean and Standard
Deviation of a Binomial Distribution
When looking at a person’s eye color, it turns out that 1% of people in the world
has green eyes ("What percentage of," 2013). Consider a group of 20 people.
a.) State the random variable and list the givens with the correct symbols.
Solution:
rv X = number of people who have green eyes out of 20
p = 0.01 and n = 20
b.) Write the probability distribution table.
Solution:
In this case you need to write each value of x and its corresponding
probability. It is easiest to get the probabilities by going into a list on the
calculator and using the binompdf command. Push STAT 1 and then arrow
up to highlight L1.
Then push 2nd VARS scroll until you find binompdf and then push ENTER
If you have the screen on the left, you will enter n,p and then push
ENTER
If you have the screen on the right, you will enter n next to “Trials”
and p next to “p” and leave “x value” blank.
26. Chapter 5: Discrete Probability Distributions
169
or
Then push ENTER or highlight “Paste” and push ENTER ENTER
This gives you the following values in L1. These are the values of P(X = 0),
P(X = 1), etc. in order.
This produces the information in table #5.3.1
Table #5.3.1: Probability Distribution for Number of People with Green
Eyes
x P(X = x)
0 0.818
1 0.165
2 0.016
3 0.001
4 0.000
5 0.000
6 0.000
7 0.000
8 0.000
9 0.000
10 0.000
M
20 0.000
Notice that after x = 4, the probability values are all rounded to 0.000. This
just means the probabilities of those values are really small numbers.
c.) Draw a histogram.
Solution:
You can draw the binomial histogram using StatCrunch. Use Stat,
Calculators, Binomial. Fill in n = 20 and p =0.01. Although we are not asked
to compute a probability, we are going to enter 𝑃(𝑋 ≥ 0) so that we get a
graph with all of the bars from 0 to 20. StatCrunch uses sticks instead of bars
when the distribution is discrete. This still gives us a picture from which we
can determine shape. The graph would look like figure #5.3.1.
27. Chapter 5: Discrete Probability Distributions
170
Figure #5.3.1: Histogram (sort of) Created on StatCrunch
In the output above, the axis looks like it ends at 3, but it really runs out to 20.
It’s just that the probabilities are so small past x = 3 that StatCrunch doesn’t
bother displaying them. So considering that the axis runs out to 20, this graph
is very skewed to the right.
d.) Find the mean.
Solution:
Since this is a binomial experiment, you can use the formula 𝜇 𝑥 = 𝑛𝑝.
𝜇 𝑥 = 𝑛𝑝 = 20(0.01) = 0.2 people
Interpret:
So you expect an average of 0.2 people with green eyes out of every 20
people. (This would be the same as saying we expect about 2 people with
green eyes out of every 200 people).
e.) Find the standard deviation.
Solution:
Since this is binomial you can use the formula 𝜎𝑥 = √( 𝑛𝑝(1 − 𝑝)).
𝜎𝑥 = √(20 ∙ 0.01(1 − 0.01)) ≈ 0.445 people
28. Chapter 5: Discrete Probability Distributions
171
Section5.3:Homework
1.) Suppose a random variable, X, arises from a binomial experiment. Suppose n =
6, and p = 0.13.
a.) Write the probability distribution. Round values to 3 decimal places.
b.) Draw a histogram.
c.) Describe the shape of the histogram.
d.) Find the mean.
e.) Find the standard deviation.
2.) Suppose a random variable, X, arises from a binomial experiment. Suppose n =
10, and p = 0.81.
a.) Write the probability distribution. Round values to 3 decimal places.
b.) Draw a histogram.
c.) Describe the shape of the histogram.
d.) Find the mean.
e.) Find the standard deviation.
3.) Suppose a random variable, X, arises from a binomial experiment. Suppose n =
7, and p = 0.50.
a.) Write the probability distribution. Round values to 3 decimal places.
b.) Draw a histogram.
c.) Describe the shape of the histogram.
d.) Find the mean.
e.) Find the standard deviation.
4.) Look at the values of p and the distribution shapes for problems 1, 2 and 3. What
do you notice?
5.) Approximately 10% of all people are left-handed. Consider a grouping of fifteen
people.
a.) State the random variable.
b.) List the given numeric values with the correct notation.
c.) Find the mean and interpret it in the context of this problem.
d.) Find the standard deviation.
6.) According to an article in the American Heart Association’s publication
Circulation, 24% of patients who had been hospitalized for an acute myocardial
infarction did not fill their cardiac medication by the seventh day of being
discharged (Ho, Bryson & Rumsfeld, 2009). Suppose there are twelve people
who have been hospitalized for an acute myocardial infarction.
a.) State the random variable.
b.) List the given numeric values with the correct notation.
c.) Find the mean and interpret it in the context of this problem.
d.) Find the standard deviation.
29. Chapter 5: Discrete Probability Distributions
172
7.) Eyeglassomatic manufactures eyeglasses for different retailers. In March 2010,
they tested to see how many defective lenses they made, and there were 16.9%
defective lenses due to scratches. Suppose Eyeglassomatic examined twenty pairs
of eyeglasses.
a.) State the random variable.
b.) List the given numeric values with the correct notation.
c.) Find the mean and interpret it in the context of this problem.
d.) Find the standard deviation.
8.) The proportion of brown M&M’s in a milk chocolate packet is approximately
14% (Madison, 2013). Suppose a package of M&M’s typically contains 52
M&M’s.
a.) State the random variable.
b.) List the given numeric values with the correct notation.
c.) Find the mean and interpret it in the context of this problem.
d.) Find the standard deviation.
Data Sources:
11 little-known facts about left-handers. (2013, October 21). Retrieved from
http://www.huffingtonpost.com/2012/10/29/left-handed-facts-lefties_n_2005864.html
CDC-data and statistics, autism spectrum disorders - ncbdd. (2013, October 21).
Retrieved from http://www.cdc.gov/ncbddd/autism/data.html
Ho, P. M., Bryson, C. L., & Rumsfeld, J. S. (2009). Medication adherence. Circulation,
119(23), 3028-3035. Retrieved from http://circ.ahajournals.org/content/119/23/3028
Households by age of householder and size of household: 1990 to 2010. (2013, October
19). Retrieved from http://www.census.gov/compendia/statab/2012/tables/12s0062.pdf
Madison, J. (2013, October 15). M&M's color distribution analysis. Retrieved from
http://joshmadison.com/2007/12/02/mms-color-distribution-analysis/
What percentage of people have green eyes?. (2013, October 21). Retrieved from
http://www.ask.com/question/what-percentage-of-people-have-green-eyes