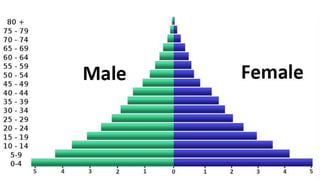
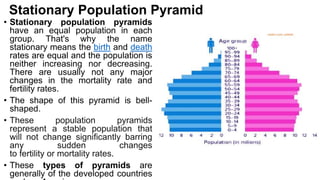
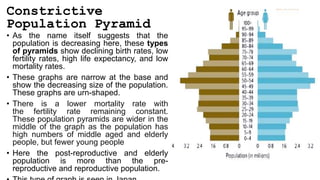
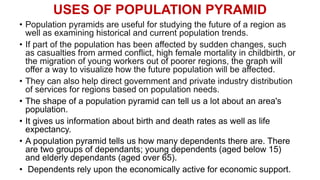
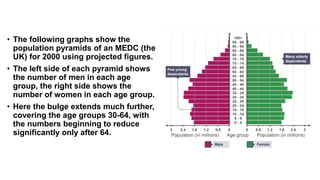
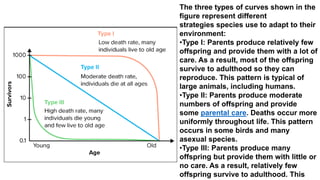
SlideShare a Scribd company logo
POPULATION
STRUCTURE
WHAT IS POPULATION STRUCTURE?
• Population structure is defined by the organization of
genetic variation and is driven by the combined effects
of evolutionary processes that include recombination,
mutation, genetic drift, demographic history, and natural
selection.
• Population structure analysis is essential for studying
population dynamics, predicting future trends,
formulating targeted policies, and addressing social,
economic, and healthcare challenges effectively.
Key elements of population structure
• The key elements of population structure include:
1.Population Size: This refers to the total number of individuals in a given population. It is an important
parameter to understand the scale and magnitude of the population.
2.Geographic Distribution: It describes how the population is spread out across a specific geographic area. It
can be measured in terms of density, which indicates the number of individuals per unit of land area.
3.Age Distribution: This refers to the proportion of individuals in different age groups within a population. Age
distribution provides insights into the population's past and future growth trends, as well as its potential
support ratio (the number of working-age individuals relative to dependents).
4.Sex Ratio: The sex ratio represents the proportion of males to females within a population. It is usually
expressed as the number of males per 100 females. A balanced sex ratio is generally considered to be
around 105 males to 100 females at birth.
5.Ethnic or Racial Composition: Population structure may also include information about the ethnic or racial
composition of a population. This data provides insights into the diversity and cultural makeup of the
population.
6.Socioeconomic Factors: Population structure can also be analyzed based on socioeconomic factors such as
income, education level, occupation, and housing conditions. These factors shed light on the social and
economic characteristics of the population.
• Understanding population structure is crucial for policymakers, social scientists, and planners as it helps
them develop policies and interventions that address specific demographic challenges and meet the needs
of different population groups. Additionally, population structure influences various aspects of society,
Population pyramids
• An important factor in population growth is age-sex structure. This is the
number of individuals of each sex and age in the population.
• Population structure is usually shown using a population pyramid
• A population pyramid is the graphical representation of the distribution of the
population by sex, and age group.
• It takes the shape of a pyramid when the population is growing. Population
pyramids are also known as age pyramids because it is a graphical
representation of age.
• A population pyramid, also called an age pyramid or age picture is a graphical
illustration that shows the distribution of various age groups in a population
(country), which forms the shape of a pyramid when the population is
growing.
• It usually consists of two back-to-back histograms, with the population plotted
on the X-axis and age on the Y-axis, one showing the number of males and
one showing females in a particular population in five-year age groups (also
called cohorts).
• Males are conventionally shown on the left and females on the right, and they
How do pyramids change over time?
• A population pyramid that is very triangular (eg Mozambique in
2000) shows a population with a high number of young
dependants and a low life expectancy.
• A population pyramid that has fairly straight sides (more like a
barrel) shows a population with a falling birth rate and a rising life
expectancy. • Over time, as a country develops, the shape
changes from triangular to barrel-like.
• Places with an ageing population and a very low birth rate
would have a structure that looks like an upside-down pyramid.
On average, w
Types
•Expansive
•Stationary
•Constrictive
Expansive Pyramid
• These types of pyramids have a much
larger population of pre-reproductive
and reproductive age groups and a
population of post-reproductive age
groups is very less compared to pre-
reproductive and reproductive age
groups.
• These types of pyramids are seen in
developing countries. Here in these
countries, the fertility rate is usually
high but life expectancy is very less. So
the base of the pyramid is wide and
tapers towards the top with a triangular
shape.
• Examples of countries having
expansive pyramids are India and
Nigeria.
Stationary Population Pyramid
• Stationary population pyramids
have an equal population in each
group. That's why the name
stationary means the birth and death
rates are equal and the population is
neither increasing nor decreasing.
There are usually not any major
changes in the mortality rate and
fertility rates.
• The shape of this pyramid is bell-
shaped.
• These population pyramids
represent a stable population that
will not change significantly barring
any sudden changes
to fertility or mortality rates.
• These types of pyramids are
generally of the developed countries
Constrictive
Population Pyramid
• As the name itself suggests that the
population is decreasing here, these types
of pyramids show declining birth rates, low
fertility rates, high life expectancy, and low
mortality rates.
• These graphs are narrow at the base and
show the decreasing size of the population.
These graphs are urn-shaped.
• There is a lower mortality rate with
the fertility rate remaining constant.
These population pyramids are wider in the
middle of the graph as the population has
high numbers of middle aged and elderly
people, but fewer young people
• Here the post-reproductive and elderly
population is more than the pre-
reproductive and reproductive population.
USES OF POPULATION PYRAMID
• Population pyramids are useful for studying the future of a region as
well as examining historical and current population trends.
• If part of the population has been affected by sudden changes, such
as casualties from armed conflict, high female mortality in childbirth, or
the migration of young workers out of poorer regions, the graph will
offer a way to visualize how the future population will be affected.
• They can also help direct government and private industry distribution
of services for regions based on population needs.
• The shape of a population pyramid can tell us a lot about an area's
population.
• It gives us information about birth and death rates as well as life
expectancy.
• A population pyramid tells us how many dependents there are. There
are two groups of dependants; young dependents (aged below 15)
and elderly dependants (aged over 65).
• Dependents rely upon the economically active for economic support.
• The following graphs show the
population pyramids of an MEDC (the
UK) for 2000 using projected figures.
• The left side of each pyramid shows
the number of men in each age
group, the right side shows the
number of women in each age group.
• Here the bulge extends much further,
covering the age groups 30-64, with
the numbers beginning to reduce
significantly only after 64.
Survivorship Curves
• Another way to show how deaths affect populations is
with survivorship curves. These are graphs that represent the
number of individuals still alive at each age.
The three types of curves shown in the
figure represent different
strategies species use to adapt to their
environment:
•Type I: Parents produce relatively few
offspring and provide them with a lot of
care. As a result, most of the offspring
survive to adulthood so they can
reproduce. This pattern is typical of
large animals, including humans.
•Type II: Parents produce moderate
numbers of offspring and provide
some parental care. Deaths occur more
uniformly throughout life. This pattern
occurs in some birds and many
asexual species.
•Type III: Parents produce many
offspring but provide them with little or
no care. As a result, relatively few
offspring survive to adulthood. This
META POPULATION THEORY
WHAT IS METAPOPULATION?
• A metapopulation is a spatially structured population that
persists over time as a set of local populations with limited
dispersal between them. At equilibrium, the frequencies of local
extinctions and colonization are in balance.
• As local populations of a given species fluctuate in size, they
become vulnerable to extinction during periods when their
numbers are low. Extinction of local populations is common in
some species, and the regional persistence of such species is
dependent on the existence of a metapopulation. Hence,
elimination of much of the metapopulation structure of some
species can increase the chance of regional extinction of
species.
• The structure of metapopulations varies among species.
• In some species one population may be particularly stable over
time and act as the source of recruits into other, less stable
populations.
• For example, populations of the
checkerspot butterfly (Euphydryas editha) in California have a
metapopulation structure consisting of a number of small
satellite populations that surround a large source population on
which they rely for new recruits.
• The satellite populations are too small and fluctuate too much to
maintain themselves indefinitely. Elimination of the source
population from this metapopulation would probably result in the
eventual extinction of the smaller satellite populations.
• Populations of butterflies and coral-reef fishes are good
examples of metapopulation .
• Butterflies often have fragmented habitats, with patches of
suitable environments spread across a larger landscape. Each
patch supports a local population of butterflies. However, these
patches may not be large enough or interconnected to sustain a
viable population on their own. In this scenario, the butterfly
populations within each patch are considered subpopulations of
a metapopulation.
• Butterfly metapopulations exhibit a pattern of local extinction
and recolonization. Local populations can go extinct due to
various factors such as habitat destruction, environmental
changes, or stochastic events. However, nearby patches can
act as sources of individuals that recolonize the vacant patches,
thereby reestablishing the local populations. The success of
recolonization depends on factors such as dispersal ability,
• Coral reefs are complex and diverse ecosystems composed of various
interconnected habitats. Within a coral reef system, different habitats such as
coral heads, patches of seagrass, and rocky outcrops can serve as local
populations of fishes.
• Coral-reef fish metapopulations are influenced by factors such as larval
dispersal and habitat availability. Many coral-reef fish species have pelagic
larvae that disperse in the ocean currents before settling in specific habitats.
The larvae are carried by currents and can colonize new habitats, maintaining
gene flow and population connectivity. Similarly, local populations can decline or
become locally extinct due to disturbances like coral bleaching, predation, or
overfishing. However, if suitable habitats persist and recruitment of juveniles
occurs, these local populations can recover or be recolonized.
• The metapopulation framework helps us understand the dynamics and
persistence of species in fragmented or heterogeneous environments. It
highlights the importance of connectivity, dispersal, and colonization in
sustaining populations over time. Conservation efforts for these species often
focus on maintaining and enhancing habitat connectivity, protecting critical

More Related Content

Similar to population st [Autosaved].pptx

Population change revision
Population change revisionPopulation change revision
Population change revision
cpugh5345
 
Understanding age sex structure of populations
Understanding age sex structure of populationsUnderstanding age sex structure of populations
Understanding age sex structure of populations
TR Dilip
 
DEMOGRAPHY (2).ppt
DEMOGRAPHY (2).pptDEMOGRAPHY (2).ppt
DEMOGRAPHY (2).ppt
LubambeYasa
 
LECTURE_5.DEMOGRAPHY-BSc.PH.pptx
LECTURE_5.DEMOGRAPHY-BSc.PH.pptxLECTURE_5.DEMOGRAPHY-BSc.PH.pptx
LECTURE_5.DEMOGRAPHY-BSc.PH.pptx
GoldenSamukapa
 
Sociology_Unit_2_-_Lesson_1_-_Population_Studies.pdf
Sociology_Unit_2_-_Lesson_1_-_Population_Studies.pdfSociology_Unit_2_-_Lesson_1_-_Population_Studies.pdf
Sociology_Unit_2_-_Lesson_1_-_Population_Studies.pdf
Amanda179561
 
Human resources viii
Human resources viiiHuman resources viii
Human resources viii
Santosh Kumar
 
Unit 2.ppt
Unit 2.pptUnit 2.ppt
Unit 2.ppt
Mduduzi7
 
Population characteristics
Population characteristics Population characteristics
Population characteristics
EmaSushan
 
8.2 human population
8.2 human population8.2 human population
8.2 human population
jkoryan
 
Demography and family welfare, VI unit in community health nursing
Demography and family welfare, VI unit in community health nursingDemography and family welfare, VI unit in community health nursing
Demography and family welfare, VI unit in community health nursing
ssuser82e099
 
Population pyramids
Population pyramidsPopulation pyramids
Population pyramids
Andy Dorn
 
Population ecologyy
Population ecologyyPopulation ecologyy
Population ecologyy
megha gupta
 
Population ecologyy
Population ecologyyPopulation ecologyy
Population ecologyy
megha gupta
 
Human geography3
Human geography3Human geography3
Human geography3
Lisa Schmidt
 
Demography ppt2
Demography ppt2Demography ppt2
Demography ppt2
freelancer
 
LESSON-3.pptxjsjsisosksjjsjsjzzjjnbnnnjsjsjsn
LESSON-3.pptxjsjsisosksjjsjsjzzjjnbnnnjsjsjsnLESSON-3.pptxjsjsisosksjjsjsjzzjjnbnnnjsjsjsn
LESSON-3.pptxjsjsisosksjjsjsjzzjjnbnnnjsjsjsn
JunrivRivera
 
ARC1 (1).ppt
ARC1 (1).pptARC1 (1).ppt
ARC1 (1).ppt
KifleLentiro1
 
Pyramids and demographic transition
Pyramids and demographic transitionPyramids and demographic transition
Pyramids and demographic transition
gregorygolz
 
Population ecology
Population ecologyPopulation ecology
Population ecology
EmaSushan
 
GEOGRAPHY CAMBRIDGE IGCSE: POPULATION AND MIGRATION
GEOGRAPHY CAMBRIDGE IGCSE: POPULATION AND MIGRATIONGEOGRAPHY CAMBRIDGE IGCSE: POPULATION AND MIGRATION
GEOGRAPHY CAMBRIDGE IGCSE: POPULATION AND MIGRATION
George Dumitrache
 

Similar to population st [Autosaved].pptx (20)

Population change revision
Population change revisionPopulation change revision
Population change revision
 
Understanding age sex structure of populations
Understanding age sex structure of populationsUnderstanding age sex structure of populations
Understanding age sex structure of populations
 
DEMOGRAPHY (2).ppt
DEMOGRAPHY (2).pptDEMOGRAPHY (2).ppt
DEMOGRAPHY (2).ppt
 
LECTURE_5.DEMOGRAPHY-BSc.PH.pptx
LECTURE_5.DEMOGRAPHY-BSc.PH.pptxLECTURE_5.DEMOGRAPHY-BSc.PH.pptx
LECTURE_5.DEMOGRAPHY-BSc.PH.pptx
 
Sociology_Unit_2_-_Lesson_1_-_Population_Studies.pdf
Sociology_Unit_2_-_Lesson_1_-_Population_Studies.pdfSociology_Unit_2_-_Lesson_1_-_Population_Studies.pdf
Sociology_Unit_2_-_Lesson_1_-_Population_Studies.pdf
 
Human resources viii
Human resources viiiHuman resources viii
Human resources viii
 
Unit 2.ppt
Unit 2.pptUnit 2.ppt
Unit 2.ppt
 
Population characteristics
Population characteristics Population characteristics
Population characteristics
 
8.2 human population
8.2 human population8.2 human population
8.2 human population
 
Demography and family welfare, VI unit in community health nursing
Demography and family welfare, VI unit in community health nursingDemography and family welfare, VI unit in community health nursing
Demography and family welfare, VI unit in community health nursing
 
Population pyramids
Population pyramidsPopulation pyramids
Population pyramids
 
Population ecologyy
Population ecologyyPopulation ecologyy
Population ecologyy
 
Population ecologyy
Population ecologyyPopulation ecologyy
Population ecologyy
 
Human geography3
Human geography3Human geography3
Human geography3
 
Demography ppt2
Demography ppt2Demography ppt2
Demography ppt2
 
LESSON-3.pptxjsjsisosksjjsjsjzzjjnbnnnjsjsjsn
LESSON-3.pptxjsjsisosksjjsjsjzzjjnbnnnjsjsjsnLESSON-3.pptxjsjsisosksjjsjsjzzjjnbnnnjsjsjsn
LESSON-3.pptxjsjsisosksjjsjsjzzjjnbnnnjsjsjsn
 
ARC1 (1).ppt
ARC1 (1).pptARC1 (1).ppt
ARC1 (1).ppt
 
Pyramids and demographic transition
Pyramids and demographic transitionPyramids and demographic transition
Pyramids and demographic transition
 
Population ecology
Population ecologyPopulation ecology
Population ecology
 
GEOGRAPHY CAMBRIDGE IGCSE: POPULATION AND MIGRATION
GEOGRAPHY CAMBRIDGE IGCSE: POPULATION AND MIGRATIONGEOGRAPHY CAMBRIDGE IGCSE: POPULATION AND MIGRATION
GEOGRAPHY CAMBRIDGE IGCSE: POPULATION AND MIGRATION
 

Recently uploaded

Micronuclei test.M.sc.zoology.fisheries.
Micronuclei test.M.sc.zoology.fisheries.Micronuclei test.M.sc.zoology.fisheries.
Micronuclei test.M.sc.zoology.fisheries.
Aditi Bajpai
 
The binding of cosmological structures by massless topological defects
The binding of cosmological structures by massless topological defectsThe binding of cosmological structures by massless topological defects
The binding of cosmological structures by massless topological defects
Sérgio Sacani
 
Shallowest Oil Discovery of Turkiye.pptx
Shallowest Oil Discovery of Turkiye.pptxShallowest Oil Discovery of Turkiye.pptx
Shallowest Oil Discovery of Turkiye.pptx
Gokturk Mehmet Dilci
 
The debris of the ‘last major merger’ is dynamically young
The debris of the ‘last major merger’ is dynamically youngThe debris of the ‘last major merger’ is dynamically young
The debris of the ‘last major merger’ is dynamically young
Sérgio Sacani
 
aziz sancar nobel prize winner: from mardin to nobel
aziz sancar nobel prize winner: from mardin to nobelaziz sancar nobel prize winner: from mardin to nobel
aziz sancar nobel prize winner: from mardin to nobel
İsa Badur
 
Oedema_types_causes_pathophysiology.pptx
Oedema_types_causes_pathophysiology.pptxOedema_types_causes_pathophysiology.pptx
Oedema_types_causes_pathophysiology.pptx
muralinath2
 
Thornton ESPP slides UK WW Network 4_6_24.pdf
Thornton ESPP slides UK WW Network 4_6_24.pdfThornton ESPP slides UK WW Network 4_6_24.pdf
Thornton ESPP slides UK WW Network 4_6_24.pdf
European Sustainable Phosphorus Platform
 
Medical Orthopedic PowerPoint Templates.pptx
Medical Orthopedic PowerPoint Templates.pptxMedical Orthopedic PowerPoint Templates.pptx
Medical Orthopedic PowerPoint Templates.pptx
terusbelajar5
 
Deep Software Variability and Frictionless Reproducibility
Deep Software Variability and Frictionless ReproducibilityDeep Software Variability and Frictionless Reproducibility
Deep Software Variability and Frictionless Reproducibility
University of Rennes, INSA Rennes, Inria/IRISA, CNRS
 
The use of Nauplii and metanauplii artemia in aquaculture (brine shrimp).pptx
The use of Nauplii and metanauplii artemia in aquaculture (brine shrimp).pptxThe use of Nauplii and metanauplii artemia in aquaculture (brine shrimp).pptx
The use of Nauplii and metanauplii artemia in aquaculture (brine shrimp).pptx
MAGOTI ERNEST
 
Sharlene Leurig - Enabling Onsite Water Use with Net Zero Water
Sharlene Leurig - Enabling Onsite Water Use with Net Zero WaterSharlene Leurig - Enabling Onsite Water Use with Net Zero Water
Sharlene Leurig - Enabling Onsite Water Use with Net Zero Water
Texas Alliance of Groundwater Districts
 
Compexometric titration/Chelatorphy titration/chelating titration
Compexometric titration/Chelatorphy titration/chelating titrationCompexometric titration/Chelatorphy titration/chelating titration
Compexometric titration/Chelatorphy titration/chelating titration
Vandana Devesh Sharma
 
waterlessdyeingtechnolgyusing carbon dioxide chemicalspdf
waterlessdyeingtechnolgyusing carbon dioxide chemicalspdfwaterlessdyeingtechnolgyusing carbon dioxide chemicalspdf
waterlessdyeingtechnolgyusing carbon dioxide chemicalspdf
LengamoLAppostilic
 
molar-distalization in orthodontics-seminar.pptx
molar-distalization in orthodontics-seminar.pptxmolar-distalization in orthodontics-seminar.pptx
molar-distalization in orthodontics-seminar.pptx
Anagha Prasad
 
如何办理(uvic毕业证书)维多利亚大学毕业证本科学位证书原版一模一样
如何办理(uvic毕业证书)维多利亚大学毕业证本科学位证书原版一模一样如何办理(uvic毕业证书)维多利亚大学毕业证本科学位证书原版一模一样
如何办理(uvic毕业证书)维多利亚大学毕业证本科学位证书原版一模一样
yqqaatn0
 
Eukaryotic Transcription Presentation.pptx
Eukaryotic Transcription Presentation.pptxEukaryotic Transcription Presentation.pptx
Eukaryotic Transcription Presentation.pptx
RitabrataSarkar3
 
Authoring a personal GPT for your research and practice: How we created the Q...
Authoring a personal GPT for your research and practice: How we created the Q...Authoring a personal GPT for your research and practice: How we created the Q...
Authoring a personal GPT for your research and practice: How we created the Q...
Leonel Morgado
 
mô tả các thí nghiệm về đánh giá tác động dòng khí hóa sau đốt
mô tả các thí nghiệm về đánh giá tác động dòng khí hóa sau đốtmô tả các thí nghiệm về đánh giá tác động dòng khí hóa sau đốt
mô tả các thí nghiệm về đánh giá tác động dòng khí hóa sau đốt
HongcNguyn6
 
Phenomics assisted breeding in crop improvement
Phenomics assisted breeding in crop improvementPhenomics assisted breeding in crop improvement
Phenomics assisted breeding in crop improvement
IshaGoswami9
 
Topic: SICKLE CELL DISEASE IN CHILDREN-3.pdf
Topic: SICKLE CELL DISEASE IN CHILDREN-3.pdfTopic: SICKLE CELL DISEASE IN CHILDREN-3.pdf
Topic: SICKLE CELL DISEASE IN CHILDREN-3.pdf
TinyAnderson
 

Recently uploaded (20)

Micronuclei test.M.sc.zoology.fisheries.
Micronuclei test.M.sc.zoology.fisheries.Micronuclei test.M.sc.zoology.fisheries.
Micronuclei test.M.sc.zoology.fisheries.
 
The binding of cosmological structures by massless topological defects
The binding of cosmological structures by massless topological defectsThe binding of cosmological structures by massless topological defects
The binding of cosmological structures by massless topological defects
 
Shallowest Oil Discovery of Turkiye.pptx
Shallowest Oil Discovery of Turkiye.pptxShallowest Oil Discovery of Turkiye.pptx
Shallowest Oil Discovery of Turkiye.pptx
 
The debris of the ‘last major merger’ is dynamically young
The debris of the ‘last major merger’ is dynamically youngThe debris of the ‘last major merger’ is dynamically young
The debris of the ‘last major merger’ is dynamically young
 
aziz sancar nobel prize winner: from mardin to nobel
aziz sancar nobel prize winner: from mardin to nobelaziz sancar nobel prize winner: from mardin to nobel
aziz sancar nobel prize winner: from mardin to nobel
 
Oedema_types_causes_pathophysiology.pptx
Oedema_types_causes_pathophysiology.pptxOedema_types_causes_pathophysiology.pptx
Oedema_types_causes_pathophysiology.pptx
 
Thornton ESPP slides UK WW Network 4_6_24.pdf
Thornton ESPP slides UK WW Network 4_6_24.pdfThornton ESPP slides UK WW Network 4_6_24.pdf
Thornton ESPP slides UK WW Network 4_6_24.pdf
 
Medical Orthopedic PowerPoint Templates.pptx
Medical Orthopedic PowerPoint Templates.pptxMedical Orthopedic PowerPoint Templates.pptx
Medical Orthopedic PowerPoint Templates.pptx
 
Deep Software Variability and Frictionless Reproducibility
Deep Software Variability and Frictionless ReproducibilityDeep Software Variability and Frictionless Reproducibility
Deep Software Variability and Frictionless Reproducibility
 
The use of Nauplii and metanauplii artemia in aquaculture (brine shrimp).pptx
The use of Nauplii and metanauplii artemia in aquaculture (brine shrimp).pptxThe use of Nauplii and metanauplii artemia in aquaculture (brine shrimp).pptx
The use of Nauplii and metanauplii artemia in aquaculture (brine shrimp).pptx
 
Sharlene Leurig - Enabling Onsite Water Use with Net Zero Water
Sharlene Leurig - Enabling Onsite Water Use with Net Zero WaterSharlene Leurig - Enabling Onsite Water Use with Net Zero Water
Sharlene Leurig - Enabling Onsite Water Use with Net Zero Water
 
Compexometric titration/Chelatorphy titration/chelating titration
Compexometric titration/Chelatorphy titration/chelating titrationCompexometric titration/Chelatorphy titration/chelating titration
Compexometric titration/Chelatorphy titration/chelating titration
 
waterlessdyeingtechnolgyusing carbon dioxide chemicalspdf
waterlessdyeingtechnolgyusing carbon dioxide chemicalspdfwaterlessdyeingtechnolgyusing carbon dioxide chemicalspdf
waterlessdyeingtechnolgyusing carbon dioxide chemicalspdf
 
molar-distalization in orthodontics-seminar.pptx
molar-distalization in orthodontics-seminar.pptxmolar-distalization in orthodontics-seminar.pptx
molar-distalization in orthodontics-seminar.pptx
 
如何办理(uvic毕业证书)维多利亚大学毕业证本科学位证书原版一模一样
如何办理(uvic毕业证书)维多利亚大学毕业证本科学位证书原版一模一样如何办理(uvic毕业证书)维多利亚大学毕业证本科学位证书原版一模一样
如何办理(uvic毕业证书)维多利亚大学毕业证本科学位证书原版一模一样
 
Eukaryotic Transcription Presentation.pptx
Eukaryotic Transcription Presentation.pptxEukaryotic Transcription Presentation.pptx
Eukaryotic Transcription Presentation.pptx
 
Authoring a personal GPT for your research and practice: How we created the Q...
Authoring a personal GPT for your research and practice: How we created the Q...Authoring a personal GPT for your research and practice: How we created the Q...
Authoring a personal GPT for your research and practice: How we created the Q...
 
mô tả các thí nghiệm về đánh giá tác động dòng khí hóa sau đốt
mô tả các thí nghiệm về đánh giá tác động dòng khí hóa sau đốtmô tả các thí nghiệm về đánh giá tác động dòng khí hóa sau đốt
mô tả các thí nghiệm về đánh giá tác động dòng khí hóa sau đốt
 
Phenomics assisted breeding in crop improvement
Phenomics assisted breeding in crop improvementPhenomics assisted breeding in crop improvement
Phenomics assisted breeding in crop improvement
 
Topic: SICKLE CELL DISEASE IN CHILDREN-3.pdf
Topic: SICKLE CELL DISEASE IN CHILDREN-3.pdfTopic: SICKLE CELL DISEASE IN CHILDREN-3.pdf
Topic: SICKLE CELL DISEASE IN CHILDREN-3.pdf
 

population st [Autosaved].pptx

  • 2. WHAT IS POPULATION STRUCTURE? • Population structure is defined by the organization of genetic variation and is driven by the combined effects of evolutionary processes that include recombination, mutation, genetic drift, demographic history, and natural selection. • Population structure analysis is essential for studying population dynamics, predicting future trends, formulating targeted policies, and addressing social, economic, and healthcare challenges effectively.
  • 3. Key elements of population structure • The key elements of population structure include: 1.Population Size: This refers to the total number of individuals in a given population. It is an important parameter to understand the scale and magnitude of the population. 2.Geographic Distribution: It describes how the population is spread out across a specific geographic area. It can be measured in terms of density, which indicates the number of individuals per unit of land area. 3.Age Distribution: This refers to the proportion of individuals in different age groups within a population. Age distribution provides insights into the population's past and future growth trends, as well as its potential support ratio (the number of working-age individuals relative to dependents). 4.Sex Ratio: The sex ratio represents the proportion of males to females within a population. It is usually expressed as the number of males per 100 females. A balanced sex ratio is generally considered to be around 105 males to 100 females at birth. 5.Ethnic or Racial Composition: Population structure may also include information about the ethnic or racial composition of a population. This data provides insights into the diversity and cultural makeup of the population. 6.Socioeconomic Factors: Population structure can also be analyzed based on socioeconomic factors such as income, education level, occupation, and housing conditions. These factors shed light on the social and economic characteristics of the population. • Understanding population structure is crucial for policymakers, social scientists, and planners as it helps them develop policies and interventions that address specific demographic challenges and meet the needs of different population groups. Additionally, population structure influences various aspects of society,
  • 4. Population pyramids • An important factor in population growth is age-sex structure. This is the number of individuals of each sex and age in the population. • Population structure is usually shown using a population pyramid • A population pyramid is the graphical representation of the distribution of the population by sex, and age group. • It takes the shape of a pyramid when the population is growing. Population pyramids are also known as age pyramids because it is a graphical representation of age. • A population pyramid, also called an age pyramid or age picture is a graphical illustration that shows the distribution of various age groups in a population (country), which forms the shape of a pyramid when the population is growing. • It usually consists of two back-to-back histograms, with the population plotted on the X-axis and age on the Y-axis, one showing the number of males and one showing females in a particular population in five-year age groups (also called cohorts). • Males are conventionally shown on the left and females on the right, and they
  • 5.
  • 6. How do pyramids change over time? • A population pyramid that is very triangular (eg Mozambique in 2000) shows a population with a high number of young dependants and a low life expectancy. • A population pyramid that has fairly straight sides (more like a barrel) shows a population with a falling birth rate and a rising life expectancy. • Over time, as a country develops, the shape changes from triangular to barrel-like. • Places with an ageing population and a very low birth rate would have a structure that looks like an upside-down pyramid. On average, w
  • 8. Expansive Pyramid • These types of pyramids have a much larger population of pre-reproductive and reproductive age groups and a population of post-reproductive age groups is very less compared to pre- reproductive and reproductive age groups. • These types of pyramids are seen in developing countries. Here in these countries, the fertility rate is usually high but life expectancy is very less. So the base of the pyramid is wide and tapers towards the top with a triangular shape. • Examples of countries having expansive pyramids are India and Nigeria.
  • 9. Stationary Population Pyramid • Stationary population pyramids have an equal population in each group. That's why the name stationary means the birth and death rates are equal and the population is neither increasing nor decreasing. There are usually not any major changes in the mortality rate and fertility rates. • The shape of this pyramid is bell- shaped. • These population pyramids represent a stable population that will not change significantly barring any sudden changes to fertility or mortality rates. • These types of pyramids are generally of the developed countries
  • 10. Constrictive Population Pyramid • As the name itself suggests that the population is decreasing here, these types of pyramids show declining birth rates, low fertility rates, high life expectancy, and low mortality rates. • These graphs are narrow at the base and show the decreasing size of the population. These graphs are urn-shaped. • There is a lower mortality rate with the fertility rate remaining constant. These population pyramids are wider in the middle of the graph as the population has high numbers of middle aged and elderly people, but fewer young people • Here the post-reproductive and elderly population is more than the pre- reproductive and reproductive population.
  • 11. USES OF POPULATION PYRAMID • Population pyramids are useful for studying the future of a region as well as examining historical and current population trends. • If part of the population has been affected by sudden changes, such as casualties from armed conflict, high female mortality in childbirth, or the migration of young workers out of poorer regions, the graph will offer a way to visualize how the future population will be affected. • They can also help direct government and private industry distribution of services for regions based on population needs. • The shape of a population pyramid can tell us a lot about an area's population. • It gives us information about birth and death rates as well as life expectancy. • A population pyramid tells us how many dependents there are. There are two groups of dependants; young dependents (aged below 15) and elderly dependants (aged over 65). • Dependents rely upon the economically active for economic support.
  • 12. • The following graphs show the population pyramids of an MEDC (the UK) for 2000 using projected figures. • The left side of each pyramid shows the number of men in each age group, the right side shows the number of women in each age group. • Here the bulge extends much further, covering the age groups 30-64, with the numbers beginning to reduce significantly only after 64.
  • 13. Survivorship Curves • Another way to show how deaths affect populations is with survivorship curves. These are graphs that represent the number of individuals still alive at each age.
  • 14. The three types of curves shown in the figure represent different strategies species use to adapt to their environment: •Type I: Parents produce relatively few offspring and provide them with a lot of care. As a result, most of the offspring survive to adulthood so they can reproduce. This pattern is typical of large animals, including humans. •Type II: Parents produce moderate numbers of offspring and provide some parental care. Deaths occur more uniformly throughout life. This pattern occurs in some birds and many asexual species. •Type III: Parents produce many offspring but provide them with little or no care. As a result, relatively few offspring survive to adulthood. This
  • 16. WHAT IS METAPOPULATION? • A metapopulation is a spatially structured population that persists over time as a set of local populations with limited dispersal between them. At equilibrium, the frequencies of local extinctions and colonization are in balance. • As local populations of a given species fluctuate in size, they become vulnerable to extinction during periods when their numbers are low. Extinction of local populations is common in some species, and the regional persistence of such species is dependent on the existence of a metapopulation. Hence, elimination of much of the metapopulation structure of some species can increase the chance of regional extinction of species.
  • 17. • The structure of metapopulations varies among species. • In some species one population may be particularly stable over time and act as the source of recruits into other, less stable populations. • For example, populations of the checkerspot butterfly (Euphydryas editha) in California have a metapopulation structure consisting of a number of small satellite populations that surround a large source population on which they rely for new recruits. • The satellite populations are too small and fluctuate too much to maintain themselves indefinitely. Elimination of the source population from this metapopulation would probably result in the eventual extinction of the smaller satellite populations.
  • 18. • Populations of butterflies and coral-reef fishes are good examples of metapopulation . • Butterflies often have fragmented habitats, with patches of suitable environments spread across a larger landscape. Each patch supports a local population of butterflies. However, these patches may not be large enough or interconnected to sustain a viable population on their own. In this scenario, the butterfly populations within each patch are considered subpopulations of a metapopulation. • Butterfly metapopulations exhibit a pattern of local extinction and recolonization. Local populations can go extinct due to various factors such as habitat destruction, environmental changes, or stochastic events. However, nearby patches can act as sources of individuals that recolonize the vacant patches, thereby reestablishing the local populations. The success of recolonization depends on factors such as dispersal ability,
  • 19. • Coral reefs are complex and diverse ecosystems composed of various interconnected habitats. Within a coral reef system, different habitats such as coral heads, patches of seagrass, and rocky outcrops can serve as local populations of fishes. • Coral-reef fish metapopulations are influenced by factors such as larval dispersal and habitat availability. Many coral-reef fish species have pelagic larvae that disperse in the ocean currents before settling in specific habitats. The larvae are carried by currents and can colonize new habitats, maintaining gene flow and population connectivity. Similarly, local populations can decline or become locally extinct due to disturbances like coral bleaching, predation, or overfishing. However, if suitable habitats persist and recruitment of juveniles occurs, these local populations can recover or be recolonized. • The metapopulation framework helps us understand the dynamics and persistence of species in fragmented or heterogeneous environments. It highlights the importance of connectivity, dispersal, and colonization in sustaining populations over time. Conservation efforts for these species often focus on maintaining and enhancing habitat connectivity, protecting critical