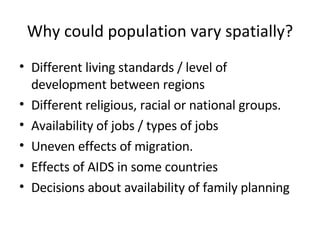
1) Population structures can vary spatially due to differences in living standards, religion, jobs availability, migration patterns, and family planning policies.
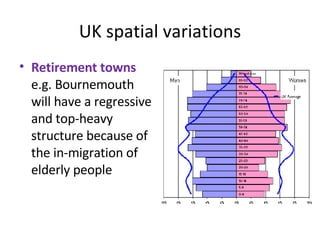
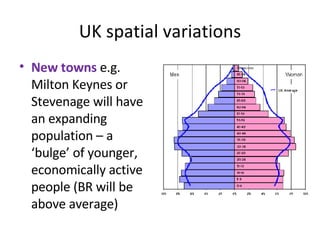
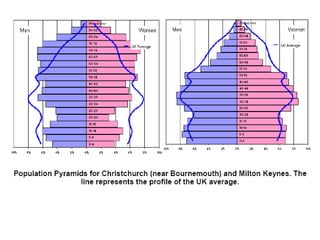
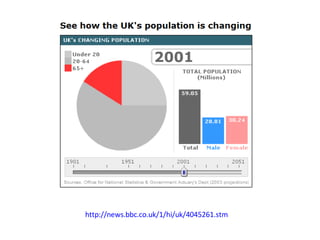
2) In the UK, retirement towns like Bournemouth will have many elderly people, new towns like Milton Keynes will have growing youth populations, and university towns like Oxford will have many young adults. Remote rural areas will see out-migration of youth.
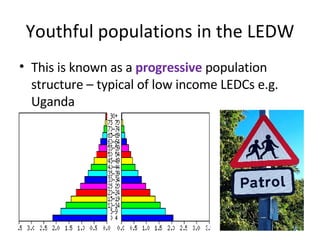
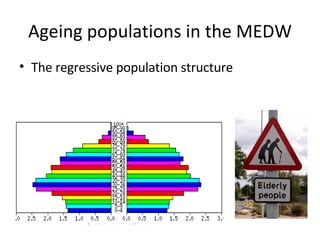
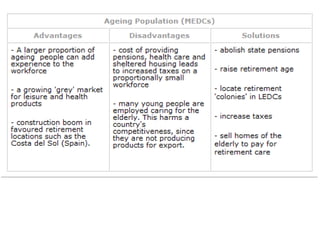
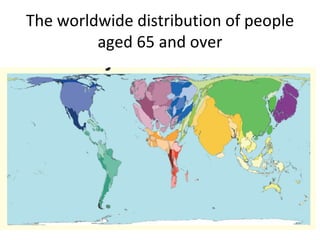
3) Less economically developed countries in Africa and Asia generally have "youthful" population structures with high birth rates, while more developed countries in Europe have "regressive" or aging population structures with low birth rates.


![Getting Started with Apache Spark: Big Data Made Simple [Free Meetup]](https://cdn.slidesharecdn.com/ss_thumbnails/apachesparkgettingstarted-260203175547-8361bcc3-thumbnail.jpg?width=640&height=640&fit=bounds)


