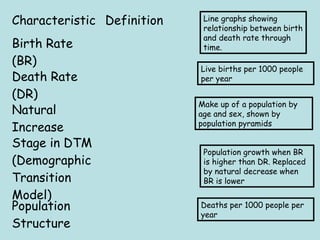
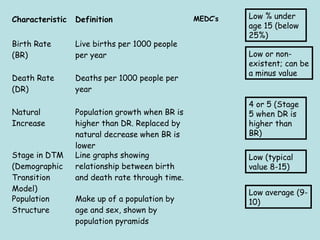
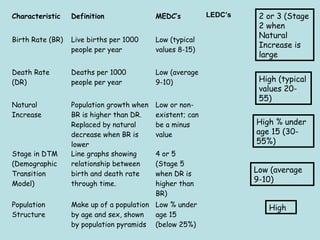
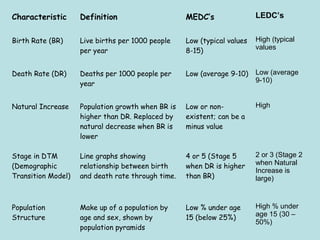
SlideShare a Scribd company logo
Objectives:
•Identify the main differences between MEDC’s and
LEDC’s using population data and population pyramids.
Characteristic Definition
Birth Rate
(BR)
Death Rate
(DR)
Natural
Increase
Stage in DTM
(Demographic
Transition
Model)
Population
Structure
Line graphs showing
relationship between birth
and death rate through
time.
Live births per 1000 people
per year
Make up of a population by
age and sex, shown by
population pyramids
Population growth when BR
is higher than DR. Replaced
by natural decrease when
BR is lower
Deaths per 1000 people per
year
Characteristic Definition MEDC’s
Birth Rate
(BR)
Live births per 1000 people
per year
Death Rate
(DR)
Deaths per 1000 people per
year
Natural
Increase
Population growth when BR is
higher than DR. Replaced by
natural decrease when BR is
lower
Stage in DTM
(Demographic
Transition
Model)
Line graphs showing
relationship between birth
and death rate through time.
Population
Structure
Make up of a population by
age and sex, shown by
population pyramids
Low % under
age 15 (below
25%)
Low or non-
existent; can be
a minus value
4 or 5 (Stage
5 when DR is
higher than
BR)
Low (typical
value 8-15)
Low average (9-
10)
Characteristic Definition MEDC’s LEDC’s
Birth Rate (BR) Live births per 1000
people per year
Low (typical
values 8-15)
Death Rate
(DR)
Deaths per 1000
people per year
Low (average
9-10)
Natural
Increase
Population growth when
BR is higher than DR.
Replaced by natural
decrease when BR is
lower
Low or non-
existent; can
be a minus
value
Stage in DTM
(Demographic
Transition
Model)
Line graphs showing
relationship between
birth and death rate
through time.
4 or 5
(Stage 5
when DR is
higher than
BR)
Population
Structure
Make up of a population
by age and sex, shown
by population pyramids
Low % under
age 15
(below 25%)
2 or 3 (Stage
2 when
Natural
Increase is
large
High (typical
values 20-
55)
High % under
age 15 (30-
55%)
Low (average
9-10)
High
Characteristic Definition MEDC’s LEDC’s
Birth Rate (BR) Live births per 1000 people
per year
Low (typical values
8-15)
High (typical
values
Death Rate (DR) Deaths per 1000 people per
year
Low (average 9-10) Low (average
9-10)
Natural Increase Population growth when BR is
higher than DR. Replaced by
natural decrease when BR is
lower
Low or non-
existent; can be a
minus value
High
Stage in DTM
(Demographic
Transition Model)
Line graphs showing
relationship between birth
and death rate through time.
4 or 5 (Stage 5
when DR is higher
than BR)
2 or 3 (Stage 2
when Natural
Increase is
large)
Population
Structure
Make up of a population by
age and sex, shown by
population pyramids
Low % under age
15 (below 25%)
High % under
age 15 (30 –
50%)
Describe the differences
and similarities between
MEDC’s and LEDC’s from
the table of information
you have produced.
Tasks
Use the population pyramids of Germany and Pakistan to
answer the following questions.
1. How many people are there aged under 15 in (i) Gemany
(ii) Pakistan
2. How many people are there aged over 64 in (i) Germany
(ii) Pakistan
3. How many people are there of working age (20-60) in
(i) Germany
(ii) Pakistan
As identified previously, MEDc’s and LEDC’s often have dramatically
different birth rates, but why is this?
Children can be seen as an
economic cost that reduces
the amount of money left for
purchasing consumer goods
and services.
Women are more career
orientated. They now work
for longer and start families
later in life.
Children seen as an economic
asset. They can provide an
income for families.
Lack of money to be spent on
family planning and education
about family planning
A fall in a country’s birth rate usually accompanies an increase in national
and personal wealth. The national government has more funds to promote
birth control campaigns and to set up family-planning clinics. With
greater wealth, attitudes to children change, as identified previously in
the differences between MEDC’s and LEDC’s.
Lowering the birth rate allows movement to stage 3 of the DTM. If
this continues then transition to stage 4 will occur. This is where most
European countries are at.
Birth Rate per
1000
GDP per capita
(US$)
UK 9 24000
Canada 9 23000
Australia 12 19000
Saudi Arabia 34 8500
Russia 8 4500
China 14 1000
Brazil 19 2500
Peru 23 2000
Algeria 24 1500
Bangladesh 30 700
Mali 49 200
Niger 55 100
Plot the
information
from the table
onto a scatter
graph.
X axis = birth
rate
Y axis = GDP
per capita
Answer the following questions
1. What type of correlation is displayed on your graph?
2. Describe the results produced on the graph?
3. There are 3 anomalies on the graph. Can you identify
them?
4. Explain why these anomalies exist.

More Related Content

What's hot

Measures of fertility
Measures of fertility Measures of fertility
Measures of fertility
Tauseef Jawaid
 
Age sex composition
Age sex compositionAge sex composition
Age sex composition
Bhupen Barman
 
Demographic transition-theory-optimum-population-1
Demographic transition-theory-optimum-population-1Demographic transition-theory-optimum-population-1
Demographic transition-theory-optimum-population-1Vishnu Sasikumar
 
DEFINITIONS
DEFINITIONSDEFINITIONS
DEFINITIONS
Shahzaib Khan
 
Demographic transition theory
Demographic transition theoryDemographic transition theory
Demographic transition theory
Cincau Susu
 
What affects fertility
What affects fertility What affects fertility
What affects fertility
Andy Dorn
 
Demographic Transition
Demographic TransitionDemographic Transition
Demographic TransitionKieron Hunter
 
Thomas Robert Malthus
Thomas Robert MalthusThomas Robert Malthus
Thomas Robert Malthus
ShrishtiChaurasia1
 
GROWTH RATE & ESTIMATED POPULATION INDUSTRIALIZATION/ URBANIZTION
GROWTH RATE & ESTIMATED POPULATION INDUSTRIALIZATION/URBANIZTIONGROWTH RATE & ESTIMATED POPULATION INDUSTRIALIZATION/URBANIZTION
GROWTH RATE & ESTIMATED POPULATION INDUSTRIALIZATION/ URBANIZTION
Kanav Bhanot
 
Life expectancy and infant mortality
Life expectancy and infant mortalityLife expectancy and infant mortality
Life expectancy and infant mortality
SOHAILAHAMED1
 
Malthusian theory and_its_criticisms
Malthusian theory and_its_criticismsMalthusian theory and_its_criticisms
Malthusian theory and_its_criticisms
Taurai Chako
 
Harris-Todaro Migration Model and it's Applicability in Bangladesh
Harris-Todaro Migration Model and it's Applicability in BangladeshHarris-Todaro Migration Model and it's Applicability in Bangladesh
Harris-Todaro Migration Model and it's Applicability in BangladeshMohaiminul Islam
 
Population and Economic Development
Population and Economic Development Population and Economic Development
Population and Economic Development
Nithin Kumar
 
Poverty and Inequality Measurement By Dr. Dario Debowicz
Poverty and Inequality Measurement By Dr. Dario DebowiczPoverty and Inequality Measurement By Dr. Dario Debowicz
Poverty and Inequality Measurement By Dr. Dario Debowicz
International Food Policy Research Institute
 
Basic outline of Theoretical perspectives: Fertility, Mortality, Migration
Basic outline of Theoretical perspectives: Fertility, Mortality, MigrationBasic outline of Theoretical perspectives: Fertility, Mortality, Migration
Basic outline of Theoretical perspectives: Fertility, Mortality, Migration
Ramakrishna Mission Vivekananda Educational and Research Institute
 
1.1.indicators of development
1.1.indicators of development 1.1.indicators of development
1.1.indicators of development
Dr Rajeev Kumar
 
Life table - construction and applications
Life table - construction and applicationsLife table - construction and applications
Fundamentals of demography
Fundamentals of demographyFundamentals of demography
Fundamentals of demographynium
 

What's hot (20)

Measures of fertility
Measures of fertility Measures of fertility
Measures of fertility
 
Age sex composition
Age sex compositionAge sex composition
Age sex composition
 
Measures of fertility
Measures of fertilityMeasures of fertility
Measures of fertility
 
Demographic transition-theory-optimum-population-1
Demographic transition-theory-optimum-population-1Demographic transition-theory-optimum-population-1
Demographic transition-theory-optimum-population-1
 
DEFINITIONS
DEFINITIONSDEFINITIONS
DEFINITIONS
 
Demographic transition theory
Demographic transition theoryDemographic transition theory
Demographic transition theory
 
What affects fertility
What affects fertility What affects fertility
What affects fertility
 
Demographic Transition
Demographic TransitionDemographic Transition
Demographic Transition
 
Measures of mortality
Measures of mortalityMeasures of mortality
Measures of mortality
 
Thomas Robert Malthus
Thomas Robert MalthusThomas Robert Malthus
Thomas Robert Malthus
 
GROWTH RATE & ESTIMATED POPULATION INDUSTRIALIZATION/ URBANIZTION
GROWTH RATE & ESTIMATED POPULATION INDUSTRIALIZATION/URBANIZTIONGROWTH RATE & ESTIMATED POPULATION INDUSTRIALIZATION/URBANIZTION
GROWTH RATE & ESTIMATED POPULATION INDUSTRIALIZATION/ URBANIZTION
 
Life expectancy and infant mortality
Life expectancy and infant mortalityLife expectancy and infant mortality
Life expectancy and infant mortality
 
Malthusian theory and_its_criticisms
Malthusian theory and_its_criticismsMalthusian theory and_its_criticisms
Malthusian theory and_its_criticisms
 
Harris-Todaro Migration Model and it's Applicability in Bangladesh
Harris-Todaro Migration Model and it's Applicability in BangladeshHarris-Todaro Migration Model and it's Applicability in Bangladesh
Harris-Todaro Migration Model and it's Applicability in Bangladesh
 
Population and Economic Development
Population and Economic Development Population and Economic Development
Population and Economic Development
 
Poverty and Inequality Measurement By Dr. Dario Debowicz
Poverty and Inequality Measurement By Dr. Dario DebowiczPoverty and Inequality Measurement By Dr. Dario Debowicz
Poverty and Inequality Measurement By Dr. Dario Debowicz
 
Basic outline of Theoretical perspectives: Fertility, Mortality, Migration
Basic outline of Theoretical perspectives: Fertility, Mortality, MigrationBasic outline of Theoretical perspectives: Fertility, Mortality, Migration
Basic outline of Theoretical perspectives: Fertility, Mortality, Migration
 
1.1.indicators of development
1.1.indicators of development 1.1.indicators of development
1.1.indicators of development
 
Life table - construction and applications
Life table - construction and applicationsLife table - construction and applications
Life table - construction and applications
 
Fundamentals of demography
Fundamentals of demographyFundamentals of demography
Fundamentals of demography
 

Viewers also liked

The Ocean
The OceanThe Ocean
The Oceanmshaw8
 
Demographic Transition Model
Demographic Transition ModelDemographic Transition Model
Demographic Transition Modelcheergalsal
 
Population Distribution & Density
Population Distribution & DensityPopulation Distribution & Density
Population Distribution & Densityclemaitre
 
Tectonics: Intrusive Igneous Features
Tectonics: Intrusive Igneous FeaturesTectonics: Intrusive Igneous Features
Tectonics: Intrusive Igneous Features
geomillie
 
Birth Rates And Death Rates, Lesson 1.
Birth Rates And Death Rates, Lesson 1.Birth Rates And Death Rates, Lesson 1.
Birth Rates And Death Rates, Lesson 1.SHS Geog
 
Migration
MigrationMigration
Migrationljordan
 
Understanding Population Pyramids
Understanding Population PyramidsUnderstanding Population Pyramids
Understanding Population Pyramids
Lina Nandy
 
Water Cycle[1] Power Point
Water Cycle[1] Power PointWater Cycle[1] Power Point
Water Cycle[1] Power Point
jwilliams25
 
Rocks And The Rock Cycle
Rocks And  The  Rock  CycleRocks And  The  Rock  Cycle
Rocks And The Rock Cycle
Mr.Thurston
 
Population ppt
Population ppt Population ppt
Population ppt
SBrooker
 

Viewers also liked (11)

The Ocean
The OceanThe Ocean
The Ocean
 
VOLCANOES
VOLCANOESVOLCANOES
VOLCANOES
 
Demographic Transition Model
Demographic Transition ModelDemographic Transition Model
Demographic Transition Model
 
Population Distribution & Density
Population Distribution & DensityPopulation Distribution & Density
Population Distribution & Density
 
Tectonics: Intrusive Igneous Features
Tectonics: Intrusive Igneous FeaturesTectonics: Intrusive Igneous Features
Tectonics: Intrusive Igneous Features
 
Birth Rates And Death Rates, Lesson 1.
Birth Rates And Death Rates, Lesson 1.Birth Rates And Death Rates, Lesson 1.
Birth Rates And Death Rates, Lesson 1.
 
Migration
MigrationMigration
Migration
 
Understanding Population Pyramids
Understanding Population PyramidsUnderstanding Population Pyramids
Understanding Population Pyramids
 
Water Cycle[1] Power Point
Water Cycle[1] Power PointWater Cycle[1] Power Point
Water Cycle[1] Power Point
 
Rocks And The Rock Cycle
Rocks And  The  Rock  CycleRocks And  The  Rock  Cycle
Rocks And The Rock Cycle
 
Population ppt
Population ppt Population ppt
Population ppt
 

Similar to Population and Development

Mhahm d ip_ha_17-1-2017_mortality & standardization of death rates
Mhahm d ip_ha_17-1-2017_mortality & standardization of death ratesMhahm d ip_ha_17-1-2017_mortality & standardization of death rates
Mhahm d ip_ha_17-1-2017_mortality & standardization of death rates
Mmedsc Hahm
 
AS GEOGRAPHY POPULATION
AS GEOGRAPHY POPULATIONAS GEOGRAPHY POPULATION
AS GEOGRAPHY POPULATION
George Dumitrache
 
Demography
DemographyDemography
Demography
sumairariaz5
 
Global classrooms dossier
Global classrooms dossierGlobal classrooms dossier
Global classrooms dossier
Gema
 
Demography
DemographyDemography
Demography
Jeff Weichel
 
Population by suresh kumar kundur
Population by suresh kumar kundurPopulation by suresh kumar kundur
Population by suresh kumar kundur
PRINCIPAL in EURO SCHOOL Hassan
 
8299177.ppt bbbbbbbbbbbbbbbbbbbbbbbbbbbbbbb
8299177.ppt    bbbbbbbbbbbbbbbbbbbbbbbbbbbbbbb8299177.ppt    bbbbbbbbbbbbbbbbbbbbbbbbbbbbbbb
8299177.ppt bbbbbbbbbbbbbbbbbbbbbbbbbbbbbbb
mhosn627
 
Population Structure
Population  StructurePopulation  Structure
Population Structureljordan
 
Population Structure
Population StructurePopulation Structure
Population Structureljordan
 
1.1 Population Change
1.1 Population Change1.1 Population Change
1.1 Population Change
jodiecmills
 
Population structure lesson4
Population structure lesson4Population structure lesson4
Population structure lesson4Ms Geoflake
 
Demography slides
Demography slidesDemography slides
Demography slides
Raj Wali
 
S2 GE Slides - Population Pyramid
S2 GE Slides - Population PyramidS2 GE Slides - Population Pyramid
S2 GE Slides - Population PyramidLEEENNA
 
Population growth lesson3
Population growth lesson3Population growth lesson3
Population growth lesson3Ms Geoflake
 
demography lecture -2022.pptx
demography lecture -2022.pptxdemography lecture -2022.pptx
demography lecture -2022.pptx
Rizwan Saeed
 
Indicators of development
Indicators of developmentIndicators of development
Indicators of developmentZeenia Ahmed
 
population dynamics and its definitionss
population dynamics and its definitionsspopulation dynamics and its definitionss
population dynamics and its definitionss
rafiaimtiaz14
 
Demography lec-2023-Rizwan-Saeed-ANMC.pptx
Demography lec-2023-Rizwan-Saeed-ANMC.pptxDemography lec-2023-Rizwan-Saeed-ANMC.pptx
Demography lec-2023-Rizwan-Saeed-ANMC.pptx
Rizwan Saeed
 
GEOGRAPHY CAMBRIDGE IGCSE: POPULATION AND MIGRATION
GEOGRAPHY CAMBRIDGE IGCSE: POPULATION AND MIGRATIONGEOGRAPHY CAMBRIDGE IGCSE: POPULATION AND MIGRATION
GEOGRAPHY CAMBRIDGE IGCSE: POPULATION AND MIGRATION
George Dumitrache
 

Similar to Population and Development (20)

Mhahm d ip_ha_17-1-2017_mortality & standardization of death rates
Mhahm d ip_ha_17-1-2017_mortality & standardization of death ratesMhahm d ip_ha_17-1-2017_mortality & standardization of death rates
Mhahm d ip_ha_17-1-2017_mortality & standardization of death rates
 
AS GEOGRAPHY POPULATION
AS GEOGRAPHY POPULATIONAS GEOGRAPHY POPULATION
AS GEOGRAPHY POPULATION
 
Demography
DemographyDemography
Demography
 
Global classrooms dossier
Global classrooms dossierGlobal classrooms dossier
Global classrooms dossier
 
Pop. Dynamics
Pop. DynamicsPop. Dynamics
Pop. Dynamics
 
Demography
DemographyDemography
Demography
 
Population by suresh kumar kundur
Population by suresh kumar kundurPopulation by suresh kumar kundur
Population by suresh kumar kundur
 
8299177.ppt bbbbbbbbbbbbbbbbbbbbbbbbbbbbbbb
8299177.ppt    bbbbbbbbbbbbbbbbbbbbbbbbbbbbbbb8299177.ppt    bbbbbbbbbbbbbbbbbbbbbbbbbbbbbbb
8299177.ppt bbbbbbbbbbbbbbbbbbbbbbbbbbbbbbb
 
Population Structure
Population  StructurePopulation  Structure
Population Structure
 
Population Structure
Population StructurePopulation Structure
Population Structure
 
1.1 Population Change
1.1 Population Change1.1 Population Change
1.1 Population Change
 
Population structure lesson4
Population structure lesson4Population structure lesson4
Population structure lesson4
 
Demography slides
Demography slidesDemography slides
Demography slides
 
S2 GE Slides - Population Pyramid
S2 GE Slides - Population PyramidS2 GE Slides - Population Pyramid
S2 GE Slides - Population Pyramid
 
Population growth lesson3
Population growth lesson3Population growth lesson3
Population growth lesson3
 
demography lecture -2022.pptx
demography lecture -2022.pptxdemography lecture -2022.pptx
demography lecture -2022.pptx
 
Indicators of development
Indicators of developmentIndicators of development
Indicators of development
 
population dynamics and its definitionss
population dynamics and its definitionsspopulation dynamics and its definitionss
population dynamics and its definitionss
 
Demography lec-2023-Rizwan-Saeed-ANMC.pptx
Demography lec-2023-Rizwan-Saeed-ANMC.pptxDemography lec-2023-Rizwan-Saeed-ANMC.pptx
Demography lec-2023-Rizwan-Saeed-ANMC.pptx
 
GEOGRAPHY CAMBRIDGE IGCSE: POPULATION AND MIGRATION
GEOGRAPHY CAMBRIDGE IGCSE: POPULATION AND MIGRATIONGEOGRAPHY CAMBRIDGE IGCSE: POPULATION AND MIGRATION
GEOGRAPHY CAMBRIDGE IGCSE: POPULATION AND MIGRATION
 

More from abblanchgeography

Environmental lack of development
Environmental lack of developmentEnvironmental lack of development
Environmental lack of developmentabblanchgeography
 
Causes of the lack of development
Causes of the lack of developmentCauses of the lack of development
Causes of the lack of developmentabblanchgeography
 
Water availability and quality
Water availability and qualityWater availability and quality
Water availability and qualityabblanchgeography
 
Measuring Development
Measuring DevelopmentMeasuring Development
Measuring Development
abblanchgeography
 
Creating a weblog
Creating a weblogCreating a weblog
Creating a weblog
abblanchgeography
 
OS Symbols Bingo Game
OS Symbols Bingo GameOS Symbols Bingo Game
OS Symbols Bingo Game
abblanchgeography
 

More from abblanchgeography (16)

Arran Day 4
Arran Day 4Arran Day 4
Arran Day 4
 
Arran Day Part 3
Arran Day Part 3Arran Day Part 3
Arran Day Part 3
 
Arram Day 3 Part 1
Arram Day 3 Part 1Arram Day 3 Part 1
Arram Day 3 Part 1
 
Arran Day 3 Part 2
Arran Day 3 Part 2Arran Day 3 Part 2
Arran Day 3 Part 2
 
Arran Day Part 2
Arran Day Part 2Arran Day Part 2
Arran Day Part 2
 
Arran Day 2
Arran Day 2Arran Day 2
Arran Day 2
 
Arran Day 1
Arran Day 1Arran Day 1
Arran Day 1
 
Economic Activity notes
Economic Activity notesEconomic Activity notes
Economic Activity notes
 
Environmental lack of development
Environmental lack of developmentEnvironmental lack of development
Environmental lack of development
 
Causes of the lack of development
Causes of the lack of developmentCauses of the lack of development
Causes of the lack of development
 
Aid
AidAid
Aid
 
Water availability and quality
Water availability and qualityWater availability and quality
Water availability and quality
 
Water Quality
Water QualityWater Quality
Water Quality
 
Measuring Development
Measuring DevelopmentMeasuring Development
Measuring Development
 
Creating a weblog
Creating a weblogCreating a weblog
Creating a weblog
 
OS Symbols Bingo Game
OS Symbols Bingo GameOS Symbols Bingo Game
OS Symbols Bingo Game
 

Recently uploaded

Pulmonary Thromboembolism - etilogy, types, medical- Surgical and nursing man...
Pulmonary Thromboembolism - etilogy, types, medical- Surgical and nursing man...Pulmonary Thromboembolism - etilogy, types, medical- Surgical and nursing man...
Pulmonary Thromboembolism - etilogy, types, medical- Surgical and nursing man...
VarunMahajani
 
basicmodesofventilation2022-220313203758.pdf
basicmodesofventilation2022-220313203758.pdfbasicmodesofventilation2022-220313203758.pdf
basicmodesofventilation2022-220313203758.pdf
aljamhori teaching hospital
 
THOA 2.ppt Human Organ Transplantation Act
THOA 2.ppt Human Organ Transplantation ActTHOA 2.ppt Human Organ Transplantation Act
THOA 2.ppt Human Organ Transplantation Act
DrSathishMS1
 
Antiulcer drugs Advance Pharmacology .pptx
Antiulcer drugs Advance Pharmacology .pptxAntiulcer drugs Advance Pharmacology .pptx
Antiulcer drugs Advance Pharmacology .pptx
Rohit chaurpagar
 
Hemodialysis: Chapter 3, Dialysis Water Unit - Dr.Gawad
Hemodialysis: Chapter 3, Dialysis Water Unit - Dr.GawadHemodialysis: Chapter 3, Dialysis Water Unit - Dr.Gawad
Hemodialysis: Chapter 3, Dialysis Water Unit - Dr.Gawad
NephroTube - Dr.Gawad
 
For Better Surat #ℂall #Girl Service ❤85270-49040❤ Surat #ℂall #Girls
For Better Surat #ℂall #Girl Service ❤85270-49040❤ Surat #ℂall #GirlsFor Better Surat #ℂall #Girl Service ❤85270-49040❤ Surat #ℂall #Girls
For Better Surat #ℂall #Girl Service ❤85270-49040❤ Surat #ℂall #Girls
Savita Shen $i11
 
Non-respiratory Functions of the Lungs.pdf
Non-respiratory Functions of the Lungs.pdfNon-respiratory Functions of the Lungs.pdf
Non-respiratory Functions of the Lungs.pdf
MedicoseAcademics
 
Superficial & Deep Fascia of the NECK.pptx
Superficial & Deep Fascia of the NECK.pptxSuperficial & Deep Fascia of the NECK.pptx
Superficial & Deep Fascia of the NECK.pptx
Dr. Rabia Inam Gandapore
 
Maxilla, Mandible & Hyoid Bone & Clinical Correlations by Dr. RIG.pptx
Maxilla, Mandible & Hyoid Bone & Clinical Correlations by Dr. RIG.pptxMaxilla, Mandible & Hyoid Bone & Clinical Correlations by Dr. RIG.pptx
Maxilla, Mandible & Hyoid Bone & Clinical Correlations by Dr. RIG.pptx
Dr. Rabia Inam Gandapore
 
micro teaching on communication m.sc nursing.pdf
micro teaching on communication m.sc nursing.pdfmicro teaching on communication m.sc nursing.pdf
micro teaching on communication m.sc nursing.pdf
Anurag Sharma
 
ARTHROLOGY PPT NCISM SYLLABUS AYURVEDA STUDENTS
ARTHROLOGY PPT NCISM SYLLABUS AYURVEDA STUDENTSARTHROLOGY PPT NCISM SYLLABUS AYURVEDA STUDENTS
ARTHROLOGY PPT NCISM SYLLABUS AYURVEDA STUDENTS
Dr. Vinay Pareek
 
Physiology of Special Chemical Sensation of Taste
Physiology of Special Chemical Sensation of TastePhysiology of Special Chemical Sensation of Taste
Physiology of Special Chemical Sensation of Taste
MedicoseAcademics
 
Evaluation of antidepressant activity of clitoris ternatea in animals
Evaluation of antidepressant activity of clitoris ternatea in animalsEvaluation of antidepressant activity of clitoris ternatea in animals
Evaluation of antidepressant activity of clitoris ternatea in animals
Shweta
 
Lung Cancer: Artificial Intelligence, Synergetics, Complex System Analysis, S...
Lung Cancer: Artificial Intelligence, Synergetics, Complex System Analysis, S...Lung Cancer: Artificial Intelligence, Synergetics, Complex System Analysis, S...
Lung Cancer: Artificial Intelligence, Synergetics, Complex System Analysis, S...
Oleg Kshivets
 
POST OPERATIVE OLIGURIA and its management
POST OPERATIVE OLIGURIA and its managementPOST OPERATIVE OLIGURIA and its management
POST OPERATIVE OLIGURIA and its management
touseefaziz1
 
Tom Selleck Health: A Comprehensive Look at the Iconic Actor’s Wellness Journey
Tom Selleck Health: A Comprehensive Look at the Iconic Actor’s Wellness JourneyTom Selleck Health: A Comprehensive Look at the Iconic Actor’s Wellness Journey
Tom Selleck Health: A Comprehensive Look at the Iconic Actor’s Wellness Journey
greendigital
 
heat stroke and heat exhaustion in children
heat stroke and heat exhaustion in childrenheat stroke and heat exhaustion in children
heat stroke and heat exhaustion in children
SumeraAhmad5
 
HOT NEW PRODUCT! BIG SALES FAST SHIPPING NOW FROM CHINA!! EU KU DB BK substit...
HOT NEW PRODUCT! BIG SALES FAST SHIPPING NOW FROM CHINA!! EU KU DB BK substit...HOT NEW PRODUCT! BIG SALES FAST SHIPPING NOW FROM CHINA!! EU KU DB BK substit...
HOT NEW PRODUCT! BIG SALES FAST SHIPPING NOW FROM CHINA!! EU KU DB BK substit...
GL Anaacs
 
ARTIFICIAL INTELLIGENCE IN HEALTHCARE.pdf
ARTIFICIAL INTELLIGENCE IN  HEALTHCARE.pdfARTIFICIAL INTELLIGENCE IN  HEALTHCARE.pdf
ARTIFICIAL INTELLIGENCE IN HEALTHCARE.pdf
Anujkumaranit
 
Surat @ℂall @Girls ꧁❤8527049040❤꧂@ℂall @Girls Service Vip Top Model Safe
Surat @ℂall @Girls ꧁❤8527049040❤꧂@ℂall @Girls Service Vip Top Model SafeSurat @ℂall @Girls ꧁❤8527049040❤꧂@ℂall @Girls Service Vip Top Model Safe
Surat @ℂall @Girls ꧁❤8527049040❤꧂@ℂall @Girls Service Vip Top Model Safe
Savita Shen $i11
 

Recently uploaded (20)

Pulmonary Thromboembolism - etilogy, types, medical- Surgical and nursing man...
Pulmonary Thromboembolism - etilogy, types, medical- Surgical and nursing man...Pulmonary Thromboembolism - etilogy, types, medical- Surgical and nursing man...
Pulmonary Thromboembolism - etilogy, types, medical- Surgical and nursing man...
 
basicmodesofventilation2022-220313203758.pdf
basicmodesofventilation2022-220313203758.pdfbasicmodesofventilation2022-220313203758.pdf
basicmodesofventilation2022-220313203758.pdf
 
THOA 2.ppt Human Organ Transplantation Act
THOA 2.ppt Human Organ Transplantation ActTHOA 2.ppt Human Organ Transplantation Act
THOA 2.ppt Human Organ Transplantation Act
 
Antiulcer drugs Advance Pharmacology .pptx
Antiulcer drugs Advance Pharmacology .pptxAntiulcer drugs Advance Pharmacology .pptx
Antiulcer drugs Advance Pharmacology .pptx
 
Hemodialysis: Chapter 3, Dialysis Water Unit - Dr.Gawad
Hemodialysis: Chapter 3, Dialysis Water Unit - Dr.GawadHemodialysis: Chapter 3, Dialysis Water Unit - Dr.Gawad
Hemodialysis: Chapter 3, Dialysis Water Unit - Dr.Gawad
 
For Better Surat #ℂall #Girl Service ❤85270-49040❤ Surat #ℂall #Girls
For Better Surat #ℂall #Girl Service ❤85270-49040❤ Surat #ℂall #GirlsFor Better Surat #ℂall #Girl Service ❤85270-49040❤ Surat #ℂall #Girls
For Better Surat #ℂall #Girl Service ❤85270-49040❤ Surat #ℂall #Girls
 
Non-respiratory Functions of the Lungs.pdf
Non-respiratory Functions of the Lungs.pdfNon-respiratory Functions of the Lungs.pdf
Non-respiratory Functions of the Lungs.pdf
 
Superficial & Deep Fascia of the NECK.pptx
Superficial & Deep Fascia of the NECK.pptxSuperficial & Deep Fascia of the NECK.pptx
Superficial & Deep Fascia of the NECK.pptx
 
Maxilla, Mandible & Hyoid Bone & Clinical Correlations by Dr. RIG.pptx
Maxilla, Mandible & Hyoid Bone & Clinical Correlations by Dr. RIG.pptxMaxilla, Mandible & Hyoid Bone & Clinical Correlations by Dr. RIG.pptx
Maxilla, Mandible & Hyoid Bone & Clinical Correlations by Dr. RIG.pptx
 
micro teaching on communication m.sc nursing.pdf
micro teaching on communication m.sc nursing.pdfmicro teaching on communication m.sc nursing.pdf
micro teaching on communication m.sc nursing.pdf
 
ARTHROLOGY PPT NCISM SYLLABUS AYURVEDA STUDENTS
ARTHROLOGY PPT NCISM SYLLABUS AYURVEDA STUDENTSARTHROLOGY PPT NCISM SYLLABUS AYURVEDA STUDENTS
ARTHROLOGY PPT NCISM SYLLABUS AYURVEDA STUDENTS
 
Physiology of Special Chemical Sensation of Taste
Physiology of Special Chemical Sensation of TastePhysiology of Special Chemical Sensation of Taste
Physiology of Special Chemical Sensation of Taste
 
Evaluation of antidepressant activity of clitoris ternatea in animals
Evaluation of antidepressant activity of clitoris ternatea in animalsEvaluation of antidepressant activity of clitoris ternatea in animals
Evaluation of antidepressant activity of clitoris ternatea in animals
 
Lung Cancer: Artificial Intelligence, Synergetics, Complex System Analysis, S...
Lung Cancer: Artificial Intelligence, Synergetics, Complex System Analysis, S...Lung Cancer: Artificial Intelligence, Synergetics, Complex System Analysis, S...
Lung Cancer: Artificial Intelligence, Synergetics, Complex System Analysis, S...
 
POST OPERATIVE OLIGURIA and its management
POST OPERATIVE OLIGURIA and its managementPOST OPERATIVE OLIGURIA and its management
POST OPERATIVE OLIGURIA and its management
 
Tom Selleck Health: A Comprehensive Look at the Iconic Actor’s Wellness Journey
Tom Selleck Health: A Comprehensive Look at the Iconic Actor’s Wellness JourneyTom Selleck Health: A Comprehensive Look at the Iconic Actor’s Wellness Journey
Tom Selleck Health: A Comprehensive Look at the Iconic Actor’s Wellness Journey
 
heat stroke and heat exhaustion in children
heat stroke and heat exhaustion in childrenheat stroke and heat exhaustion in children
heat stroke and heat exhaustion in children
 
HOT NEW PRODUCT! BIG SALES FAST SHIPPING NOW FROM CHINA!! EU KU DB BK substit...
HOT NEW PRODUCT! BIG SALES FAST SHIPPING NOW FROM CHINA!! EU KU DB BK substit...HOT NEW PRODUCT! BIG SALES FAST SHIPPING NOW FROM CHINA!! EU KU DB BK substit...
HOT NEW PRODUCT! BIG SALES FAST SHIPPING NOW FROM CHINA!! EU KU DB BK substit...
 
ARTIFICIAL INTELLIGENCE IN HEALTHCARE.pdf
ARTIFICIAL INTELLIGENCE IN  HEALTHCARE.pdfARTIFICIAL INTELLIGENCE IN  HEALTHCARE.pdf
ARTIFICIAL INTELLIGENCE IN HEALTHCARE.pdf
 
Surat @ℂall @Girls ꧁❤8527049040❤꧂@ℂall @Girls Service Vip Top Model Safe
Surat @ℂall @Girls ꧁❤8527049040❤꧂@ℂall @Girls Service Vip Top Model SafeSurat @ℂall @Girls ꧁❤8527049040❤꧂@ℂall @Girls Service Vip Top Model Safe
Surat @ℂall @Girls ꧁❤8527049040❤꧂@ℂall @Girls Service Vip Top Model Safe
 

Population and Development

  • 1. Objectives: •Identify the main differences between MEDC’s and LEDC’s using population data and population pyramids.
  • 2. Characteristic Definition Birth Rate (BR) Death Rate (DR) Natural Increase Stage in DTM (Demographic Transition Model) Population Structure Line graphs showing relationship between birth and death rate through time. Live births per 1000 people per year Make up of a population by age and sex, shown by population pyramids Population growth when BR is higher than DR. Replaced by natural decrease when BR is lower Deaths per 1000 people per year
  • 3. Characteristic Definition MEDC’s Birth Rate (BR) Live births per 1000 people per year Death Rate (DR) Deaths per 1000 people per year Natural Increase Population growth when BR is higher than DR. Replaced by natural decrease when BR is lower Stage in DTM (Demographic Transition Model) Line graphs showing relationship between birth and death rate through time. Population Structure Make up of a population by age and sex, shown by population pyramids Low % under age 15 (below 25%) Low or non- existent; can be a minus value 4 or 5 (Stage 5 when DR is higher than BR) Low (typical value 8-15) Low average (9- 10)
  • 4. Characteristic Definition MEDC’s LEDC’s Birth Rate (BR) Live births per 1000 people per year Low (typical values 8-15) Death Rate (DR) Deaths per 1000 people per year Low (average 9-10) Natural Increase Population growth when BR is higher than DR. Replaced by natural decrease when BR is lower Low or non- existent; can be a minus value Stage in DTM (Demographic Transition Model) Line graphs showing relationship between birth and death rate through time. 4 or 5 (Stage 5 when DR is higher than BR) Population Structure Make up of a population by age and sex, shown by population pyramids Low % under age 15 (below 25%) 2 or 3 (Stage 2 when Natural Increase is large High (typical values 20- 55) High % under age 15 (30- 55%) Low (average 9-10) High
  • 5. Characteristic Definition MEDC’s LEDC’s Birth Rate (BR) Live births per 1000 people per year Low (typical values 8-15) High (typical values Death Rate (DR) Deaths per 1000 people per year Low (average 9-10) Low (average 9-10) Natural Increase Population growth when BR is higher than DR. Replaced by natural decrease when BR is lower Low or non- existent; can be a minus value High Stage in DTM (Demographic Transition Model) Line graphs showing relationship between birth and death rate through time. 4 or 5 (Stage 5 when DR is higher than BR) 2 or 3 (Stage 2 when Natural Increase is large) Population Structure Make up of a population by age and sex, shown by population pyramids Low % under age 15 (below 25%) High % under age 15 (30 – 50%)
  • 6. Describe the differences and similarities between MEDC’s and LEDC’s from the table of information you have produced.
  • 7.
  • 8. Tasks Use the population pyramids of Germany and Pakistan to answer the following questions. 1. How many people are there aged under 15 in (i) Gemany (ii) Pakistan 2. How many people are there aged over 64 in (i) Germany (ii) Pakistan 3. How many people are there of working age (20-60) in (i) Germany (ii) Pakistan
  • 9.
  • 10. As identified previously, MEDc’s and LEDC’s often have dramatically different birth rates, but why is this? Children can be seen as an economic cost that reduces the amount of money left for purchasing consumer goods and services. Women are more career orientated. They now work for longer and start families later in life. Children seen as an economic asset. They can provide an income for families. Lack of money to be spent on family planning and education about family planning
  • 11. A fall in a country’s birth rate usually accompanies an increase in national and personal wealth. The national government has more funds to promote birth control campaigns and to set up family-planning clinics. With greater wealth, attitudes to children change, as identified previously in the differences between MEDC’s and LEDC’s. Lowering the birth rate allows movement to stage 3 of the DTM. If this continues then transition to stage 4 will occur. This is where most European countries are at.
  • 12. Birth Rate per 1000 GDP per capita (US$) UK 9 24000 Canada 9 23000 Australia 12 19000 Saudi Arabia 34 8500 Russia 8 4500 China 14 1000 Brazil 19 2500 Peru 23 2000 Algeria 24 1500 Bangladesh 30 700 Mali 49 200 Niger 55 100 Plot the information from the table onto a scatter graph. X axis = birth rate Y axis = GDP per capita
  • 13. Answer the following questions 1. What type of correlation is displayed on your graph? 2. Describe the results produced on the graph? 3. There are 3 anomalies on the graph. Can you identify them? 4. Explain why these anomalies exist.