Age-sex pyramids provide insights into population dynamics, including birth rates, death rates, and life expectancy. Examples from Switzerland, India, and Uganda illustrate differing population structures, with Switzerland showing low birth and high life expectancy, while India and Uganda exhibit high birth rates and varying life expectancies. The document emphasizes the use of these pyramids for predicting future demographic changes.
Interpreting Age-Sex (Population)
Pyramids
Age- sex pyramids can tell us about
how a population changes over time.
They can also tell us about the birth
rate, death rate and life expectancy of
a country.
They can help us predict population
change.
4.
Basic Interpretation ofan Age-Sex
Pyramid
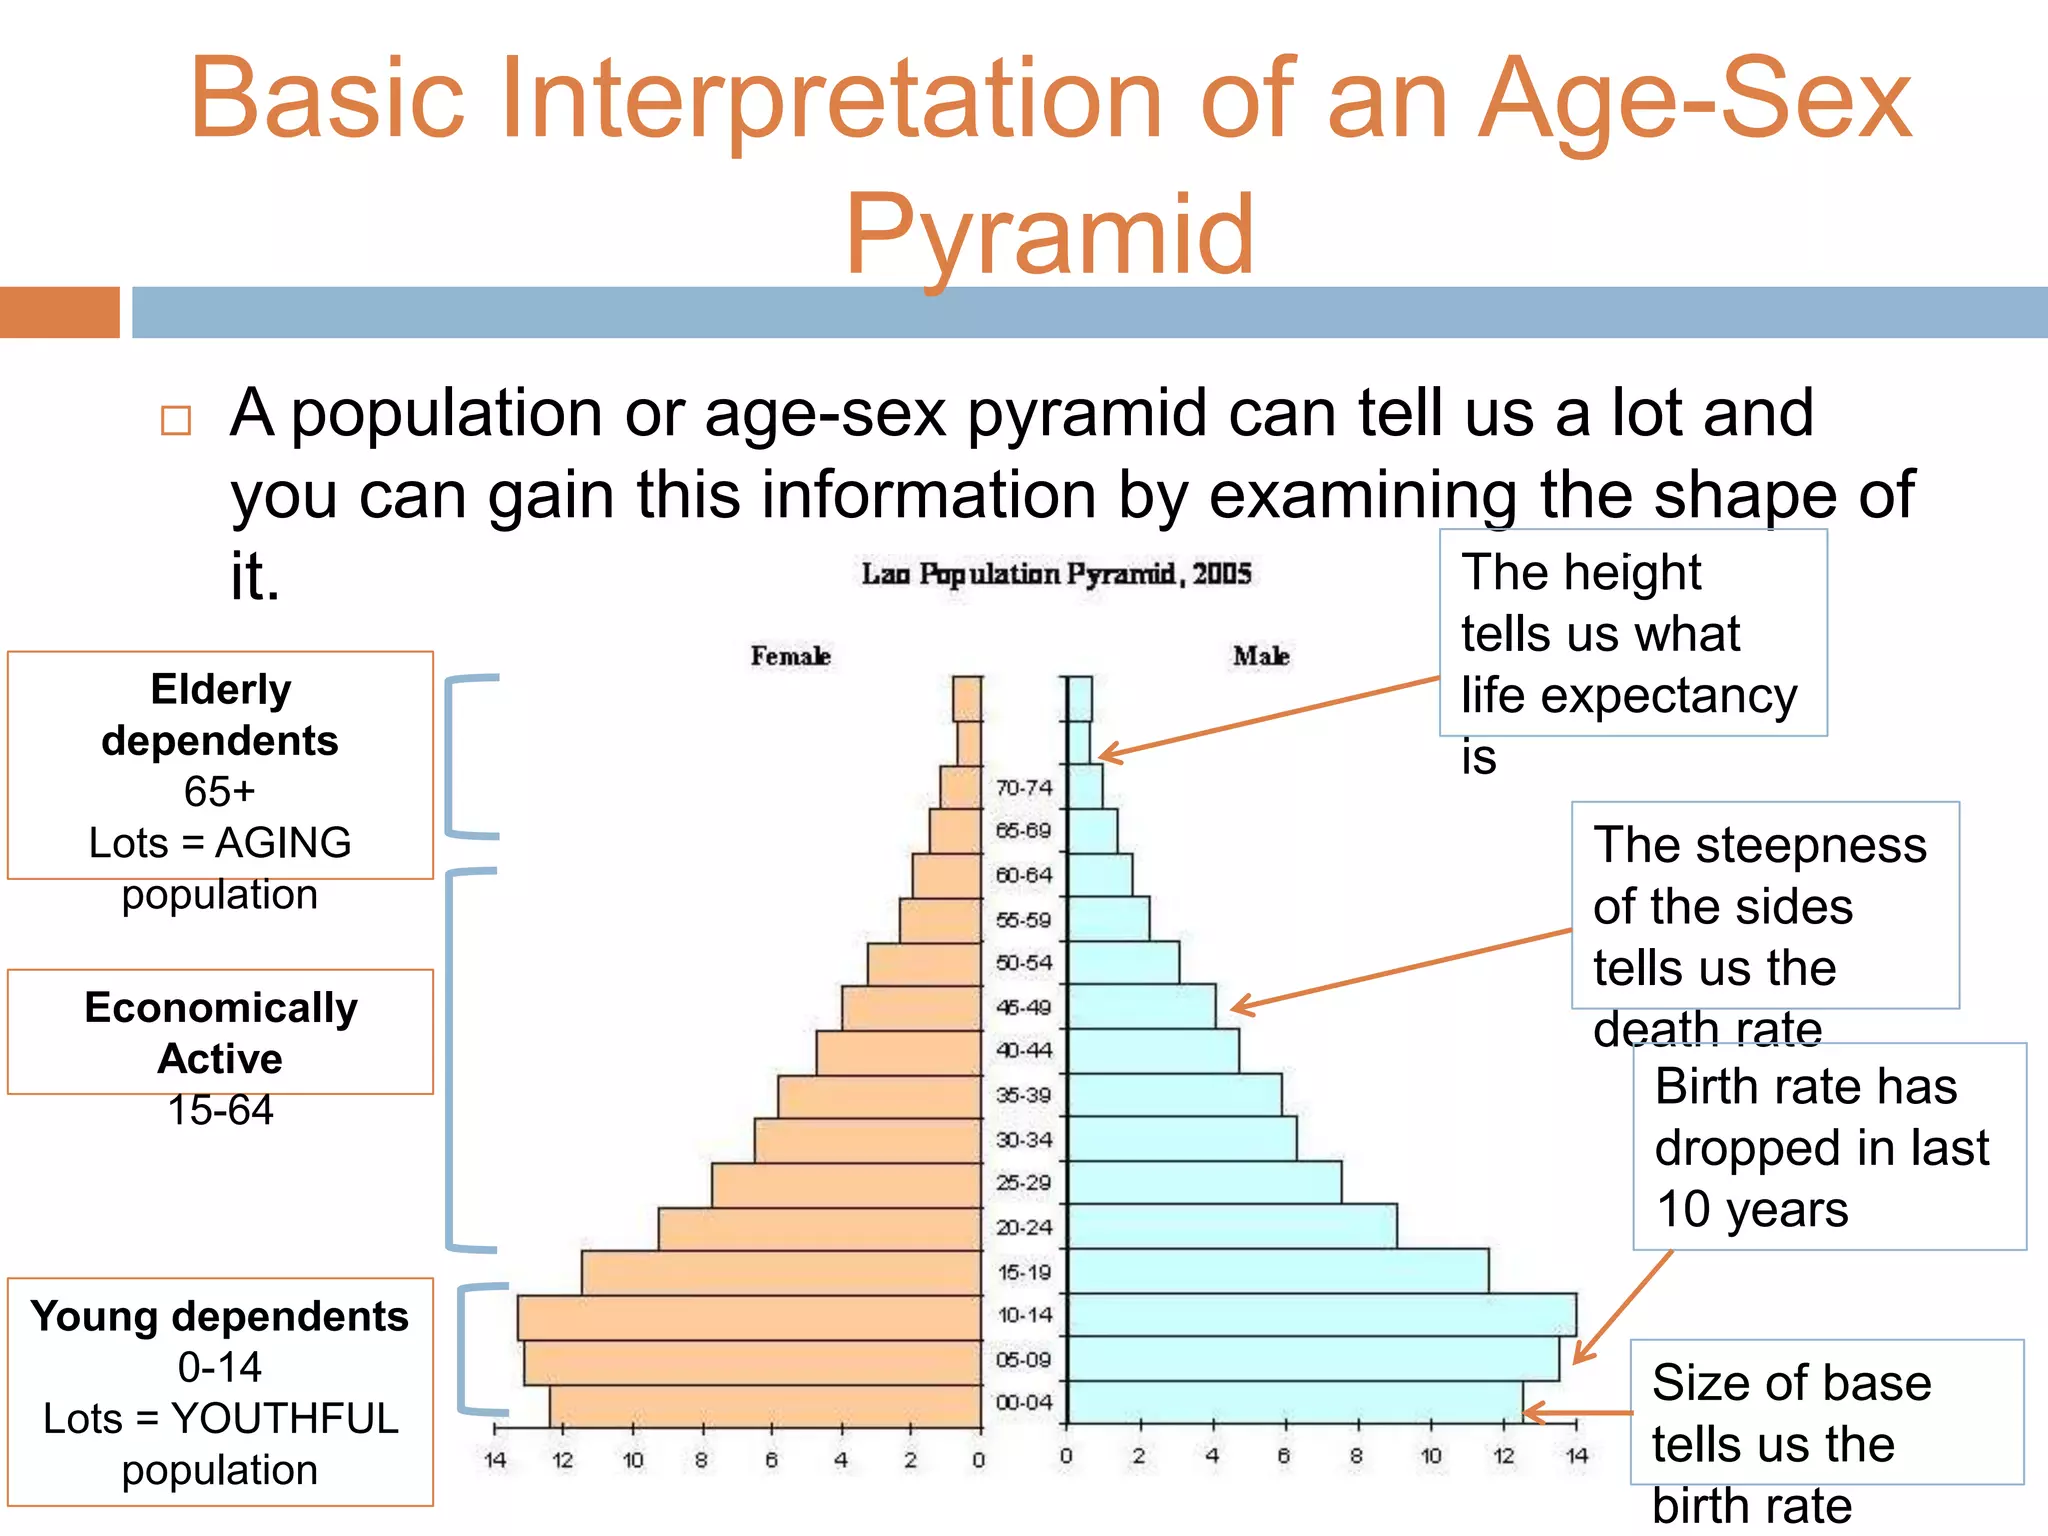
A population or age-sex pyramid can tell us a lot and
you can gain this information by examining the shape of
it. The height
tells us what
life expectancy
is
The steepness
of the sides
tells us the
death rate
Birth rate has
dropped in last
10 years
Size of base
tells us the
birth rate
Young dependents
0-14
Lots = YOUTHFUL
population
Economically
Active
15-64
Elderly
dependents
65+
Lots = AGING
population
5.
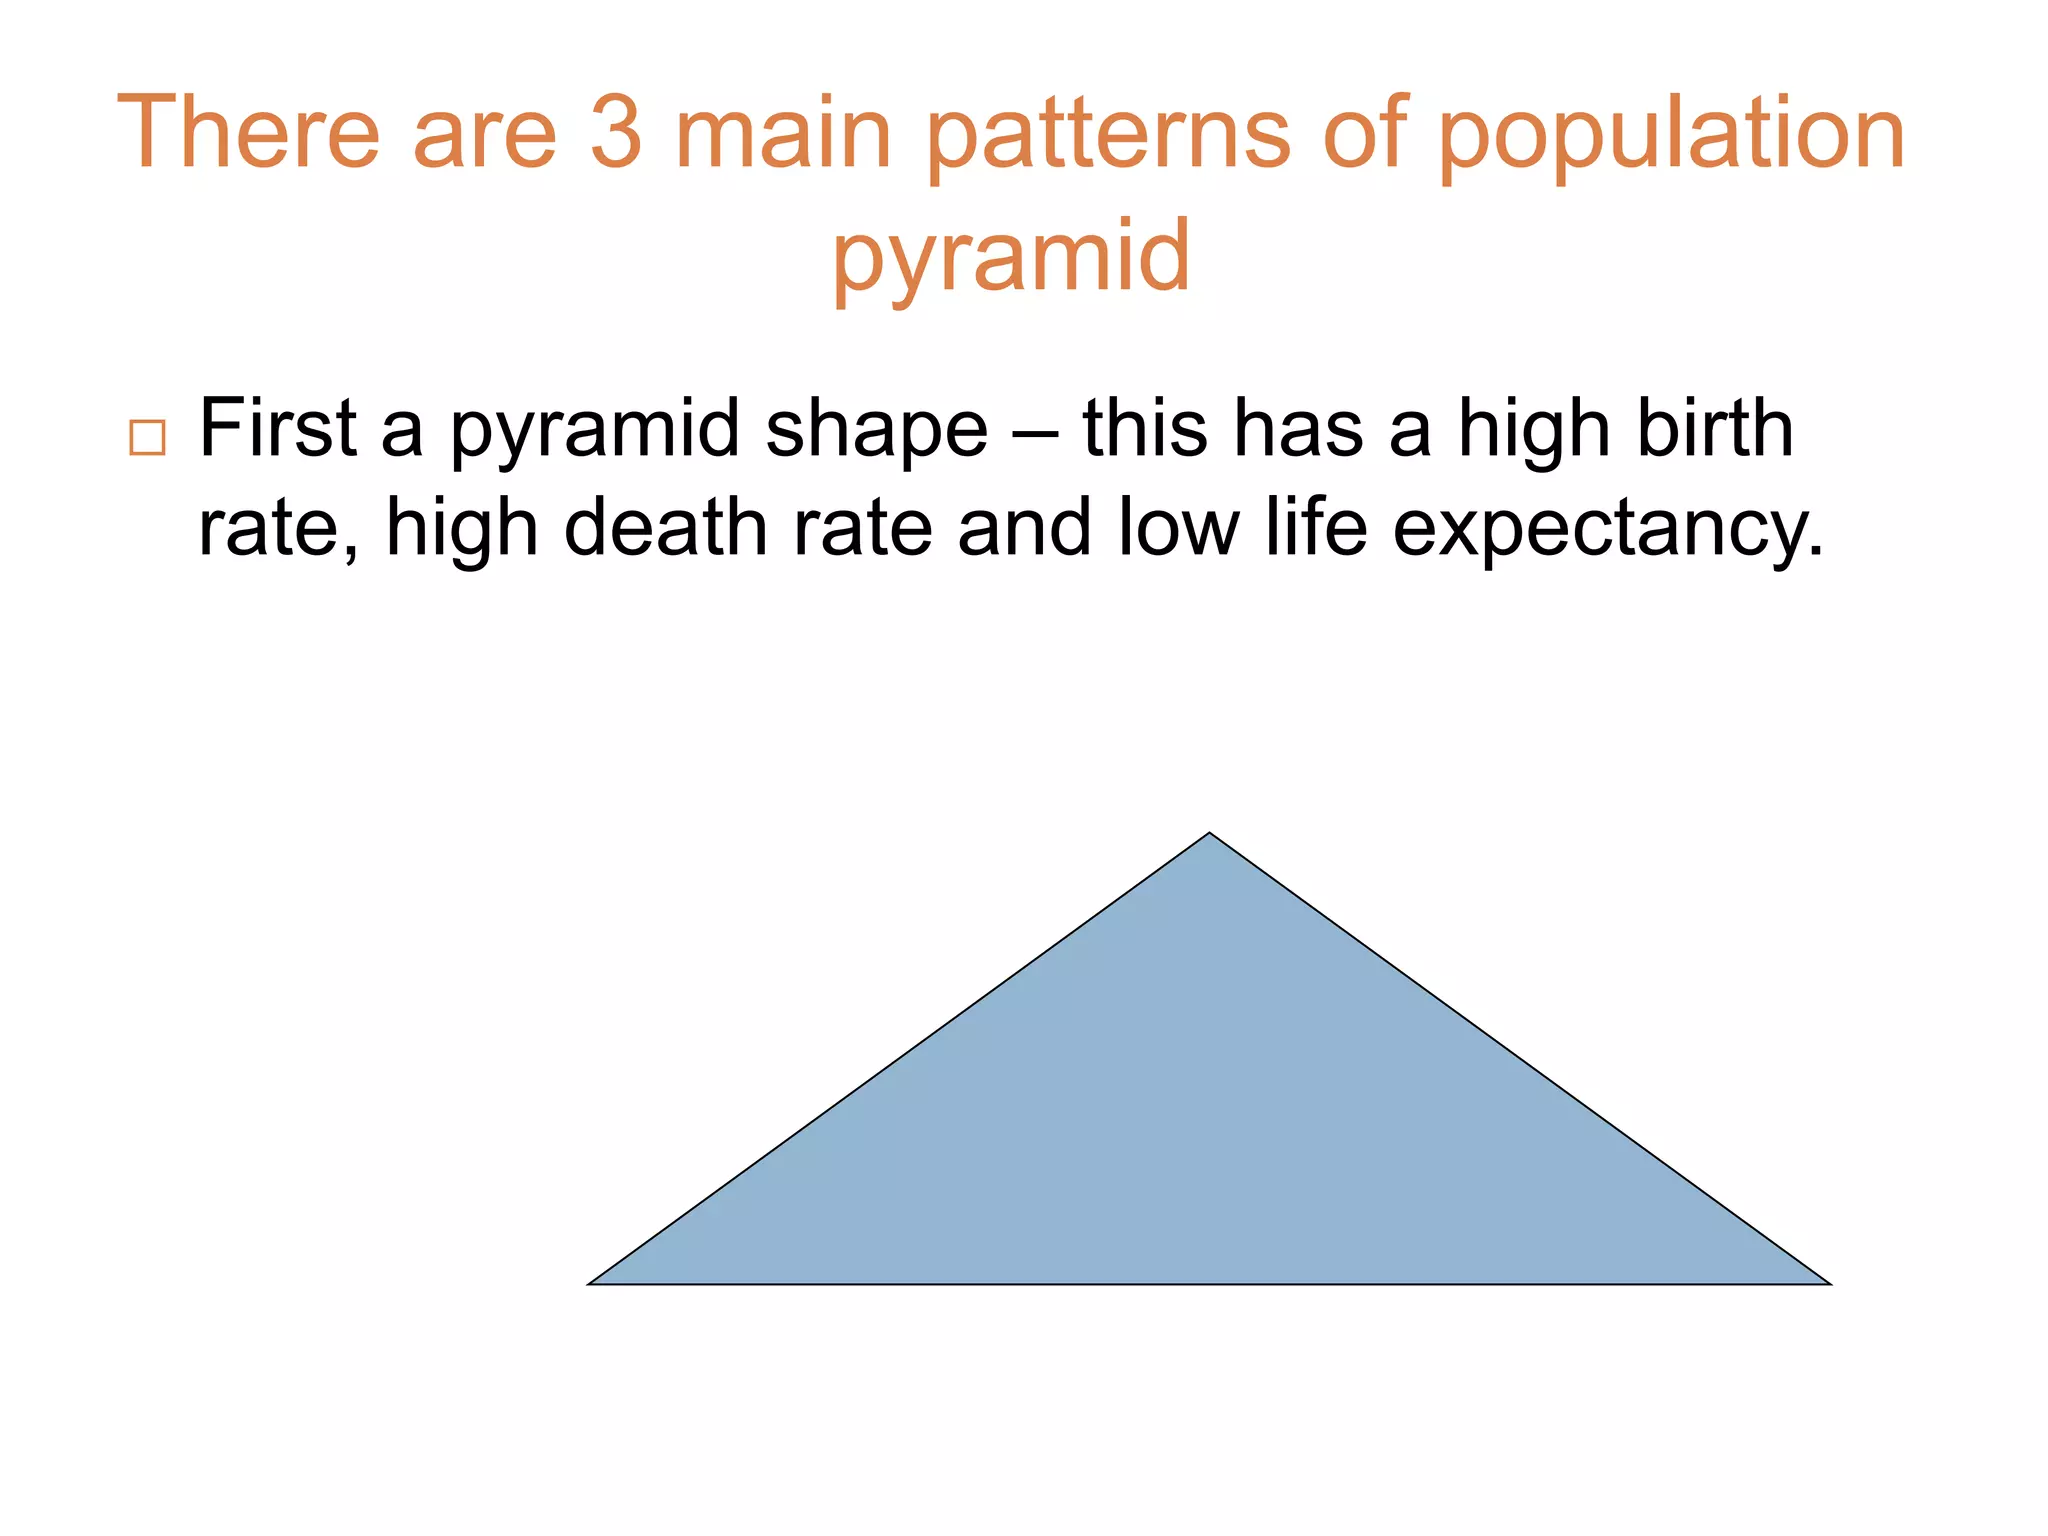
There are 3main patterns of population
pyramid
First a pyramid shape – this has a high birth
rate, high death rate and low life expectancy.
6.
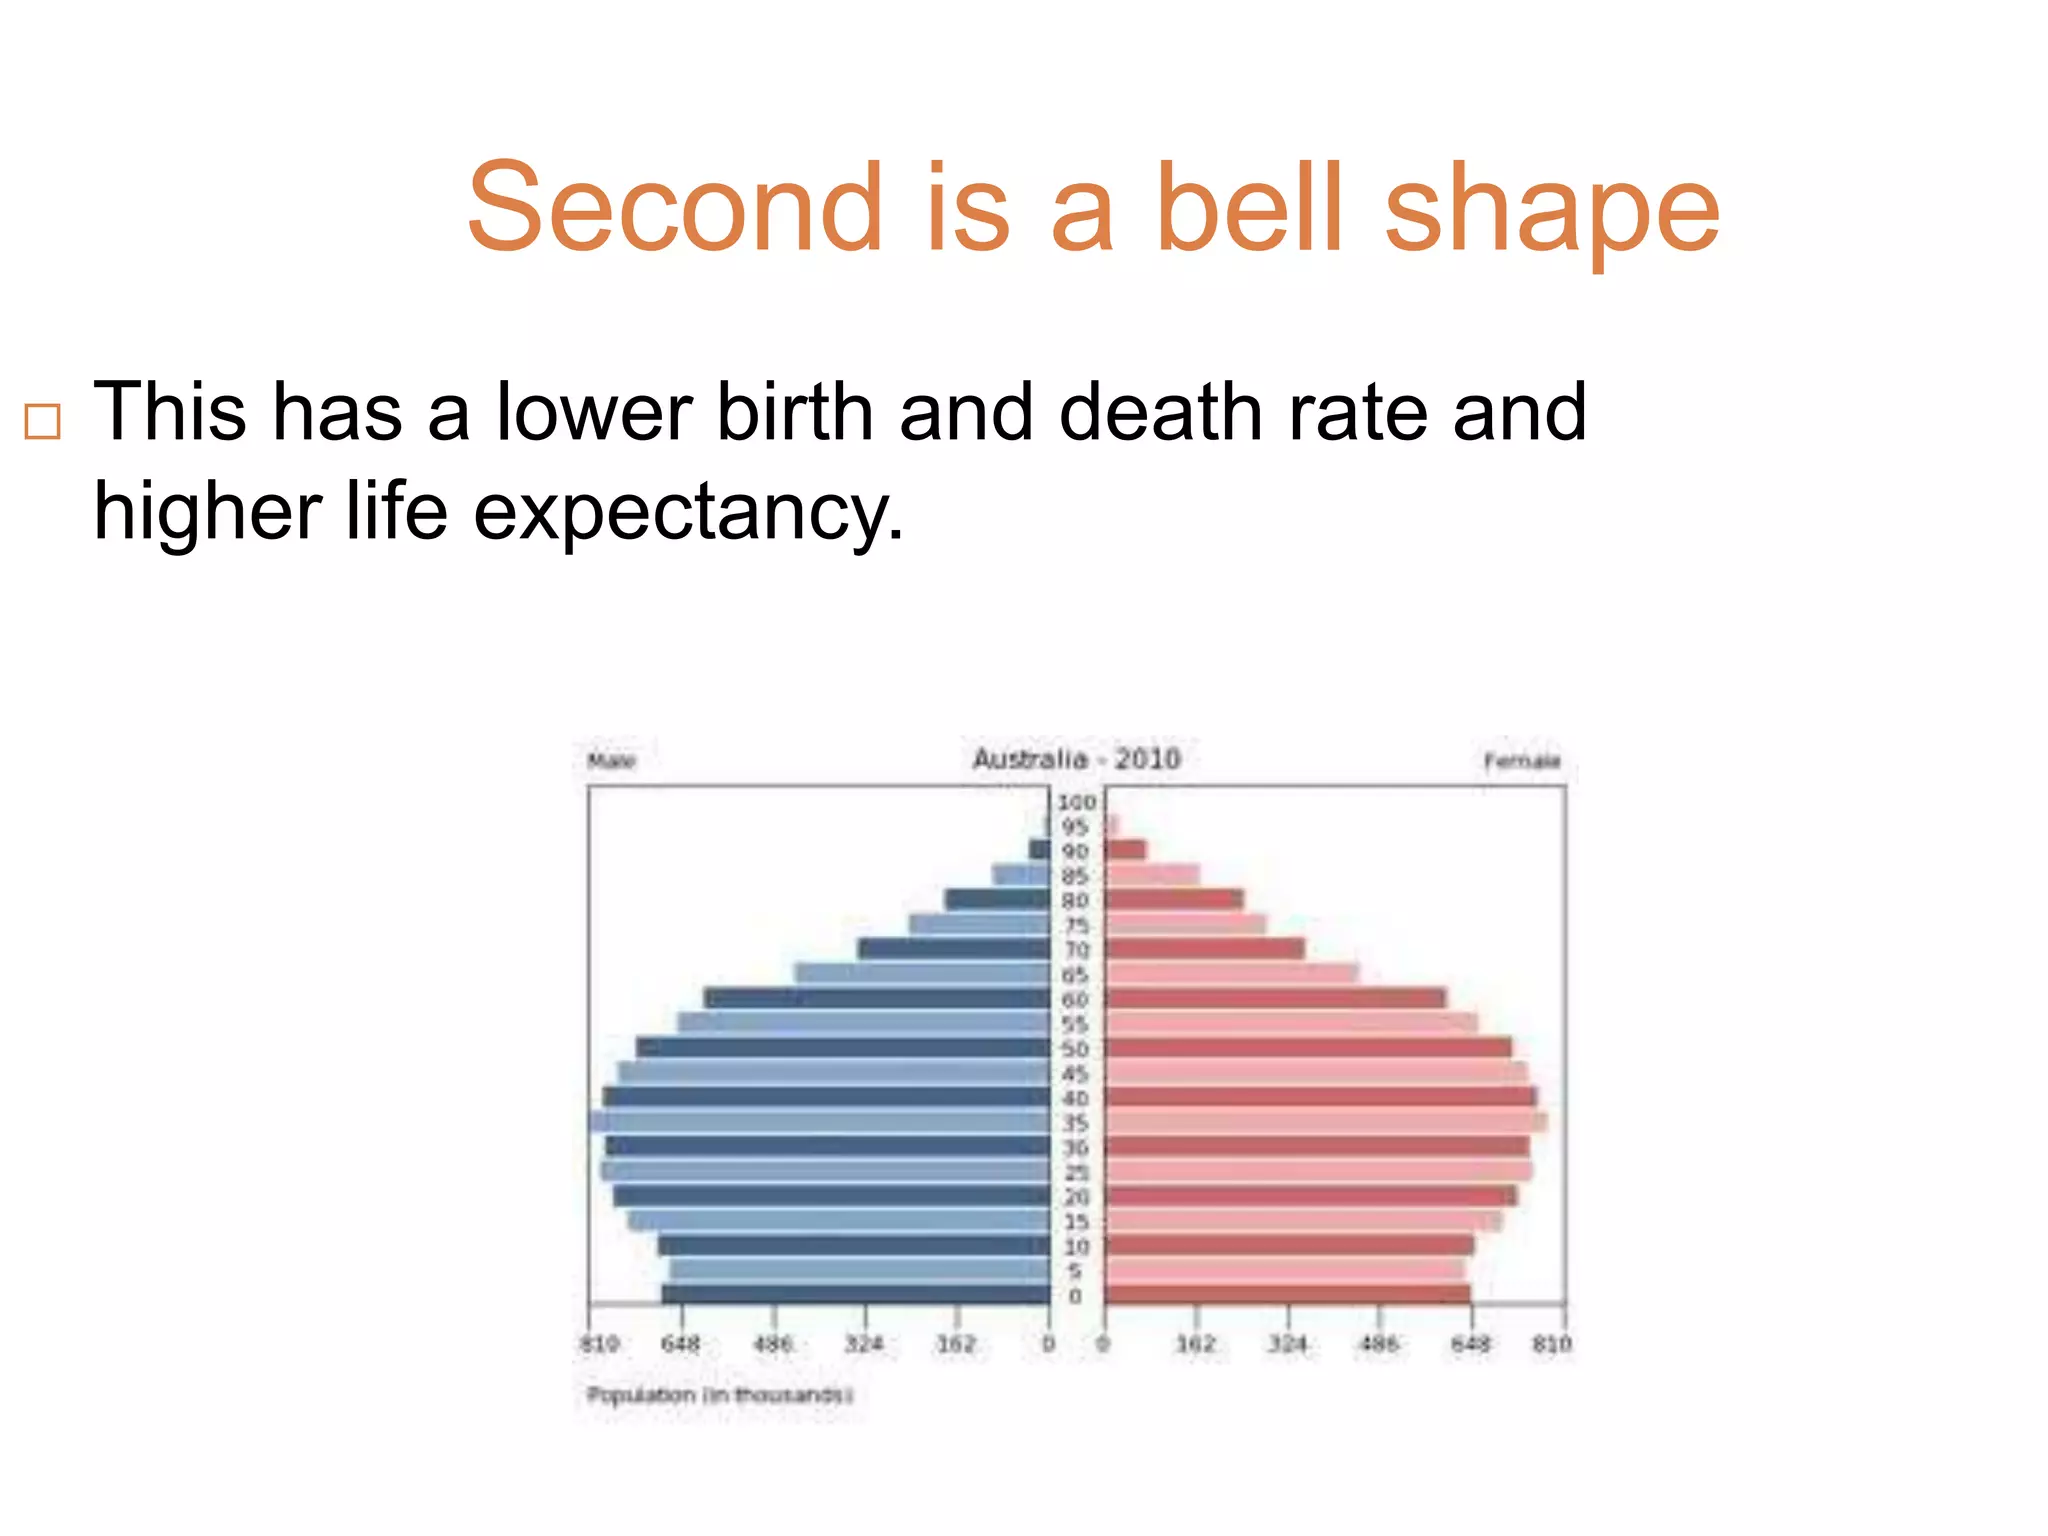
Second is abell shape
This has a lower birth and death rate and
higher life expectancy.
7.
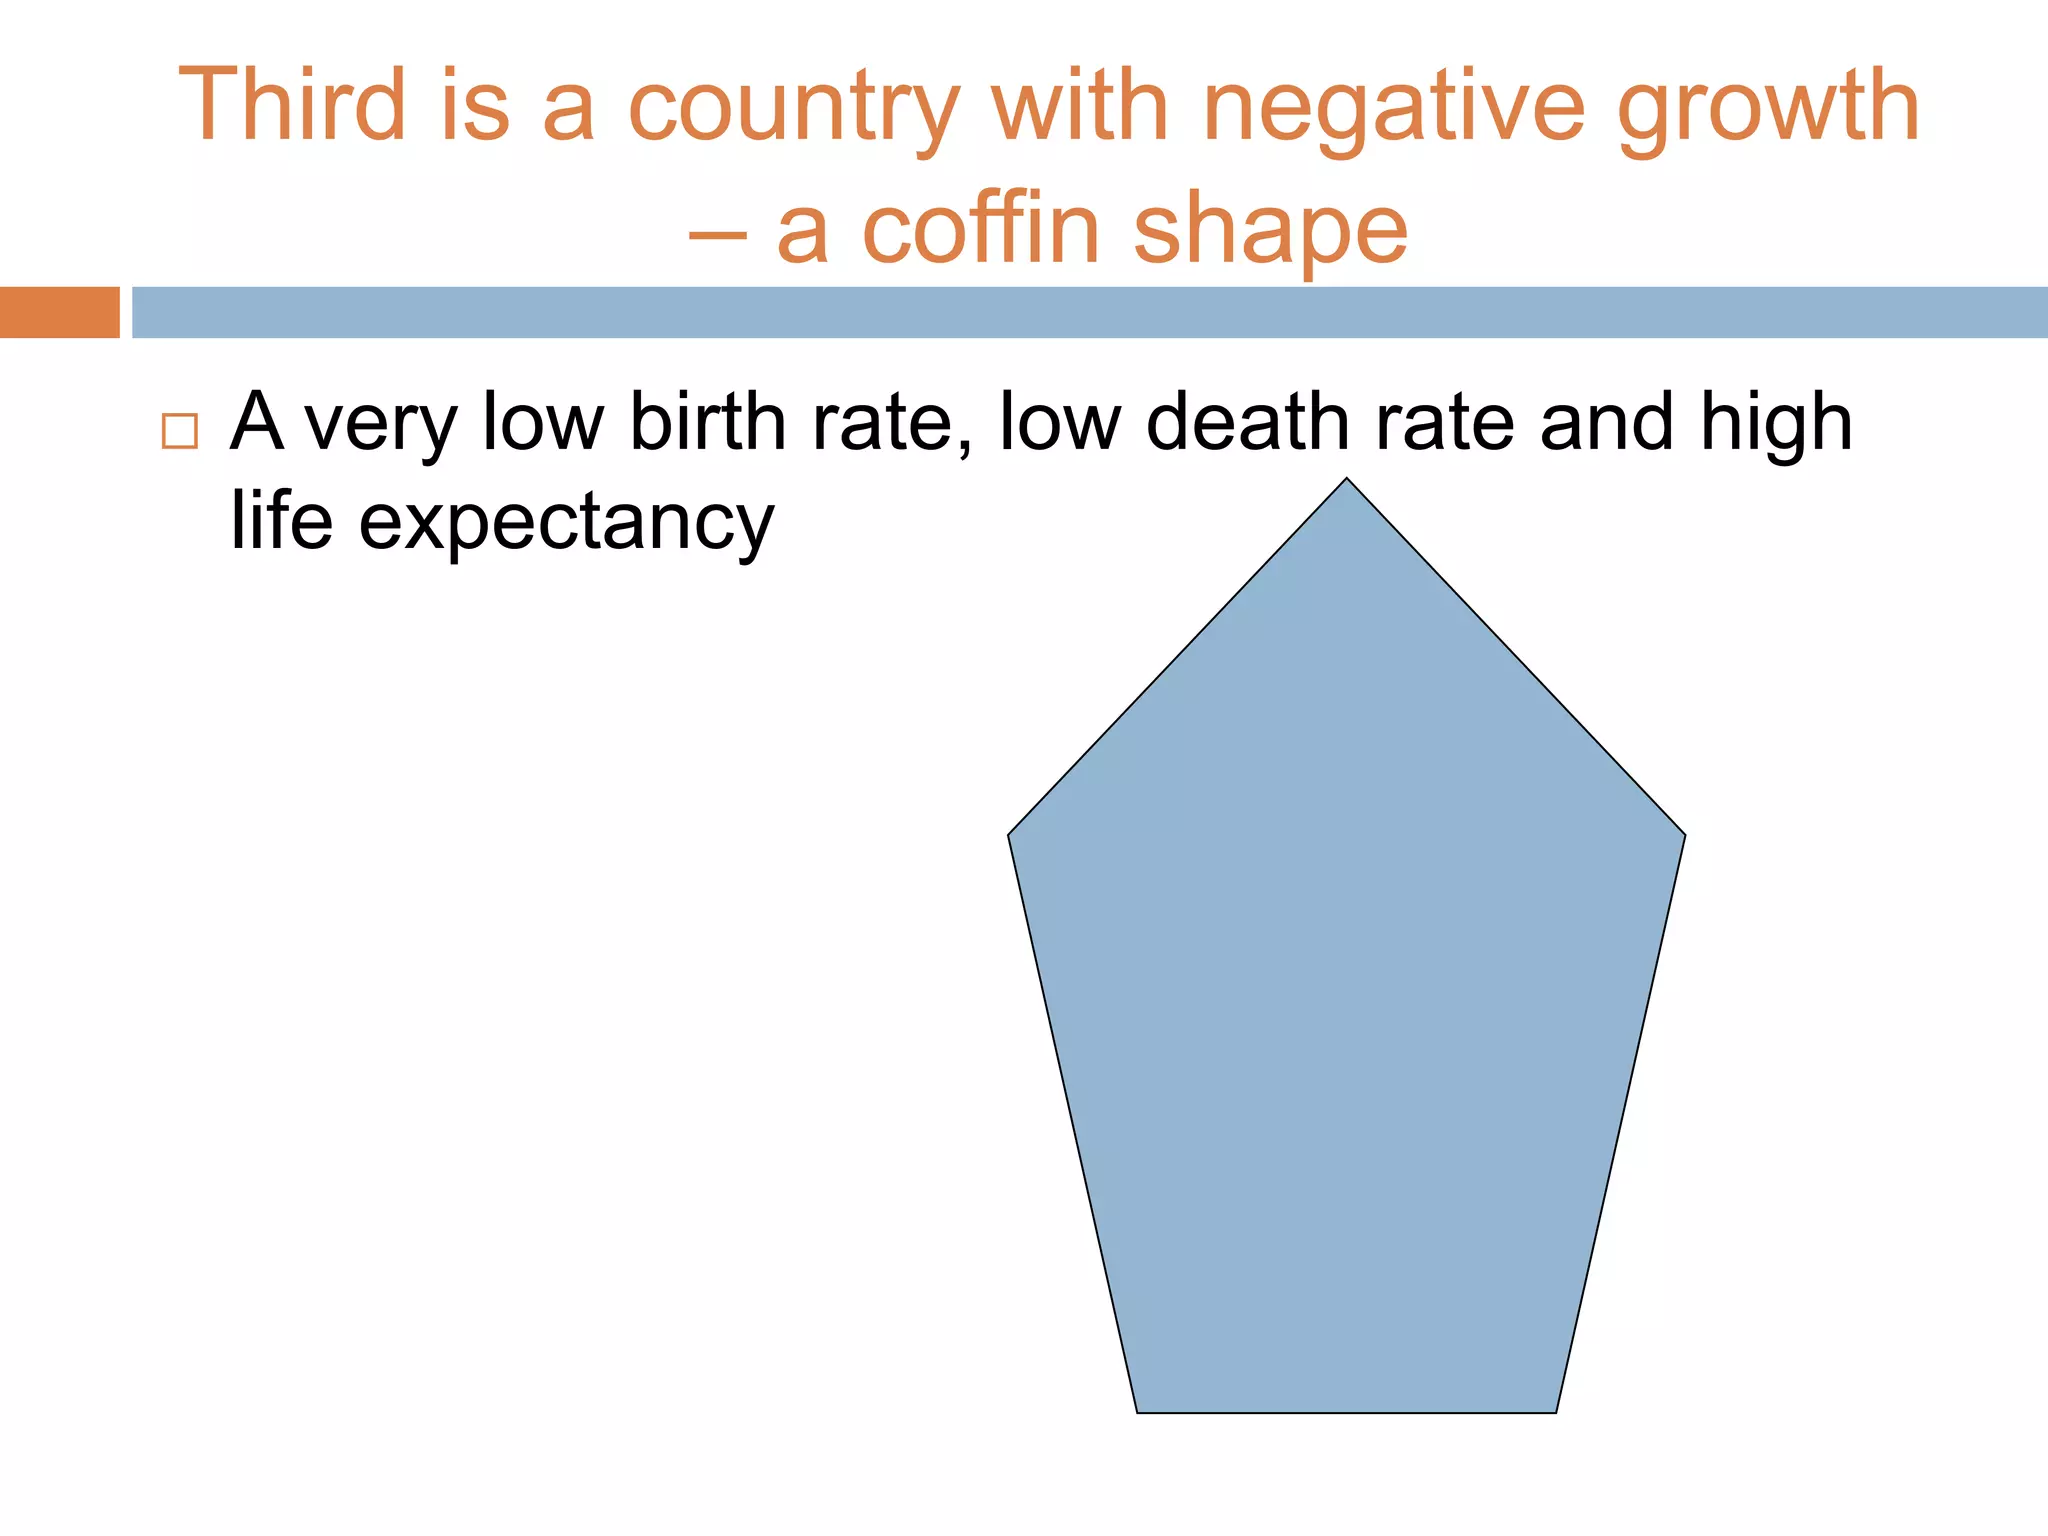
Third is acountry with negative growth
– a coffin shape
A very low birth rate, low death rate and high
life expectancy
Task
In anexam you could be asked to describe the
age-sex characteristics of your selected
country (Switzerland)
You are going to write a paragraph that FULLY
DESCRIBES (says what NOT why) the age-
sex pyramid for Switzerland in 2015
Write another paragraph describing
Switzerland’s predicted population pyramid in
2050
10.
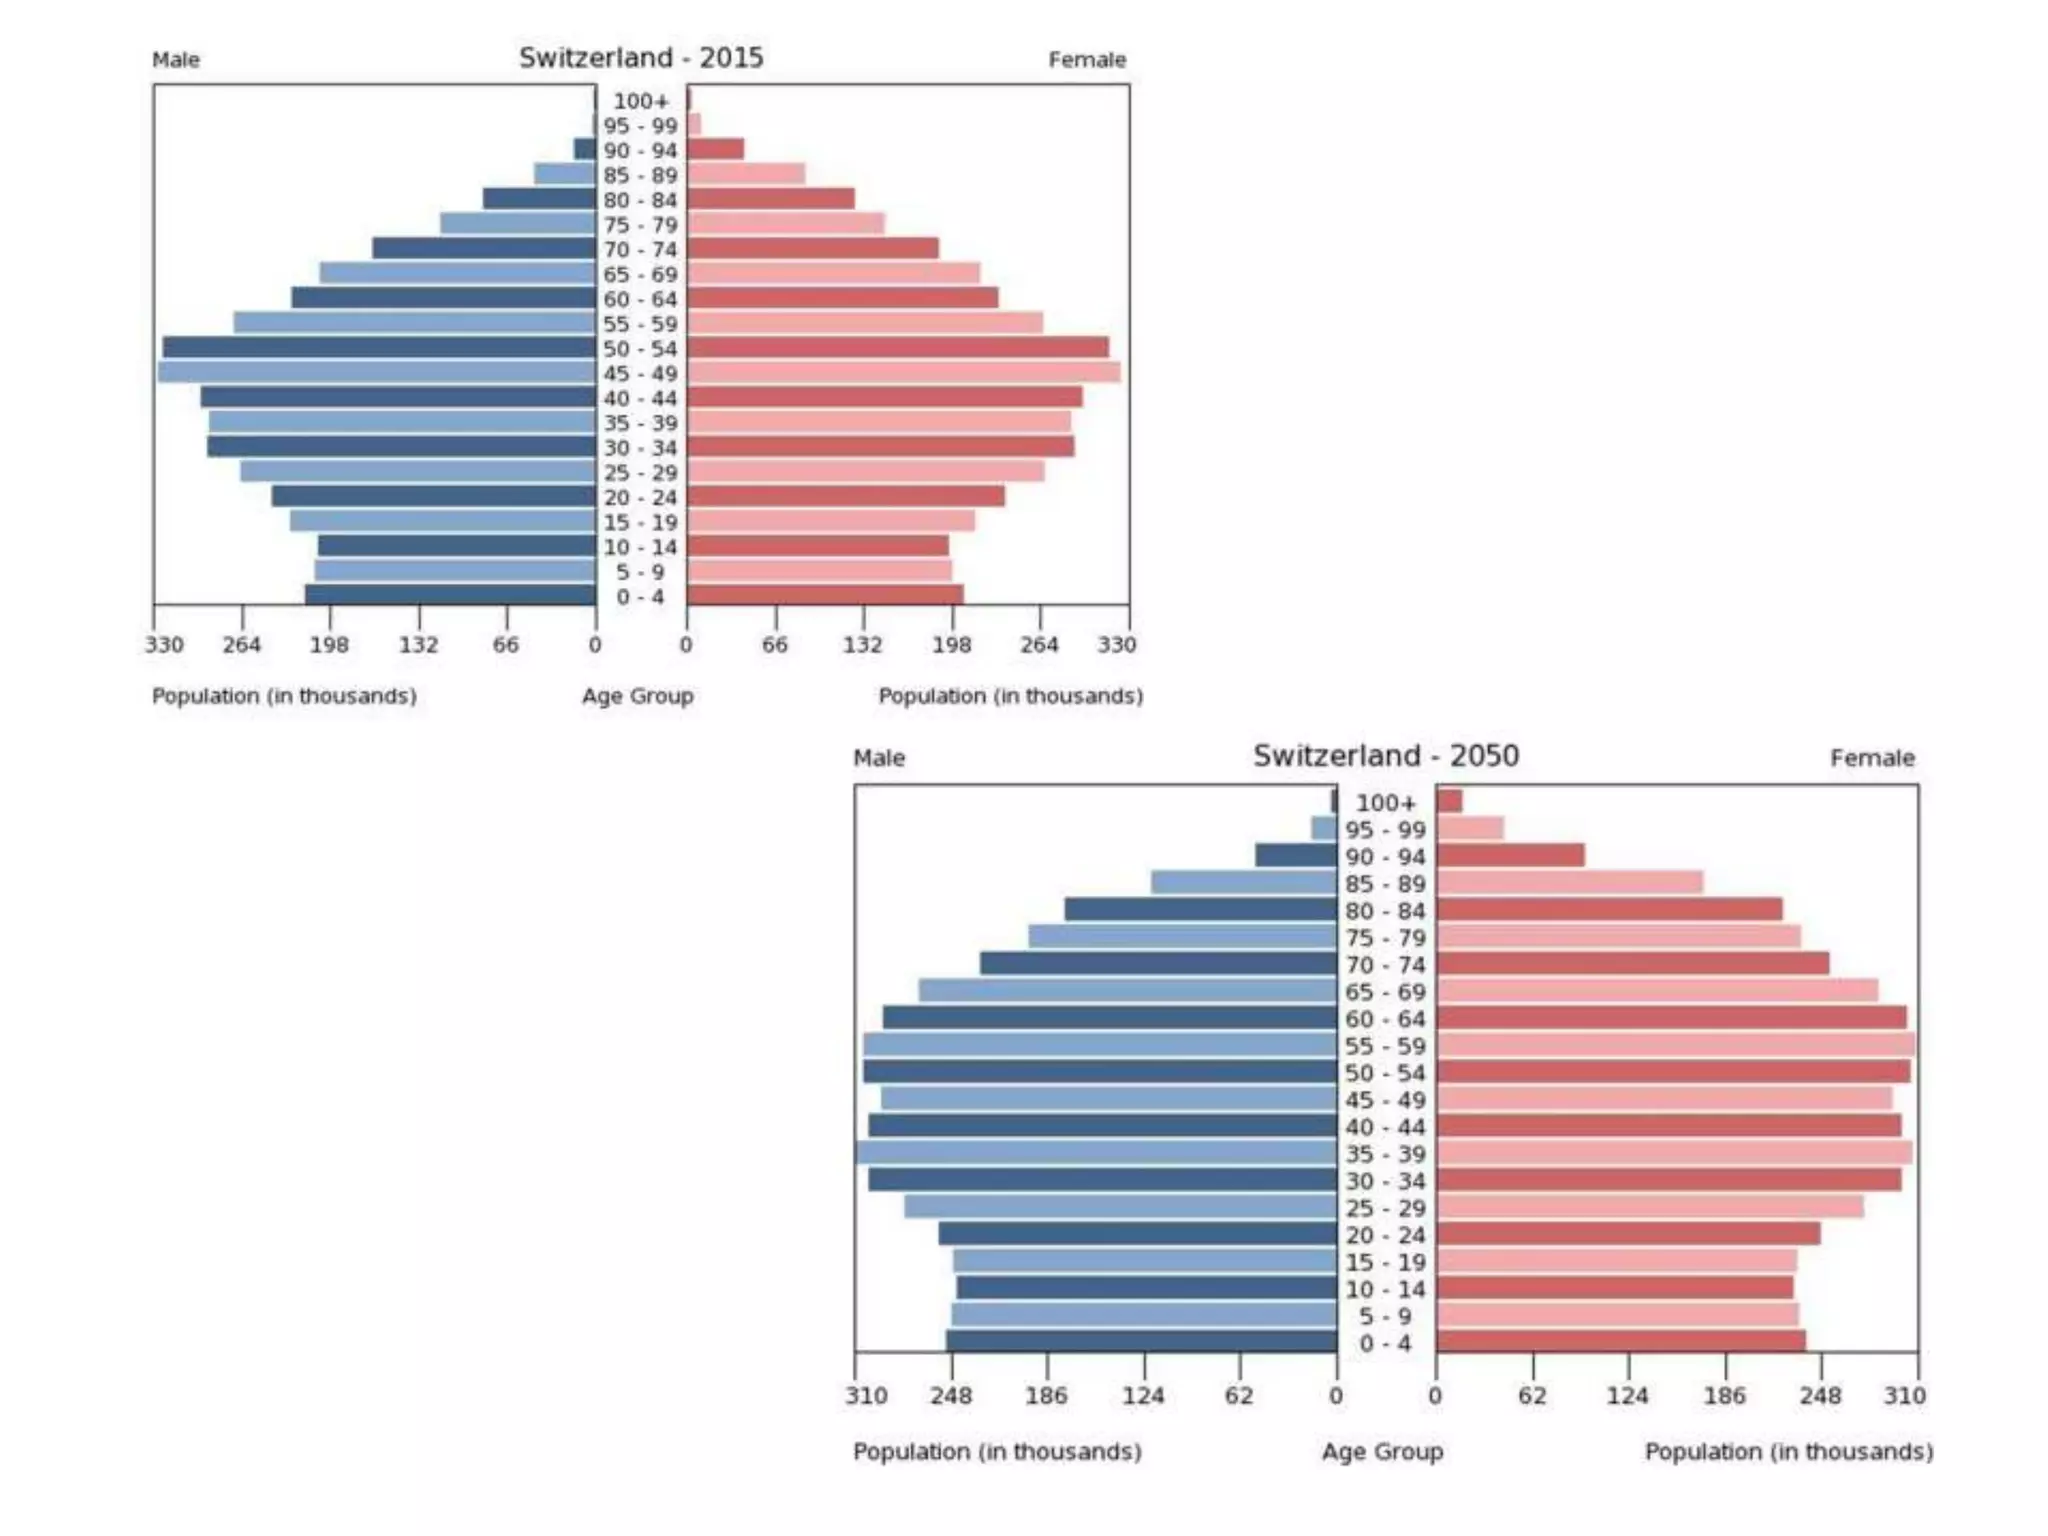
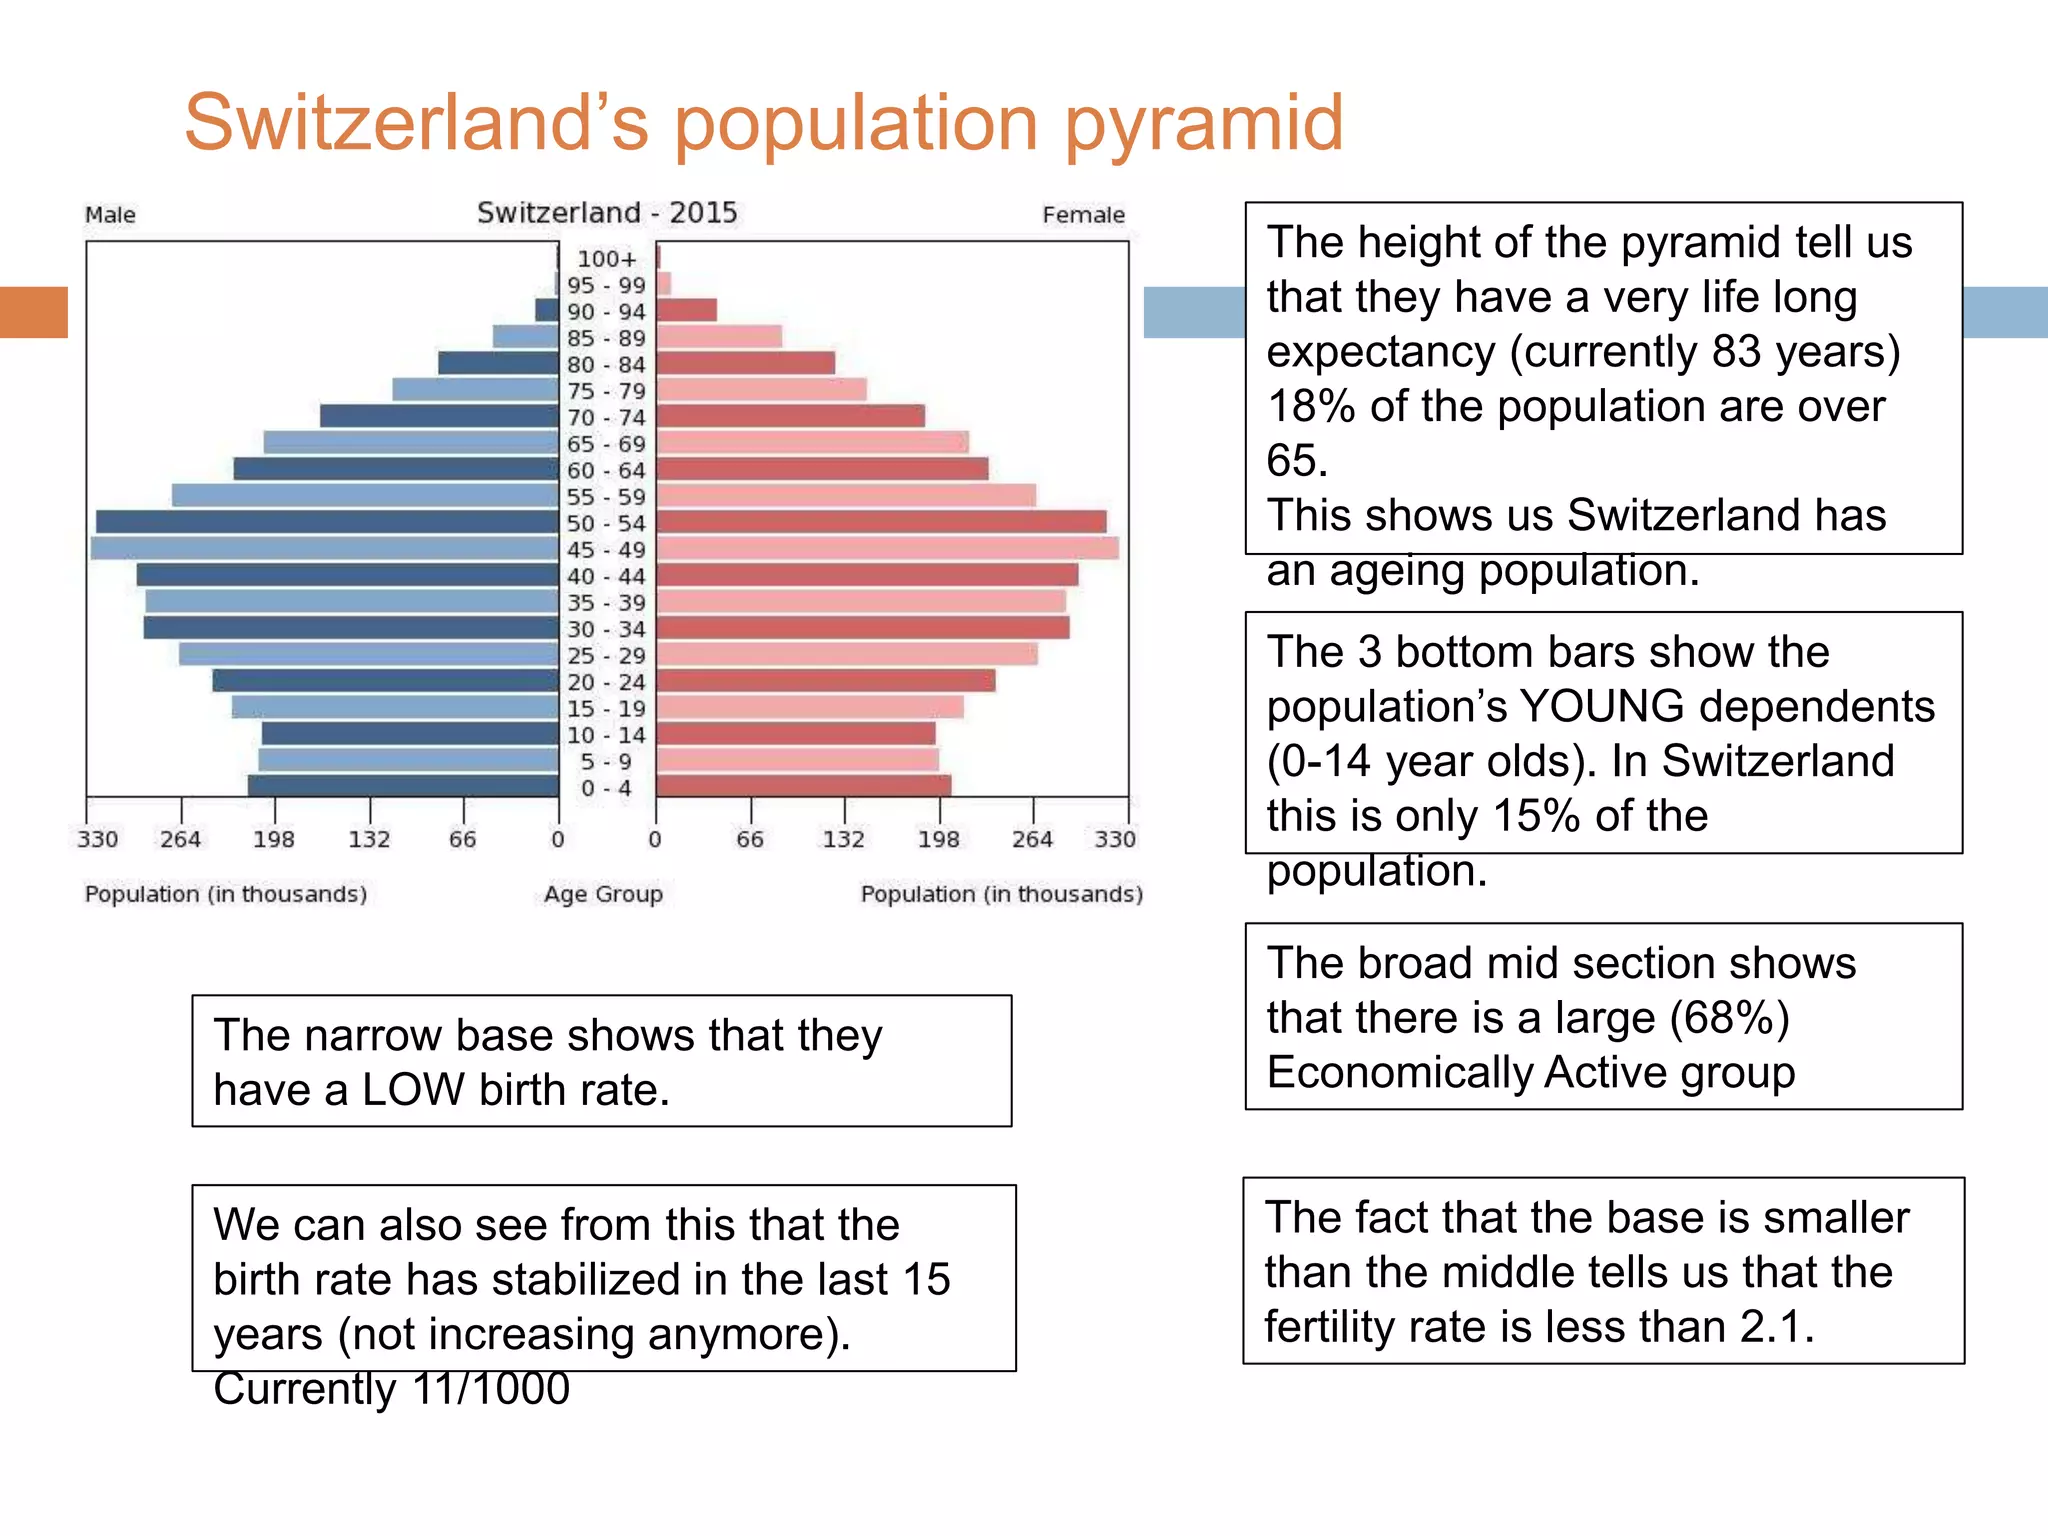
Switzerland’s population pyramid
Thenarrow base shows that they
have a LOW birth rate.
The 3 bottom bars show the
population’s YOUNG dependents
(0-14 year olds). In Switzerland
this is only 15% of the
population.
We can also see from this that the
birth rate has stabilized in the last 15
years (not increasing anymore).
Currently 11/1000
The broad mid section shows
that there is a large (68%)
Economically Active group
The fact that the base is smaller
than the middle tells us that the
fertility rate is less than 2.1.
The height of the pyramid tell us
that they have a very life long
expectancy (currently 83 years)
18% of the population are over
65.
This shows us Switzerland has
an ageing population.
11.
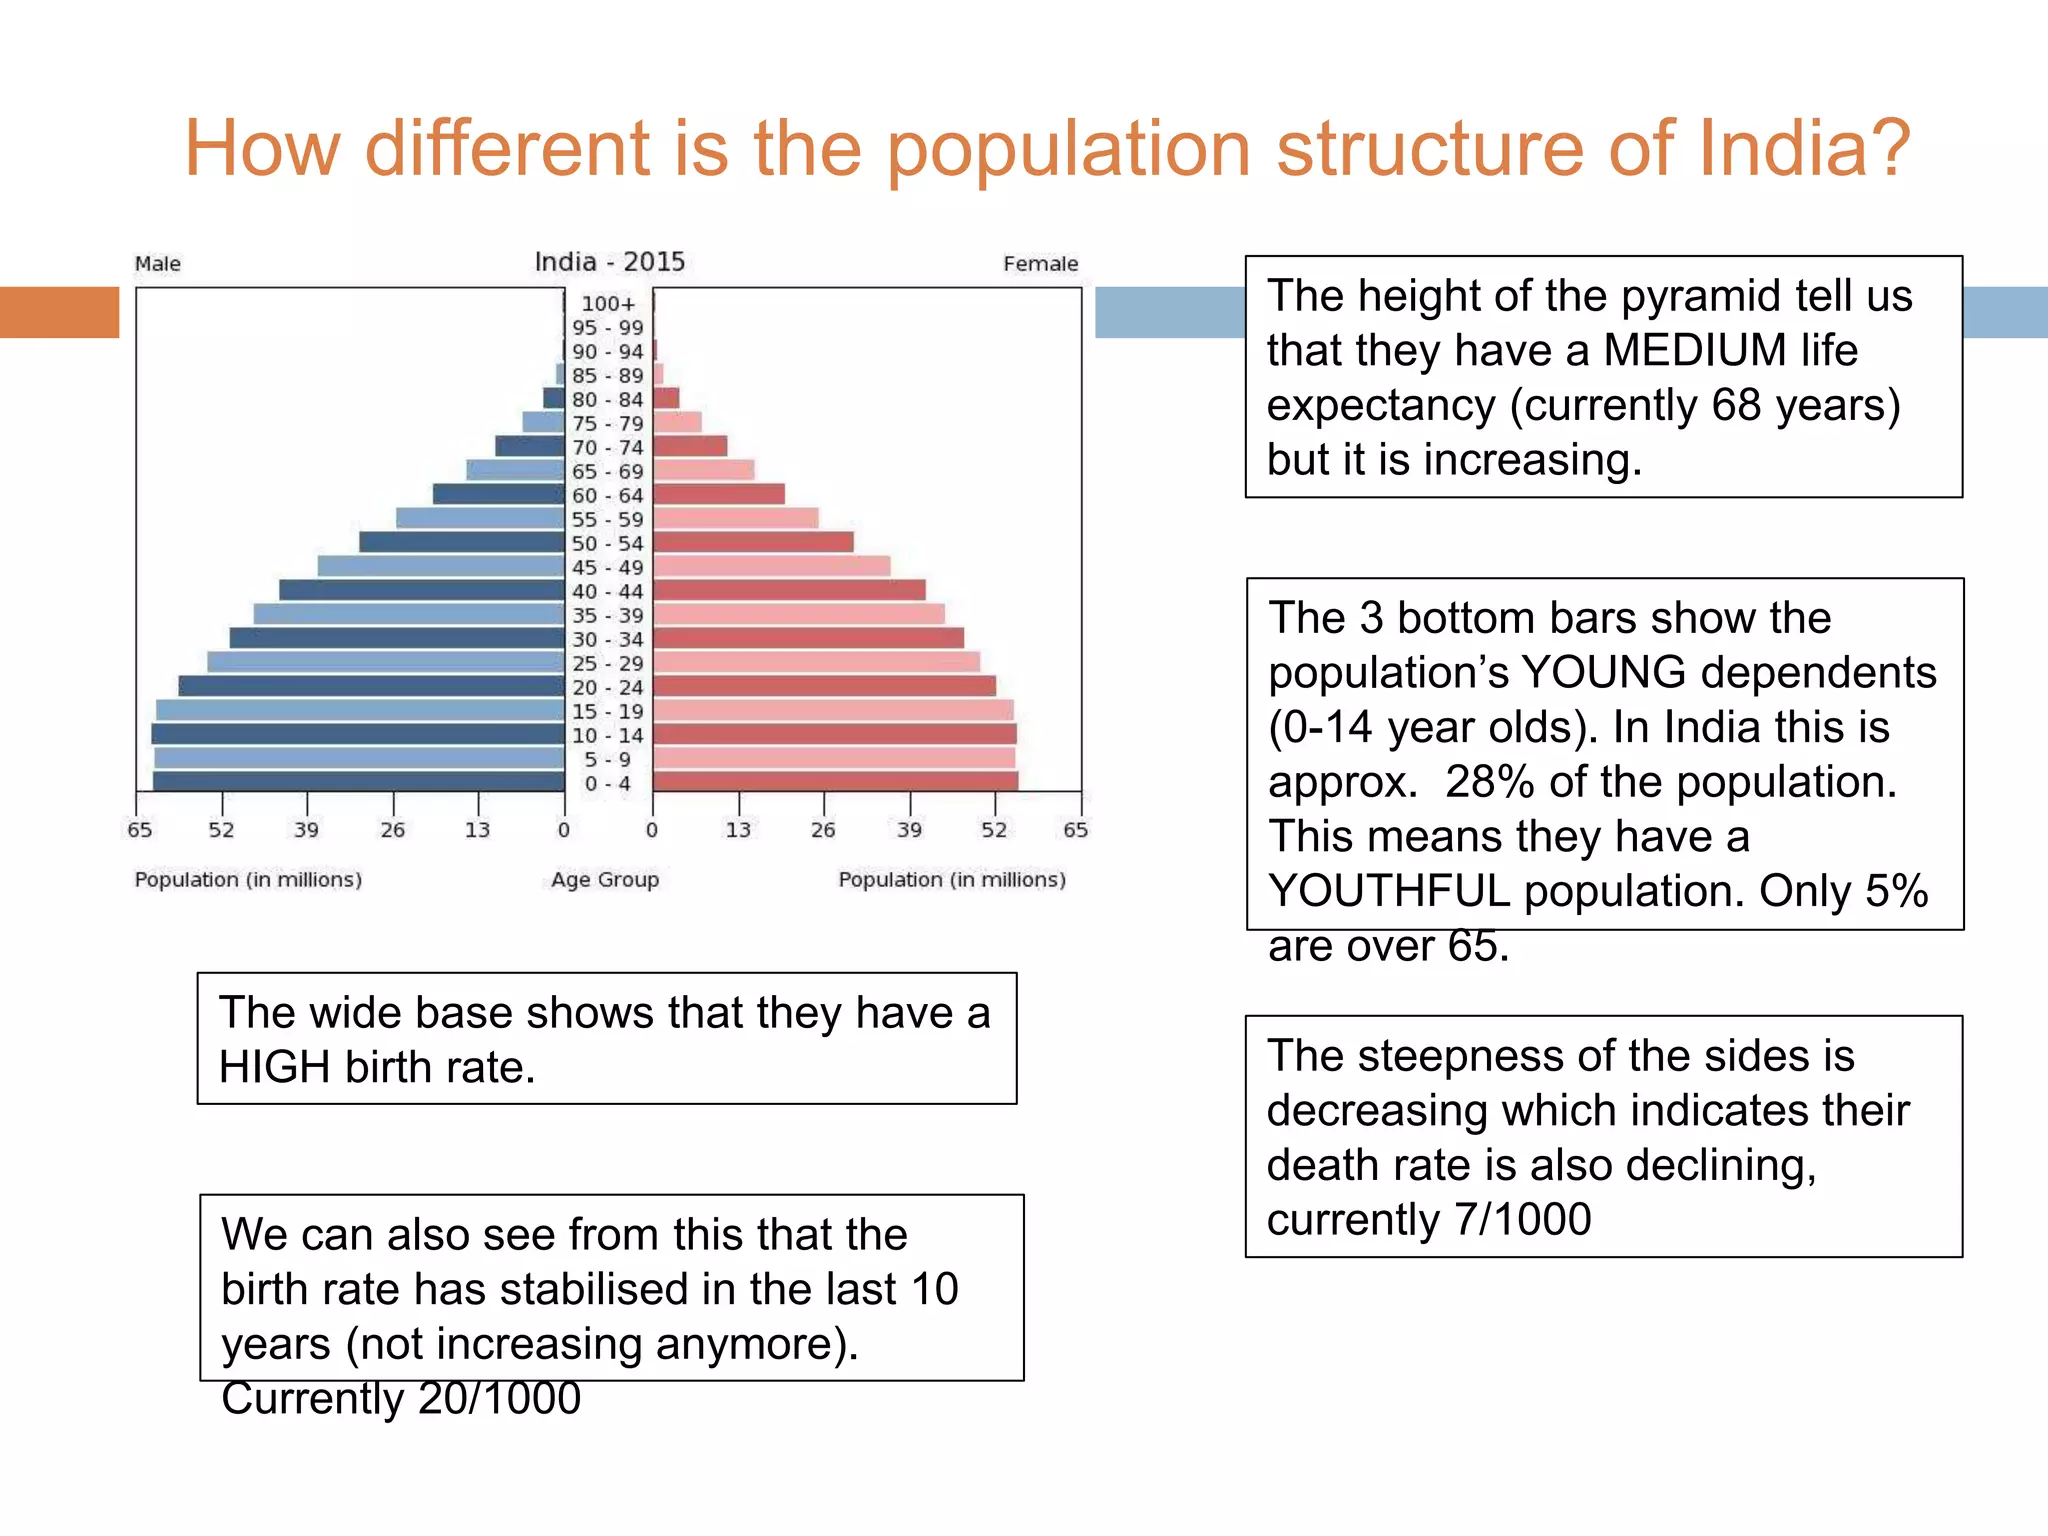
How different isthe population structure of India?
The wide base shows that they have a
HIGH birth rate.
The height of the pyramid tell us
that they have a MEDIUM life
expectancy (currently 68 years)
but it is increasing.
The 3 bottom bars show the
population’s YOUNG dependents
(0-14 year olds). In India this is
approx. 28% of the population.
This means they have a
YOUTHFUL population. Only 5%
are over 65.
We can also see from this that the
birth rate has stabilised in the last 10
years (not increasing anymore).
Currently 20/1000
The steepness of the sides is
decreasing which indicates their
death rate is also declining,
currently 7/1000
12.
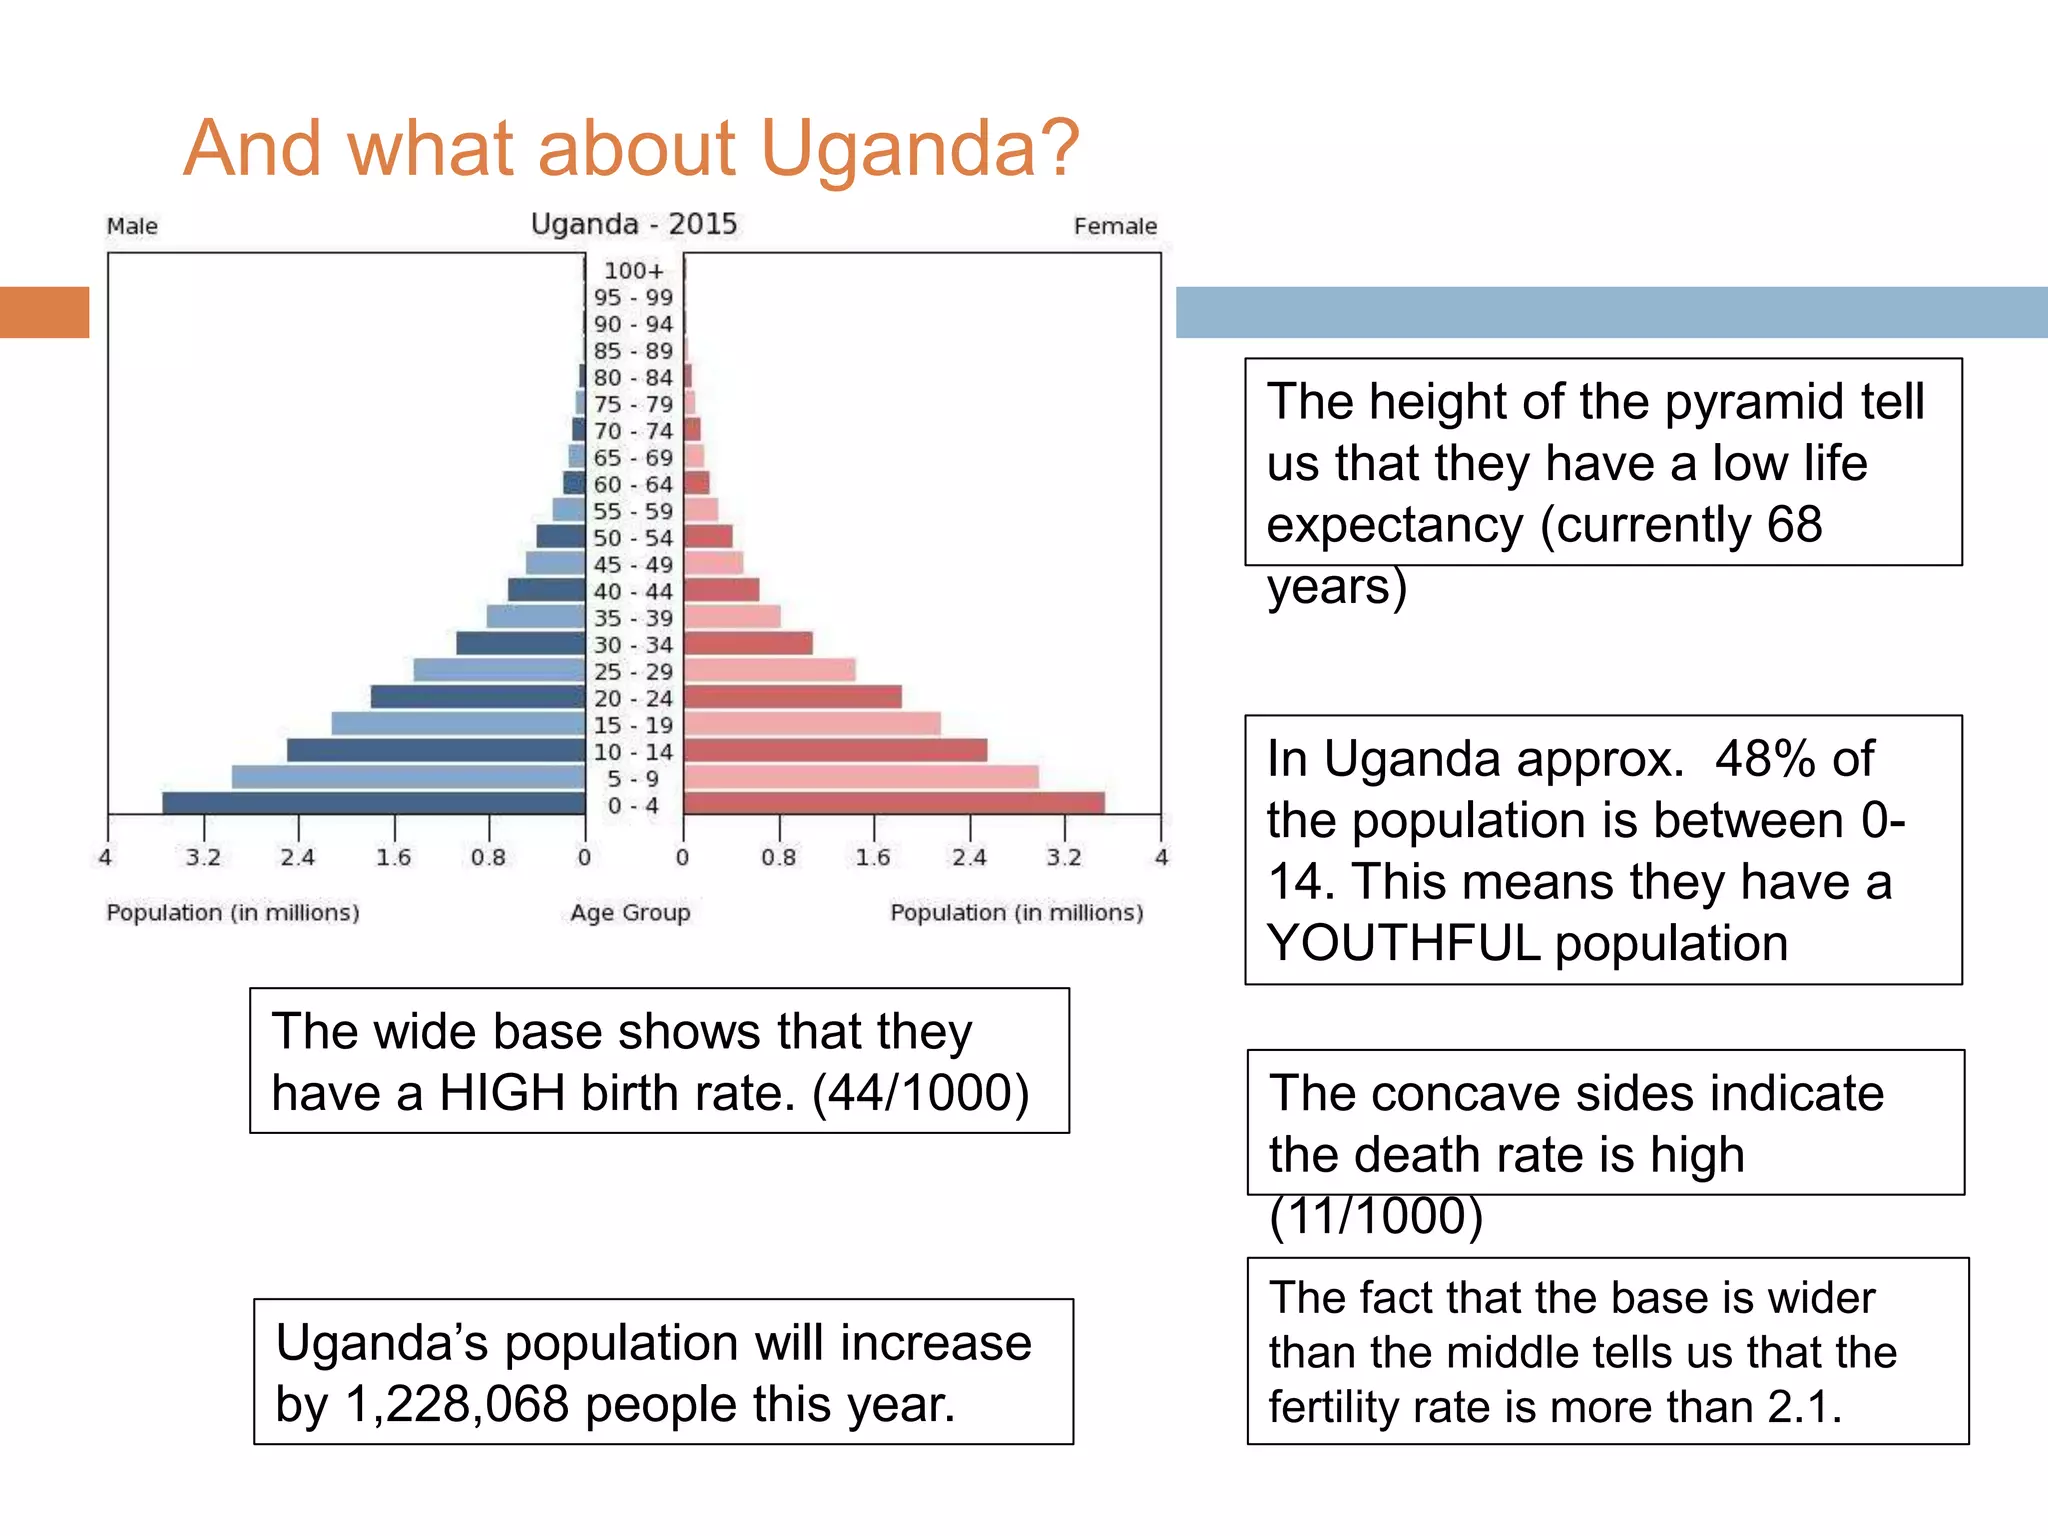
And what aboutUganda?
The wide base shows that they
have a HIGH birth rate. (44/1000)
The height of the pyramid tell
us that they have a low life
expectancy (currently 68
years)
In Uganda approx. 48% of
the population is between 0-
14. This means they have a
YOUTHFUL population
The concave sides indicate
the death rate is high
(11/1000)
Uganda’s population will increase
by 1,228,068 people this year.
The fact that the base is wider
than the middle tells us that the
fertility rate is more than 2.1.