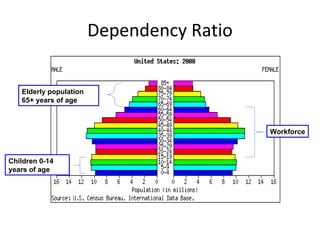
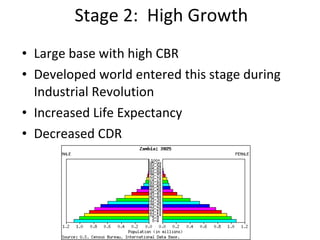
Population Pyramids by Gayle Robinson http://orru.latervista.org
Population Pyramids Provide 3 types of information : Age/gender distribution Dependency ratio Demographic Transition position
Age/Gender Distribution Each bar represents a 5-year increment beginning at 0.  Males are shown on the left. Females are shown on the right.
Dependency Ratio Elderly population 65+ years of age Children 0-14 years of age Workforce
The Demographic Transition Model Low Growth High growth Moderate Growth Low Growth http://www.uwmc.uwc.edu/geography/Demotrans/demtran.htm Population Pyramid Shape
Stage 1:  Low Growth No country in Stage 1 today High Crude Birth and Death Rates
Stage 2:  High Growth Large base with high CBR Developed world entered this stage during Industrial Revolution Increased Life Expectancy Decreased CDR Fig. 2-16: Population pyramids can vary greatly, with different fertility rates (Laredo vs. Honolulu), or among military bases (Unalaska), college towns (Lawrence), and retirement communities (Naples).
Stage 3:  Moderate Growth CBR decreases  through societal changes CDR continues to decrease Fig. 2-17: Cape Verde, which entered stage 2 of the demographic transition in about 1950, is experiencing rapid population growth. Its population history reflects the impacts of famines and out-migration.
Stage 4:  Low Growth Smaller base with decreased CBR Larger number of elderly population Can become top-heavy with decreased CBR Fig. 2-18: Chile entered stage 2 of the demographic transition in the 1930s, and it entered stage 3 in the 1960s.

Population Pyramids

  • 1.
    Population Pyramids byGayle Robinson http://orru.latervista.org
  • 2.
    Population Pyramids Provide3 types of information : Age/gender distribution Dependency ratio Demographic Transition position
  • 3.
    Age/Gender Distribution Eachbar represents a 5-year increment beginning at 0. Males are shown on the left. Females are shown on the right.
  • 4.
    Dependency Ratio Elderlypopulation 65+ years of age Children 0-14 years of age Workforce
  • 5.
    The Demographic TransitionModel Low Growth High growth Moderate Growth Low Growth http://www.uwmc.uwc.edu/geography/Demotrans/demtran.htm Population Pyramid Shape
  • 6.
    Stage 1: Low Growth No country in Stage 1 today High Crude Birth and Death Rates
  • 7.
    Stage 2: High Growth Large base with high CBR Developed world entered this stage during Industrial Revolution Increased Life Expectancy Decreased CDR Fig. 2-16: Population pyramids can vary greatly, with different fertility rates (Laredo vs. Honolulu), or among military bases (Unalaska), college towns (Lawrence), and retirement communities (Naples).
  • 8.
    Stage 3: Moderate Growth CBR decreases through societal changes CDR continues to decrease Fig. 2-17: Cape Verde, which entered stage 2 of the demographic transition in about 1950, is experiencing rapid population growth. Its population history reflects the impacts of famines and out-migration.
  • 9.
    Stage 4: Low Growth Smaller base with decreased CBR Larger number of elderly population Can become top-heavy with decreased CBR Fig. 2-18: Chile entered stage 2 of the demographic transition in the 1930s, and it entered stage 3 in the 1960s.