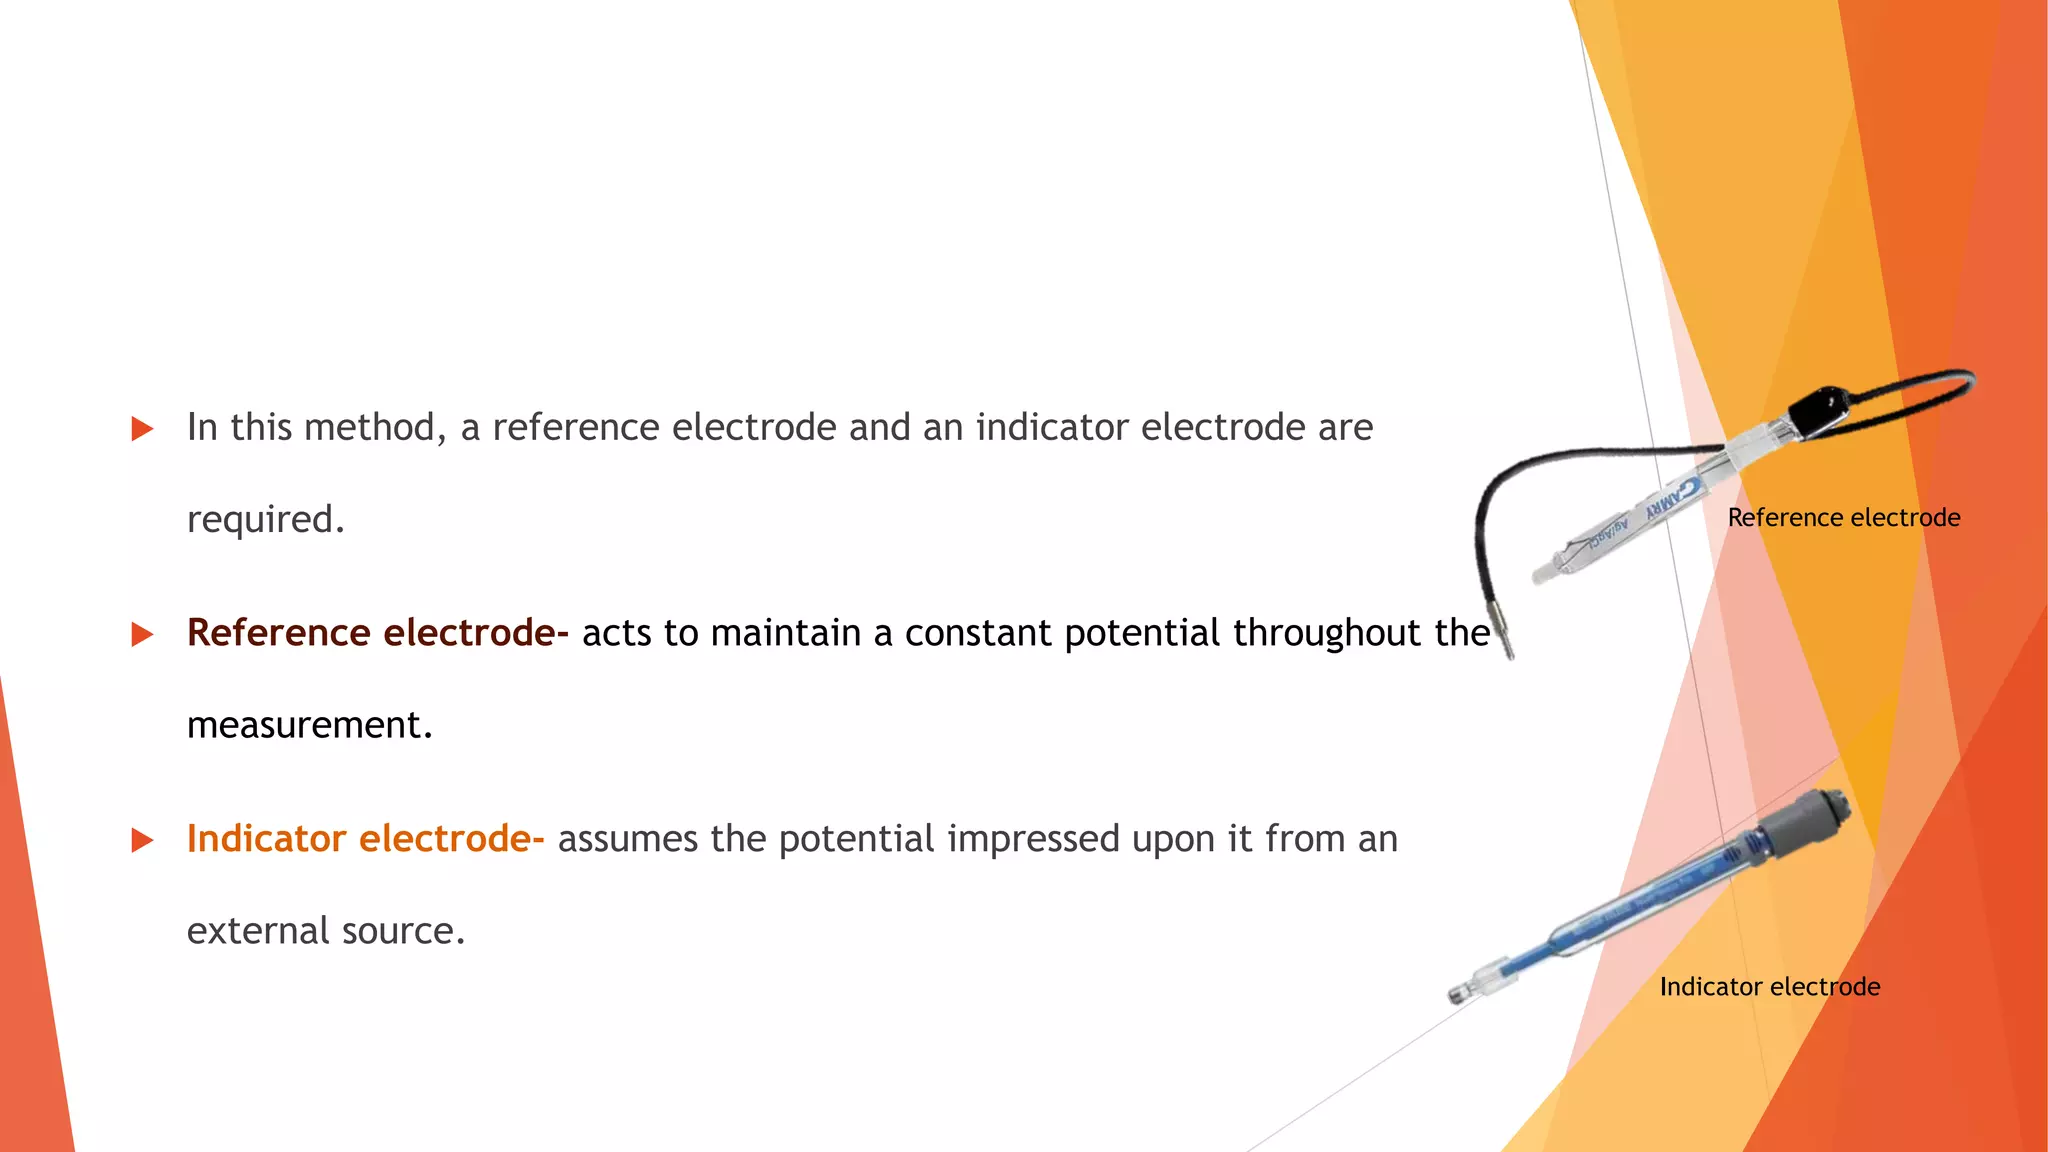
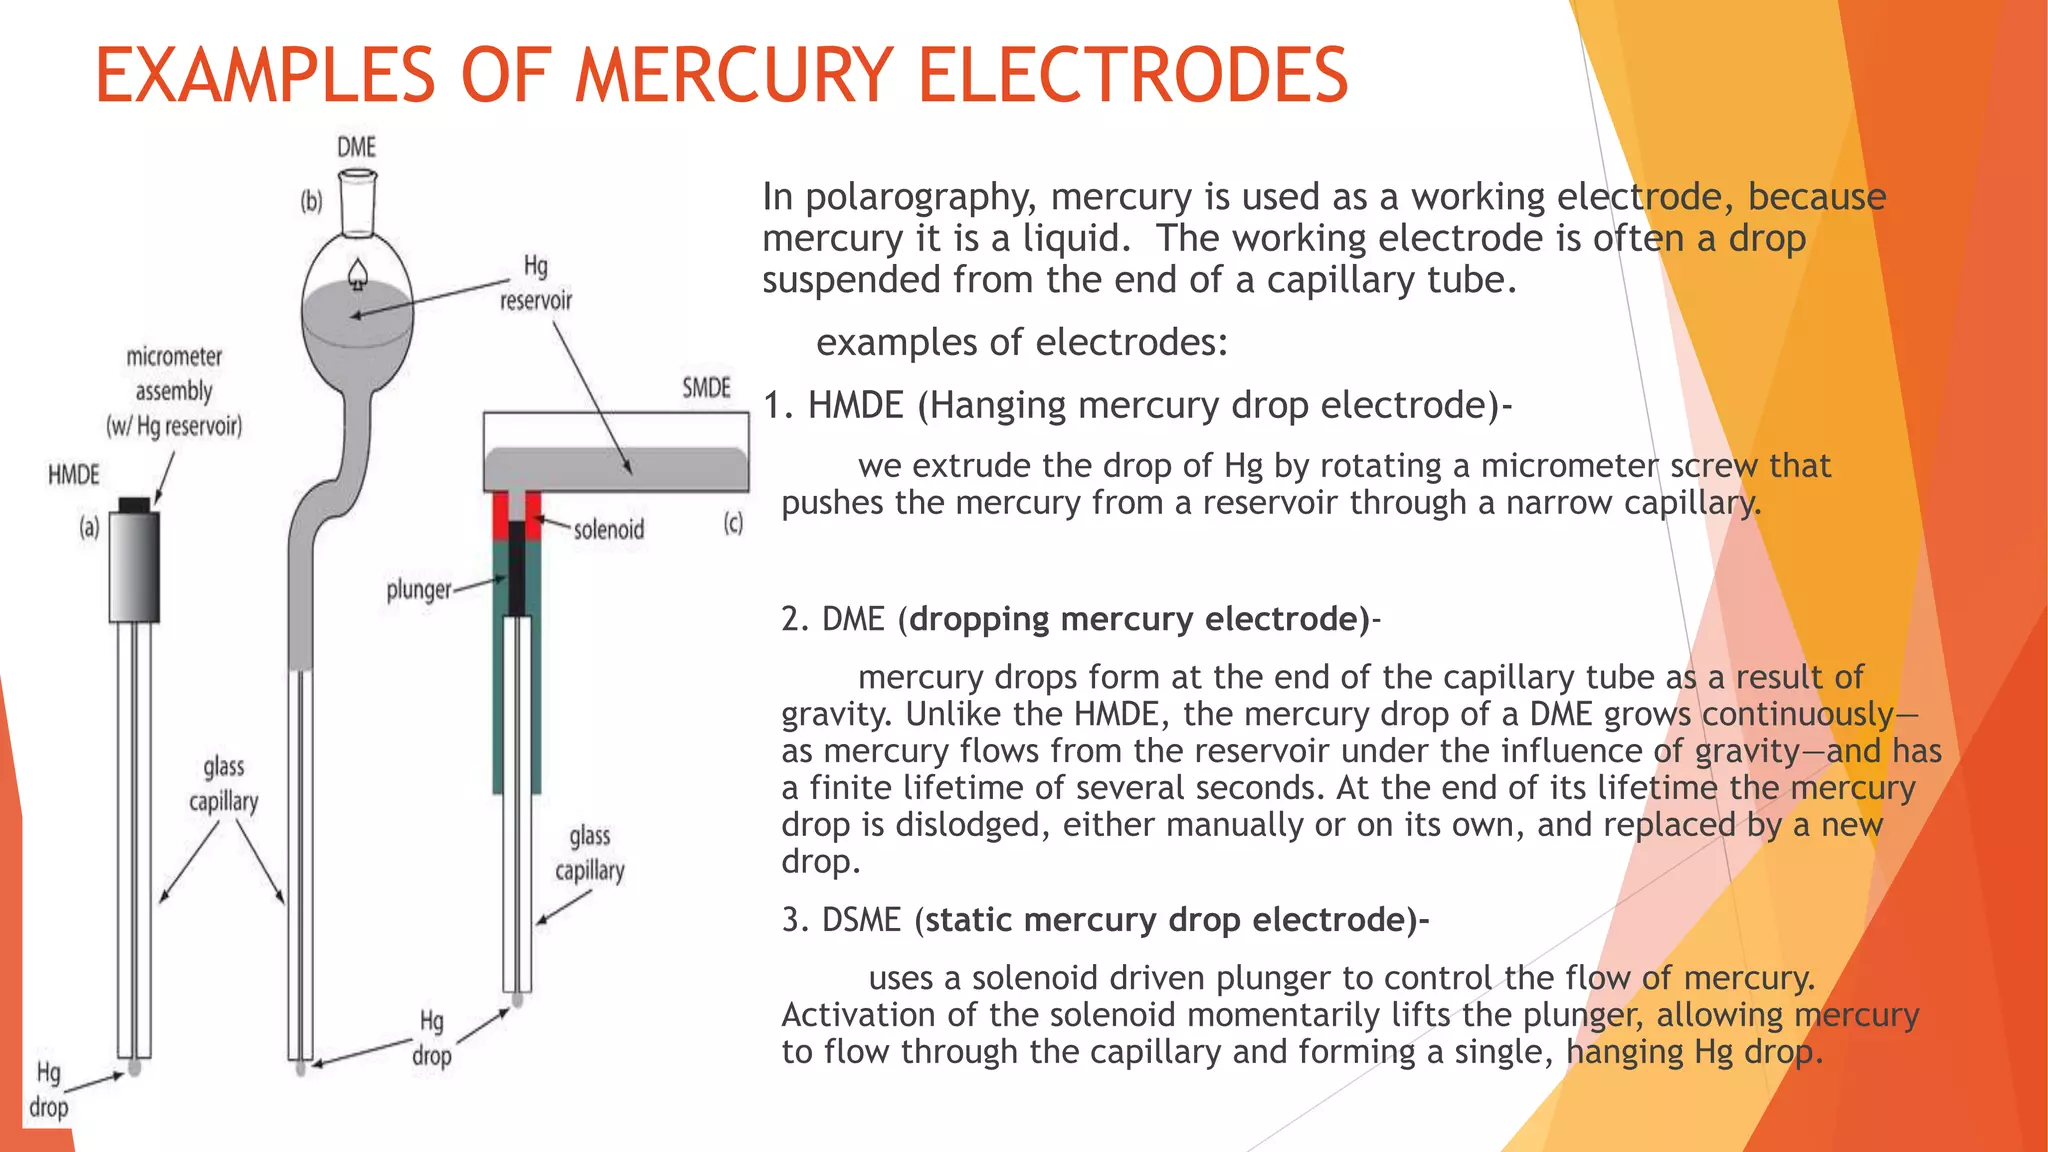
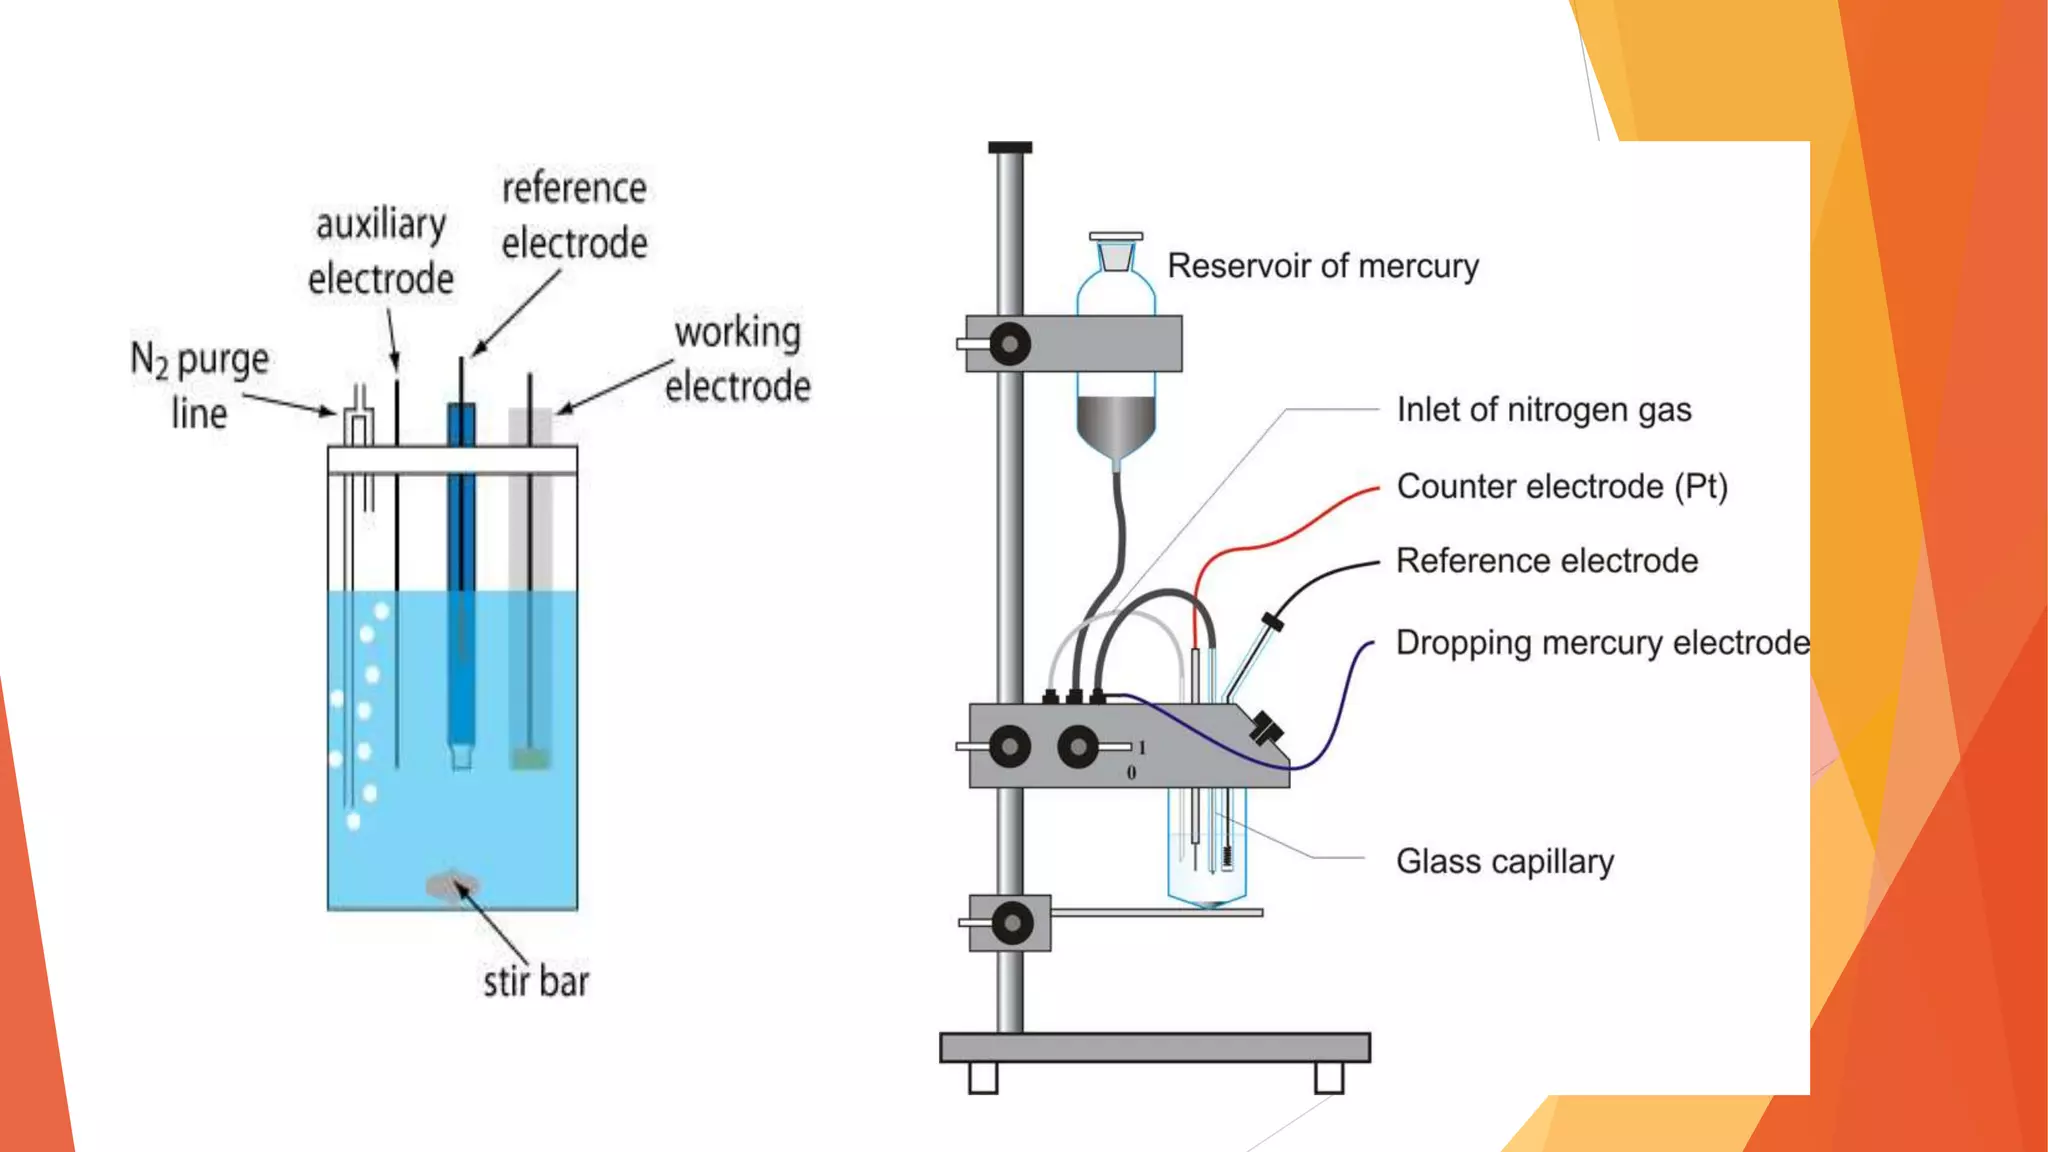
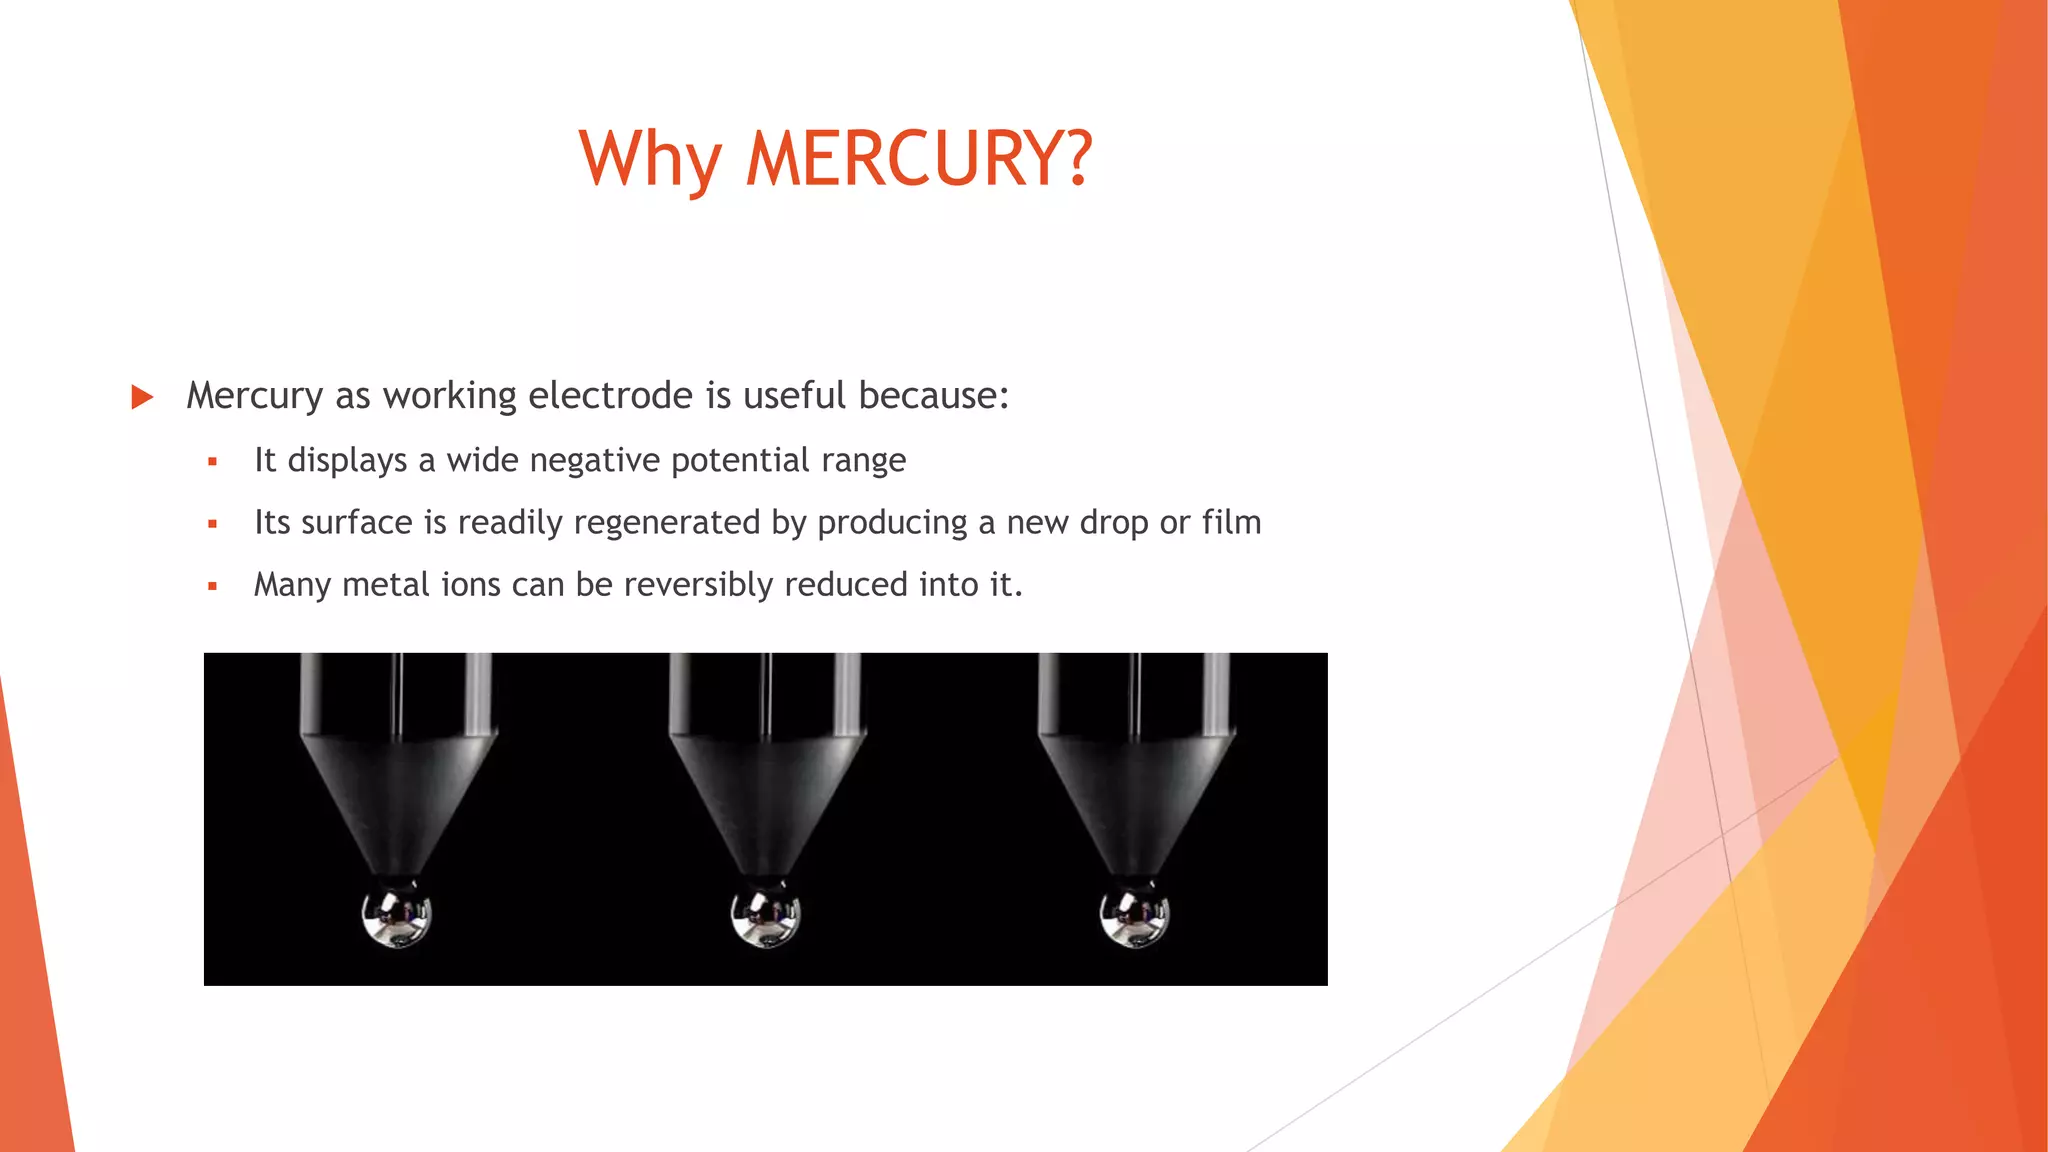
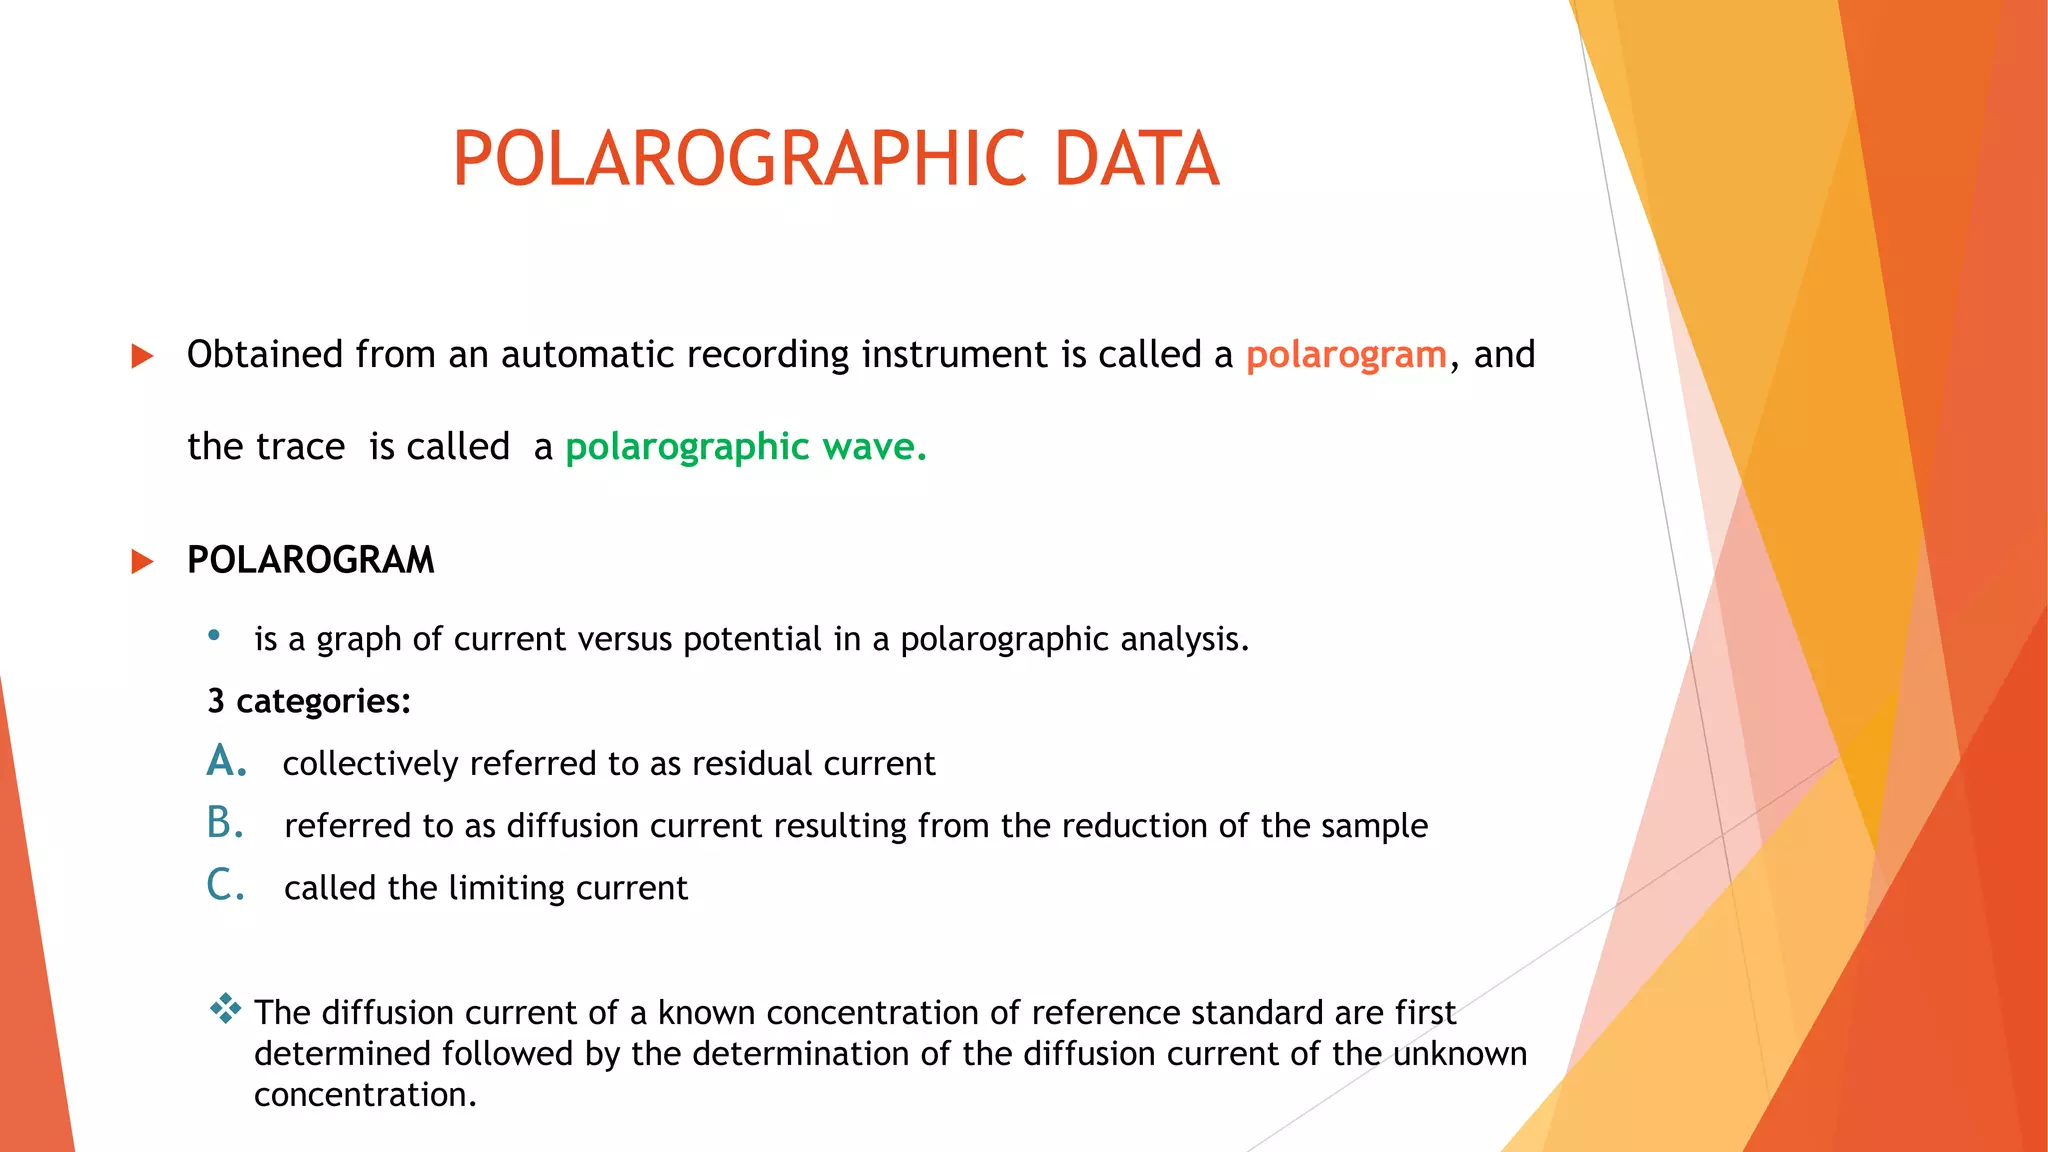
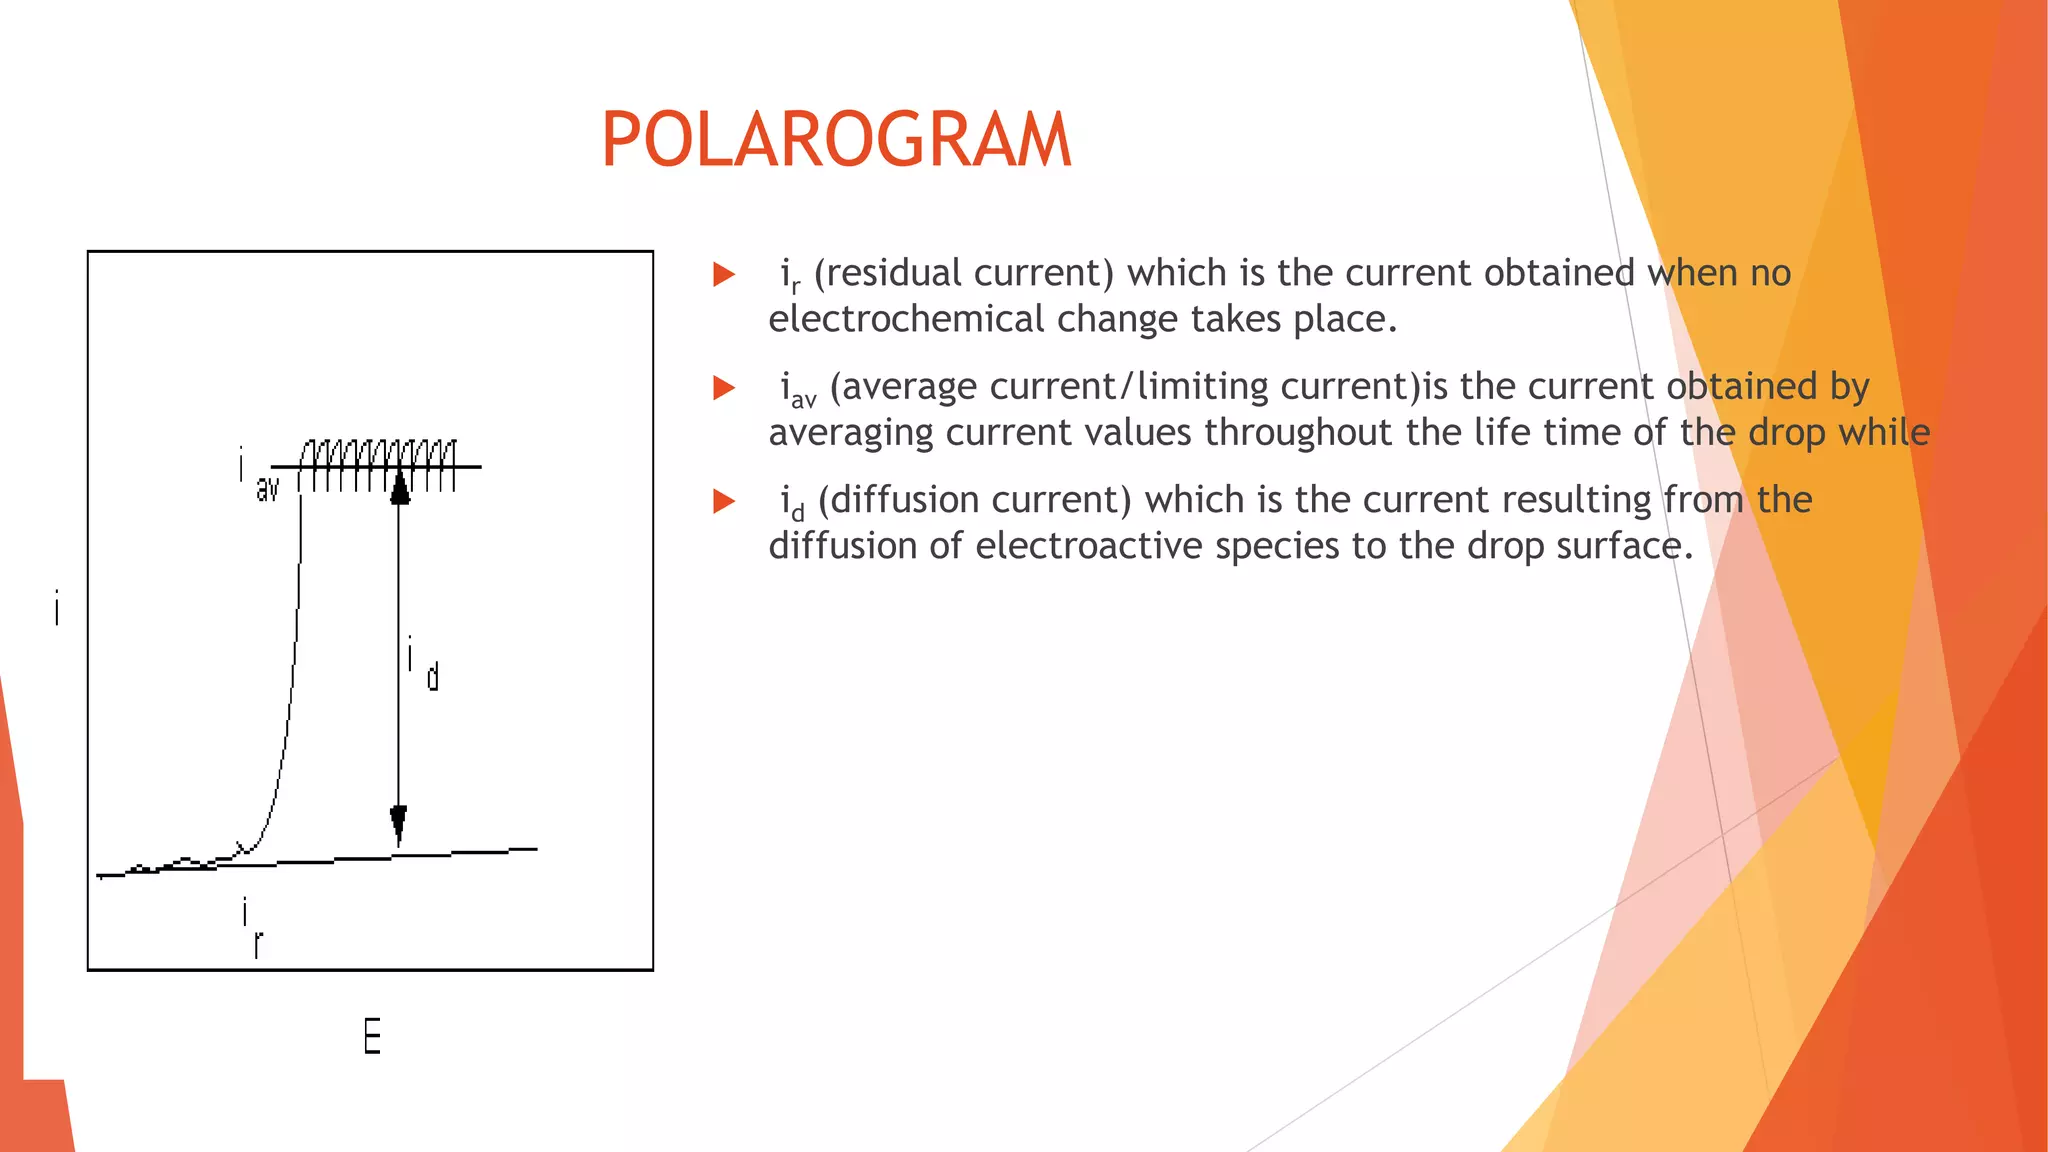
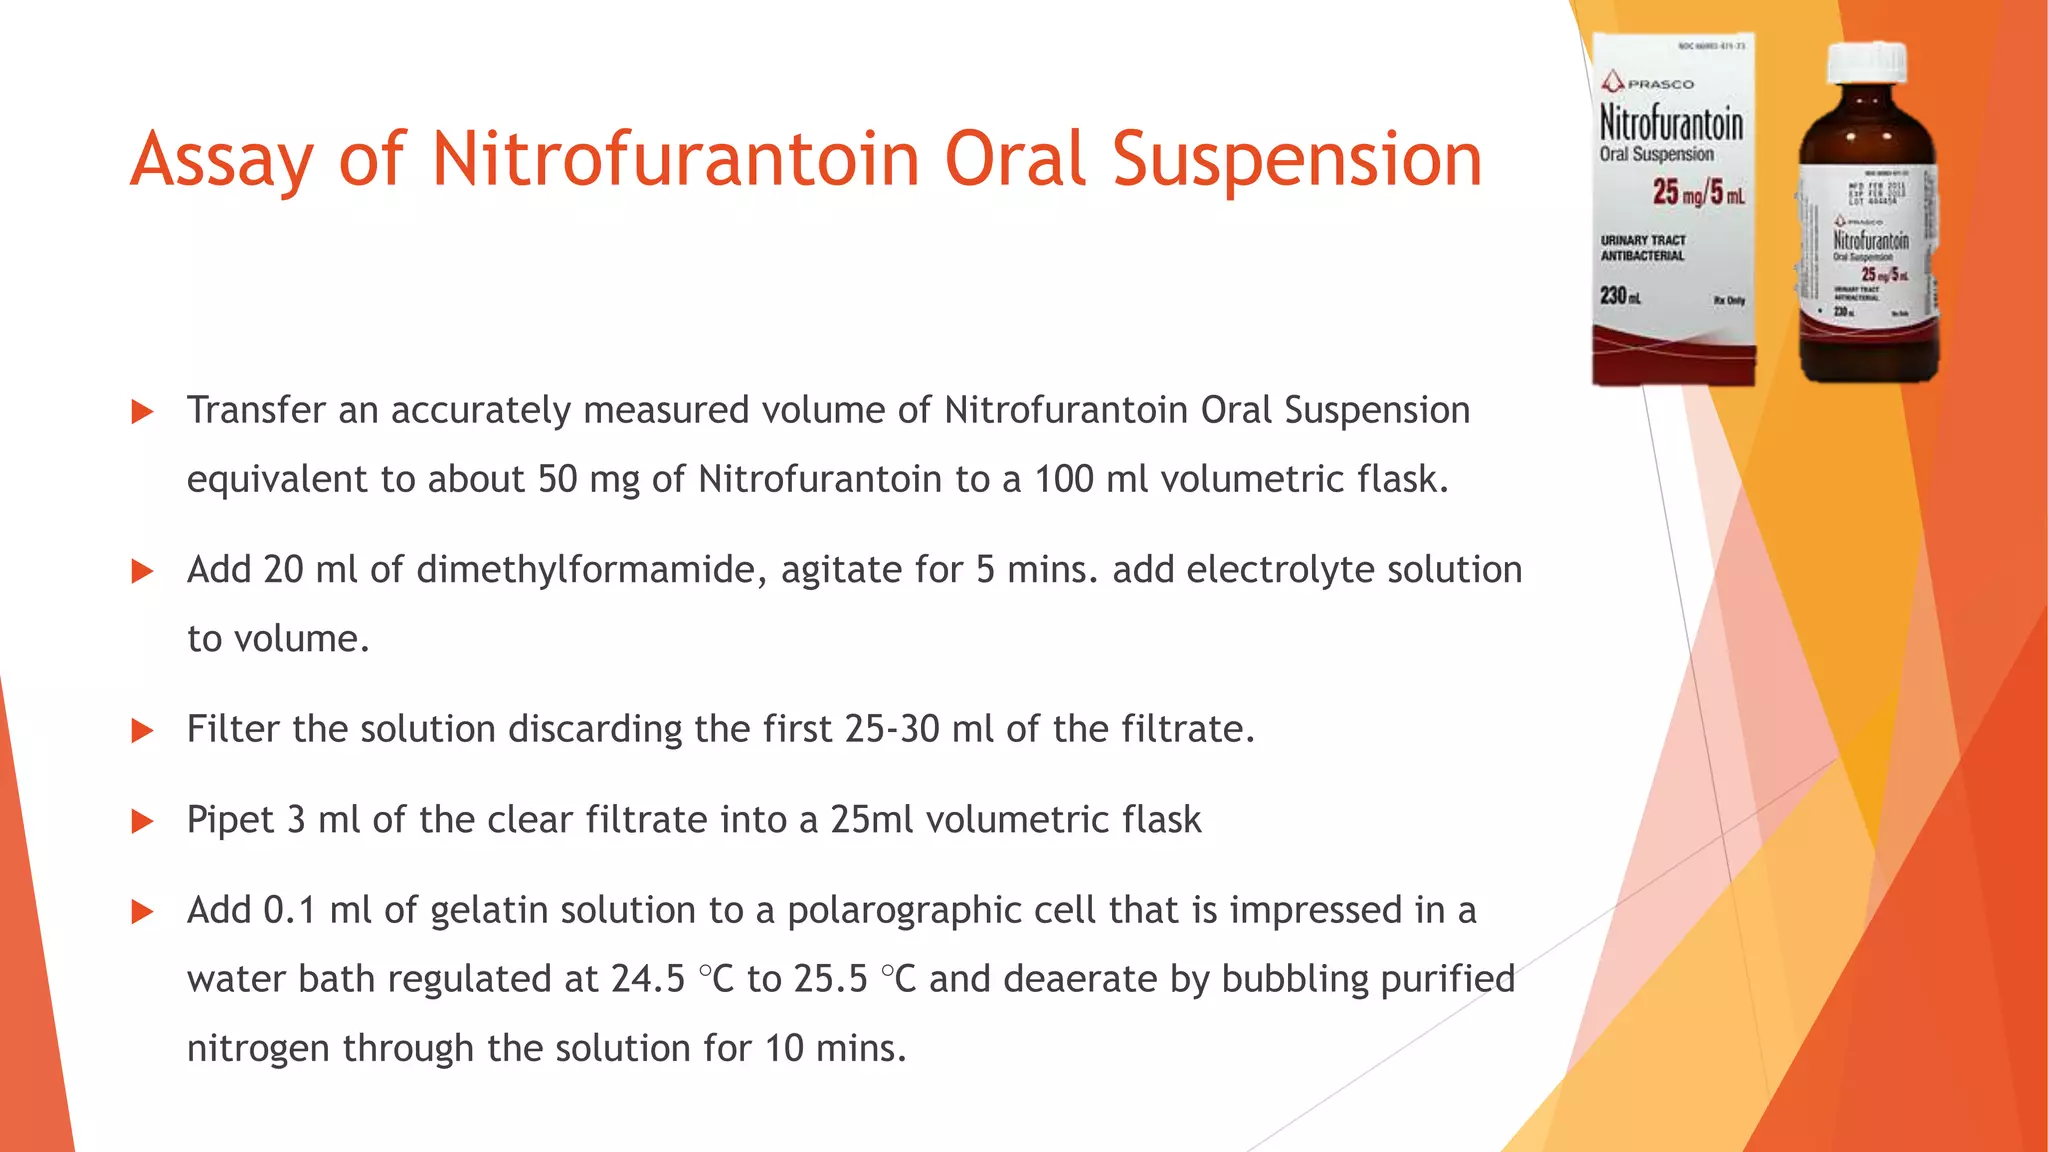
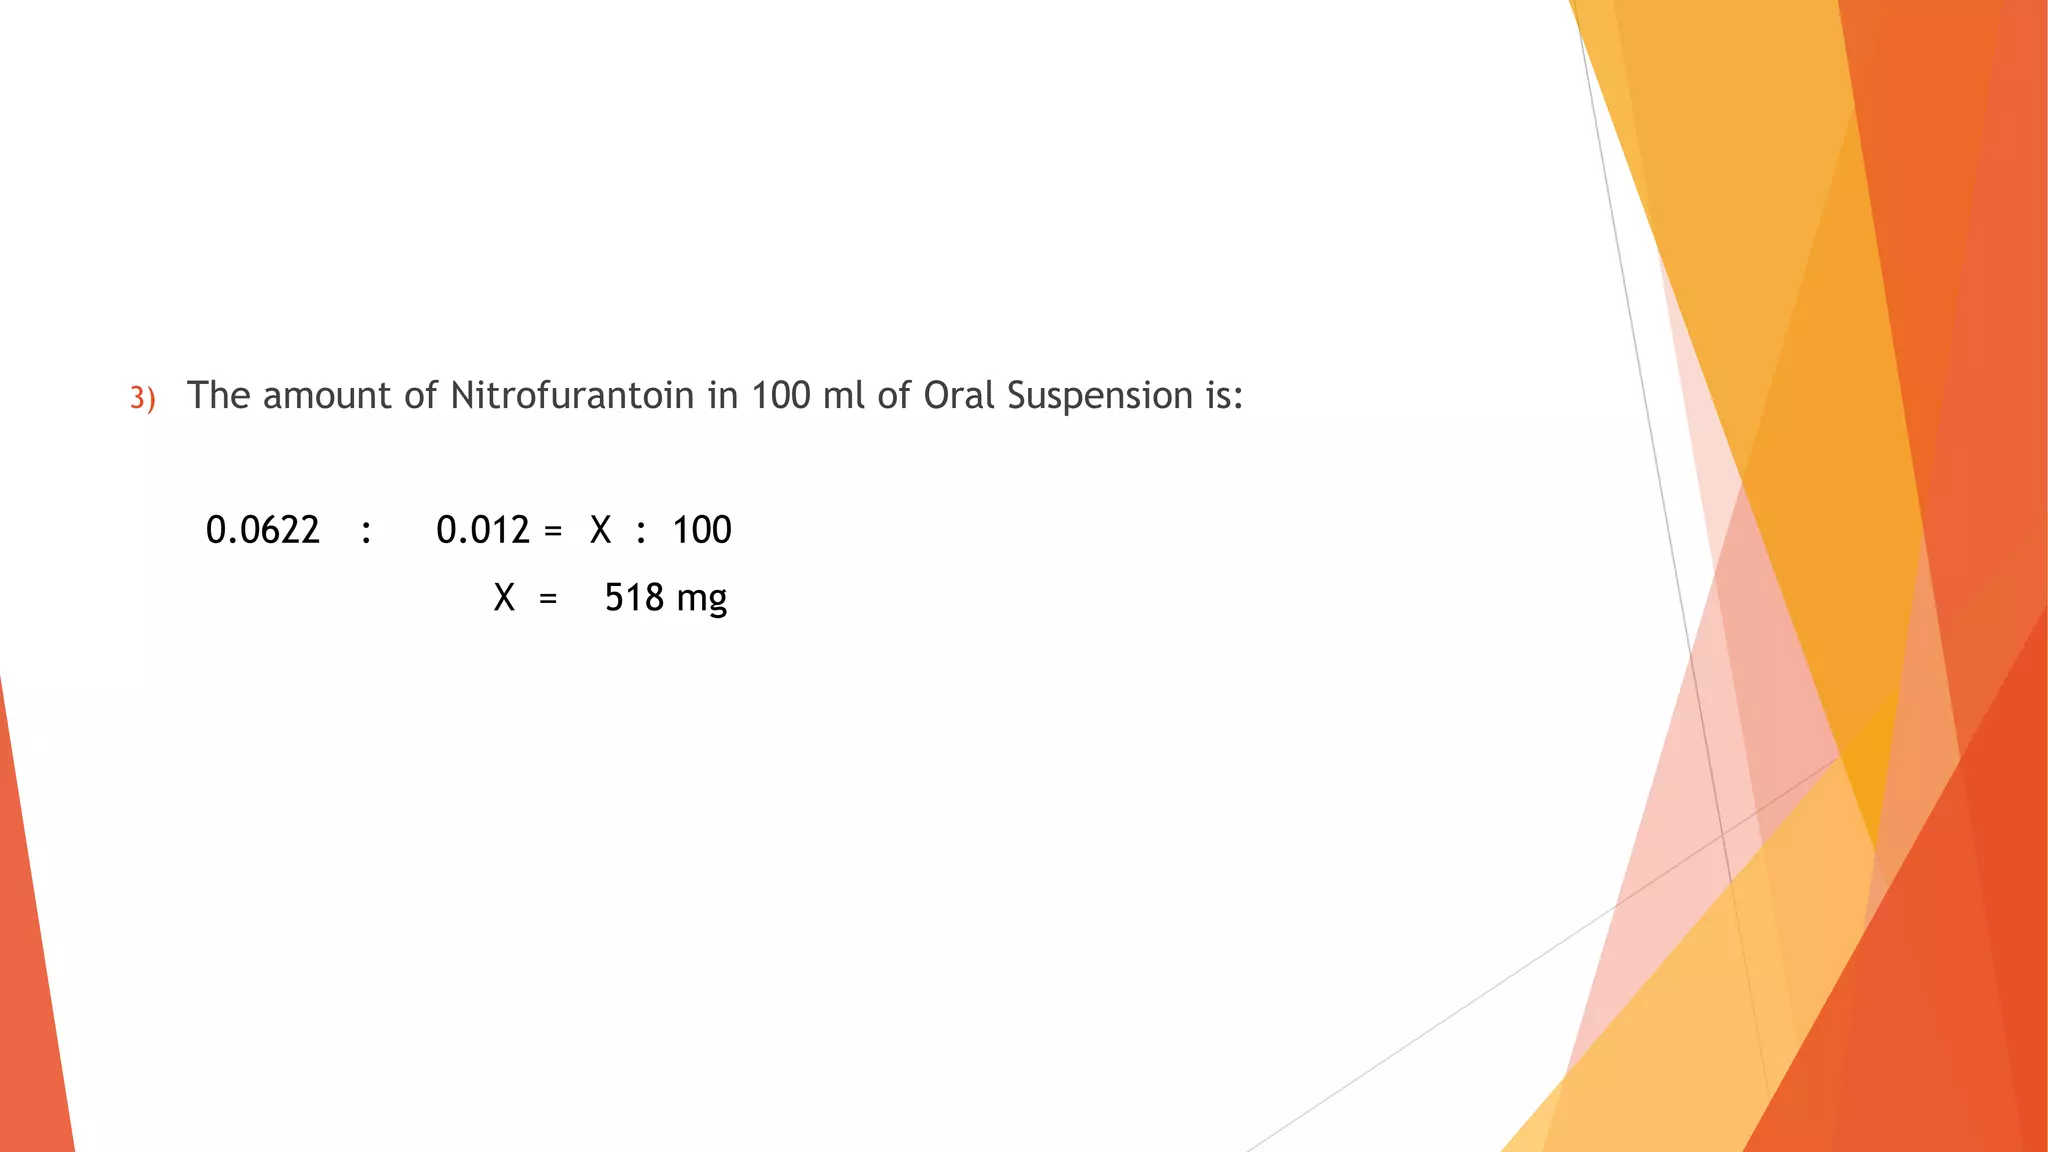
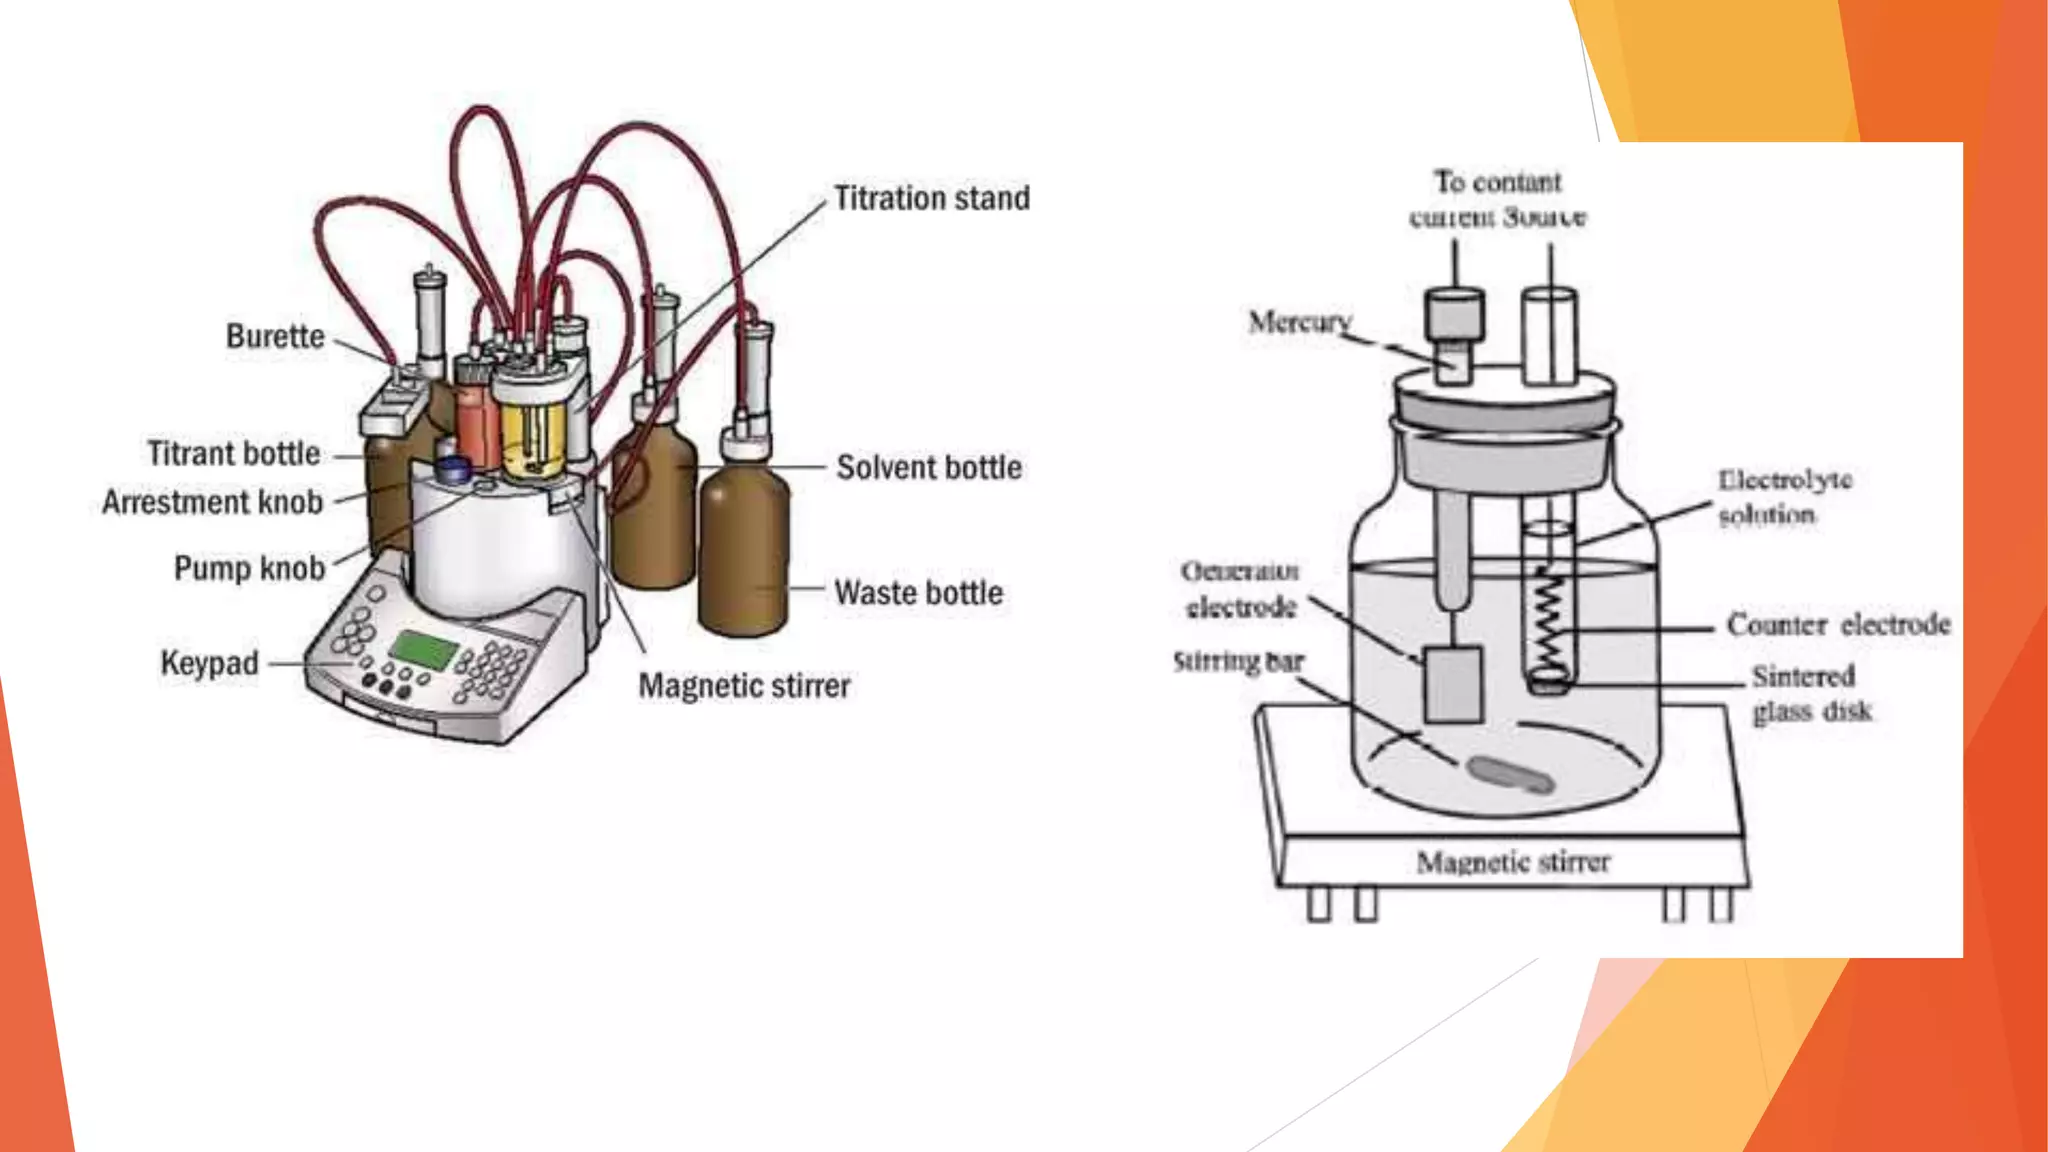
POLAROGRAPHY
ROSESALINA PULLOS
CHELSI SOLIVA
POLAROGRAPHY
- an electromechanical technique of analyzing solutions that measures the
current flowing between two electrodes in the solution as well as the gradually
increasing applied voltage to determine respectively the concentration of a
solute and its nature.
-created by: Jaroslav Heyrovsky
POLAROGRAPHY
 “Polarographic Analysis”
 Is a method of analysis based on the measurement of current electrolysis of
an electroactive species at a given electrode potential under controlled
conditions.
 It is the branch of voltammetry where the working electrode is a dropping
mercury electrode (DME) or a static mercury drop electrode (SMDE), which
are useful for their wide cathodic ranges and renewable surfaces.
 In this method, a reference electrode and an indicator electrode are
required.
 Reference electrode- acts to maintain a constant potential throughout the
measurement.
 Indicator electrode- assumes the potential impressed upon it from an
external source.
Reference electrode
Indicator electrode
EXAMPLES OF MERCURY ELECTRODES
 In polarography, mercury is used as a working electrode, because
mercury it is a liquid. The working electrode is often a drop
suspended from the end of a capillary tube.
3 examples of electrodes:
1. 1. HMDE (Hanging mercury drop electrode)-
we extrude the drop of Hg by rotating a micrometer screw that
pushes the mercury from a reservoir through a narrow capillary.
2. DME (dropping mercury electrode)-
mercury drops form at the end of the capillary tube as a result of
gravity. Unlike the HMDE, the mercury drop of a DME grows continuously—
as mercury flows from the reservoir under the influence of gravity—and has
a finite lifetime of several seconds. At the end of its lifetime the mercury
drop is dislodged, either manually or on its own, and replaced by a new
drop.
3. DSME (static mercury drop electrode)-
uses a solenoid driven plunger to control the flow of mercury.
Activation of the solenoid momentarily lifts the plunger, allowing mercury
to flow through the capillary and forming a single, hanging Hg drop.
PRINCIPLE
 Study of solutions or of electrode processes by means of electrolysis with two
electrodes, one polarizable and one unpolarizable, the former formed by
mercury regularly dropping from capillary tube.
 POLARIZED ELECTRODE: Dropping Mercury Electrode (DME)
 DEPOLARIZED ELECTRODE: Saturated Calomel Electrode
PRINCIPLE
 Mercury continuously drops
from reservoir through a
capillary tube into the solution.
 The optimum interval between
drops for most analyses is
between 2 and 5 seconds.
Why MERCURY?
 Mercury as working electrode is useful because:
 It displays a wide negative potential range
 Its surface is readily regenerated by producing a new drop or film
 Many metal ions can be reversibly reduced into it.
POLAROGRAPHIC DATA
 Obtained from an automatic recording instrument is called a polarogram, and
the trace is called a polarographic wave.
 POLAROGRAM
• is a graph of current versus potential in a polarographic analysis.
3 categories:
A. collectively referred to as residual current
B. referred to as diffusion current resulting from the reduction of the sample
C. called the limiting current
 The diffusion current of a known concentration of reference standard are first
determined followed by the determination of the diffusion current of the unknown
concentration.
POLAROGRAM
 ir (residual current) which is the current obtained when no
electrochemical change takes place.
 iav (average current/limiting current)is the current obtained by
averaging current values throughout the life time of the drop while
 id (diffusion current) which is the current resulting from the
diffusion of electroactive species to the drop surface.
Procedures
 Materials Required:
1. Polarographic Instrument.
2. Beaker.
3. 10 mL Pipette.
4. Wash bottle.
5. 100 mL volumetric flask.
Procedure
 Reagents:
1. 1, 2, 3, 4 and 5 mM Cadmium standards.
2. 2 M KCl solution.
3. 0.2% gelatin solution.
4. Distilled water.
Procedure
 Select the concentration from the list.
 Click “Load Cadmium Sample” button.
 Select “Scan Analysis”.
 Click “Plot Graph”.
 Select the unknown concentration from the concentration list.
 Repeat the steps 2, 3 and 4.
 Enter the concentration values on the worksheet.
 Plot calibration curve by clicking the “plot” button on the worksheet.
 Calculate the unknown concentration value from the calibration curve.
ADVANTAGES
1. Simple sample handling
2. Speed of analysis
3. High sensitivity
4. Comparable or better accuracy
5. Cheaper instrumentation and lower cost of chemicals used
6. Limited used of environmentally unfriendly organic solvents
Assay of Nitrofurantoin Oral Suspension
 Transfer an accurately measured volume of Nitrofurantoin Oral Suspension
equivalent to about 50 mg of Nitrofurantoin to a 100 ml volumetric flask.
 Add 20 ml of dimethylformamide, agitate for 5 mins. add electrolyte solution
to volume.
 Filter the solution discarding the first 25-30 ml of the filtrate.
 Pipet 3 ml of the clear filtrate into a 25ml volumetric flask
 Add 0.1 ml of gelatin solution to a polarographic cell that is impressed in a
water bath regulated at 24.5 °C to 25.5 °C and deaerate by bubbling purified
nitrogen through the solution for 10 mins.
 Insert the mercury electrode of a suitable polarography and record the polarogram using a standard
calomel electrode as the reference electrode.
 Determine the height of the diffusion current at -0.0 V.
 Calculate the quantity in mg of Nitrofurantoin in each ml of the suspension taken by the formula:
833(c/V) (idu)/ (ids).
which V =volume in ml of the suspension taken
idu = diffusion current of the unknown solution
ids is that determined in a solution of USP Nitrofurantoin Reference Standard, the concentration of
which C milligrams per mL
Data and Calculation
exactly 10 ml of Oral Suspension was taken for the assay. Polarogram of this
dilution measured 12.45 cm. A polarogram of a reference standard solution
containing 0.06 mg/ml measured 12 cm. Calculate the mg of Nitrofurantoin in
the final dilution of Oral Suspension.
1) Determine the amount (mg) of Nitrofurantoin in the final dilution.
Cu = = = 0.0622 mg/ml
2) Determine the volume in ml of the Oral Suspension in the final dilution.
10 : 100 = X : 3 0.3 : 25 = X : 1
X = 0.3 ml X = 0.012 ml
(Cs) (cmu)
cms
0.06 mg/ml x 12.45
12
3) The amount of Nitrofurantoin in 100 ml of Oral Suspension is:
0.0622 : 0.012 = X : 100
X = 518 mg
PHARMACEUTICAL APPLICATIONS
 Dissolved oxygen and peroxides
 Trace metals and metal –containing drugs
 Antiseptics and insecticides
 Vitamins
 Hormones
 Antibiotics
 Alkaloids
 Blood serum and cancer diagnosis
Coulometric Analysis
 Coulometric Analysis
- Defined as an electroanalytical method in which the quantity of electricity
consumed during an electrolysis reaction is a measure of the quantity of
electroactive species being analyzed.
- Objective:
- To measure accurately the quantity of electricity
consumed by the analyte species during the quantitative
electrochemical reaction.
W= Qf =
M
n
W = weight of analyte
M = molecular weight
n= number of electrons involved in the electrochemical
 By Karl Fischer
 It is used to determine the amount of water in a sample.
 It can determine concentrations of water on the order of milligrams per liter.
 It is used to find the amount of water in substances such
as butter, sugar, cheese, paper, and petroleum.
Polarography

Polarography

  • 1.
  • 2.
    POLAROGRAPHY - an electromechanicaltechnique of analyzing solutions that measures the current flowing between two electrodes in the solution as well as the gradually increasing applied voltage to determine respectively the concentration of a solute and its nature. -created by: Jaroslav Heyrovsky
  • 3.
    POLAROGRAPHY  “Polarographic Analysis” Is a method of analysis based on the measurement of current electrolysis of an electroactive species at a given electrode potential under controlled conditions.  It is the branch of voltammetry where the working electrode is a dropping mercury electrode (DME) or a static mercury drop electrode (SMDE), which are useful for their wide cathodic ranges and renewable surfaces.
  • 4.
     In thismethod, a reference electrode and an indicator electrode are required.  Reference electrode- acts to maintain a constant potential throughout the measurement.  Indicator electrode- assumes the potential impressed upon it from an external source. Reference electrode Indicator electrode
  • 5.
    EXAMPLES OF MERCURYELECTRODES  In polarography, mercury is used as a working electrode, because mercury it is a liquid. The working electrode is often a drop suspended from the end of a capillary tube. 3 examples of electrodes: 1. 1. HMDE (Hanging mercury drop electrode)- we extrude the drop of Hg by rotating a micrometer screw that pushes the mercury from a reservoir through a narrow capillary. 2. DME (dropping mercury electrode)- mercury drops form at the end of the capillary tube as a result of gravity. Unlike the HMDE, the mercury drop of a DME grows continuously— as mercury flows from the reservoir under the influence of gravity—and has a finite lifetime of several seconds. At the end of its lifetime the mercury drop is dislodged, either manually or on its own, and replaced by a new drop. 3. DSME (static mercury drop electrode)- uses a solenoid driven plunger to control the flow of mercury. Activation of the solenoid momentarily lifts the plunger, allowing mercury to flow through the capillary and forming a single, hanging Hg drop.
  • 6.
    PRINCIPLE  Study ofsolutions or of electrode processes by means of electrolysis with two electrodes, one polarizable and one unpolarizable, the former formed by mercury regularly dropping from capillary tube.  POLARIZED ELECTRODE: Dropping Mercury Electrode (DME)  DEPOLARIZED ELECTRODE: Saturated Calomel Electrode
  • 7.
    PRINCIPLE  Mercury continuouslydrops from reservoir through a capillary tube into the solution.  The optimum interval between drops for most analyses is between 2 and 5 seconds.
  • 9.
    Why MERCURY?  Mercuryas working electrode is useful because:  It displays a wide negative potential range  Its surface is readily regenerated by producing a new drop or film  Many metal ions can be reversibly reduced into it.
  • 10.
    POLAROGRAPHIC DATA  Obtainedfrom an automatic recording instrument is called a polarogram, and the trace is called a polarographic wave.  POLAROGRAM • is a graph of current versus potential in a polarographic analysis. 3 categories: A. collectively referred to as residual current B. referred to as diffusion current resulting from the reduction of the sample C. called the limiting current  The diffusion current of a known concentration of reference standard are first determined followed by the determination of the diffusion current of the unknown concentration.
  • 11.
    POLAROGRAM  ir (residualcurrent) which is the current obtained when no electrochemical change takes place.  iav (average current/limiting current)is the current obtained by averaging current values throughout the life time of the drop while  id (diffusion current) which is the current resulting from the diffusion of electroactive species to the drop surface.
  • 12.
    Procedures  Materials Required: 1.Polarographic Instrument. 2. Beaker. 3. 10 mL Pipette. 4. Wash bottle. 5. 100 mL volumetric flask.
  • 13.
    Procedure  Reagents: 1. 1,2, 3, 4 and 5 mM Cadmium standards. 2. 2 M KCl solution. 3. 0.2% gelatin solution. 4. Distilled water.
  • 14.
    Procedure  Select theconcentration from the list.  Click “Load Cadmium Sample” button.  Select “Scan Analysis”.  Click “Plot Graph”.  Select the unknown concentration from the concentration list.  Repeat the steps 2, 3 and 4.  Enter the concentration values on the worksheet.  Plot calibration curve by clicking the “plot” button on the worksheet.  Calculate the unknown concentration value from the calibration curve.
  • 15.
    ADVANTAGES 1. Simple samplehandling 2. Speed of analysis 3. High sensitivity 4. Comparable or better accuracy 5. Cheaper instrumentation and lower cost of chemicals used 6. Limited used of environmentally unfriendly organic solvents
  • 16.
    Assay of NitrofurantoinOral Suspension  Transfer an accurately measured volume of Nitrofurantoin Oral Suspension equivalent to about 50 mg of Nitrofurantoin to a 100 ml volumetric flask.  Add 20 ml of dimethylformamide, agitate for 5 mins. add electrolyte solution to volume.  Filter the solution discarding the first 25-30 ml of the filtrate.  Pipet 3 ml of the clear filtrate into a 25ml volumetric flask  Add 0.1 ml of gelatin solution to a polarographic cell that is impressed in a water bath regulated at 24.5 °C to 25.5 °C and deaerate by bubbling purified nitrogen through the solution for 10 mins.
  • 17.
     Insert themercury electrode of a suitable polarography and record the polarogram using a standard calomel electrode as the reference electrode.  Determine the height of the diffusion current at -0.0 V.  Calculate the quantity in mg of Nitrofurantoin in each ml of the suspension taken by the formula: 833(c/V) (idu)/ (ids). which V =volume in ml of the suspension taken idu = diffusion current of the unknown solution ids is that determined in a solution of USP Nitrofurantoin Reference Standard, the concentration of which C milligrams per mL
  • 18.
    Data and Calculation exactly10 ml of Oral Suspension was taken for the assay. Polarogram of this dilution measured 12.45 cm. A polarogram of a reference standard solution containing 0.06 mg/ml measured 12 cm. Calculate the mg of Nitrofurantoin in the final dilution of Oral Suspension. 1) Determine the amount (mg) of Nitrofurantoin in the final dilution. Cu = = = 0.0622 mg/ml 2) Determine the volume in ml of the Oral Suspension in the final dilution. 10 : 100 = X : 3 0.3 : 25 = X : 1 X = 0.3 ml X = 0.012 ml (Cs) (cmu) cms 0.06 mg/ml x 12.45 12
  • 19.
    3) The amountof Nitrofurantoin in 100 ml of Oral Suspension is: 0.0622 : 0.012 = X : 100 X = 518 mg
  • 20.
    PHARMACEUTICAL APPLICATIONS  Dissolvedoxygen and peroxides  Trace metals and metal –containing drugs  Antiseptics and insecticides  Vitamins  Hormones  Antibiotics  Alkaloids  Blood serum and cancer diagnosis
  • 21.
  • 22.
     Coulometric Analysis -Defined as an electroanalytical method in which the quantity of electricity consumed during an electrolysis reaction is a measure of the quantity of electroactive species being analyzed. - Objective: - To measure accurately the quantity of electricity consumed by the analyte species during the quantitative electrochemical reaction. W= Qf = M n W = weight of analyte M = molecular weight n= number of electrons involved in the electrochemical
  • 24.
     By KarlFischer  It is used to determine the amount of water in a sample.  It can determine concentrations of water on the order of milligrams per liter.  It is used to find the amount of water in substances such as butter, sugar, cheese, paper, and petroleum.