Downloaded 523 times
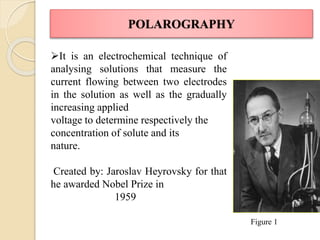
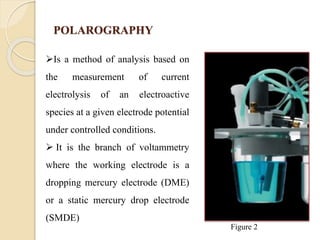
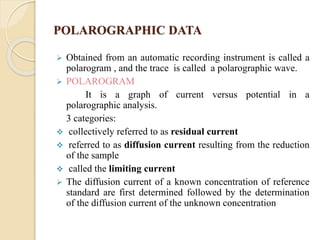
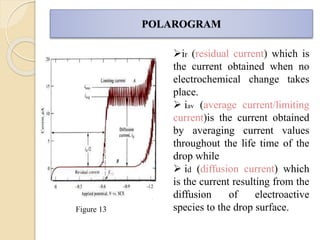
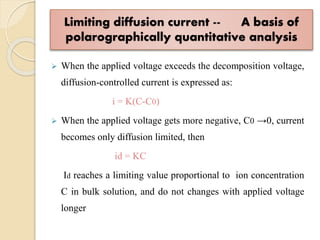
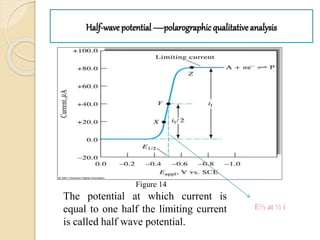
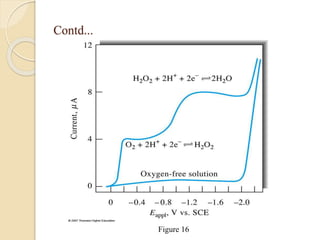


Polarography is an electroanalytical technique that uses a dropping mercury electrode to determine the concentration and nature of substances in a solution. It involves measuring the current between two electrodes - a polarized indicator electrode made of mercury, and a non-polarized reference electrode - as the voltage is gradually increased. The current readings form a polarogram curve that can identify substances based on their half-wave potential and determine concentrations from the limiting diffusion current. Polarography finds applications in fields like water quality testing, medicine, and electrochemistry.


![Polarography[1]](https://cdn.slidesharecdn.com/ss_thumbnails/polarography1-210816031327-thumbnail.jpg?width=640&height=640&fit=bounds)


![POLARGRAY_by_Shabnam_Faiz,_R.No_06[1].pptx](https://cdn.slidesharecdn.com/ss_thumbnails/polargraybyshabnamfaizr-220606070420-1e408d1d-thumbnail.jpg?width=640&height=640&fit=bounds)


