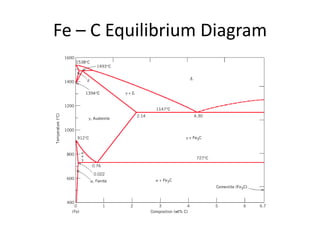
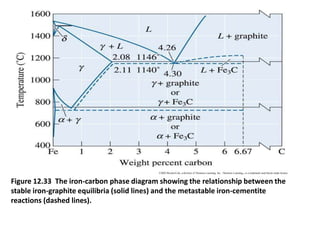
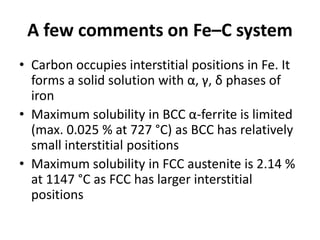
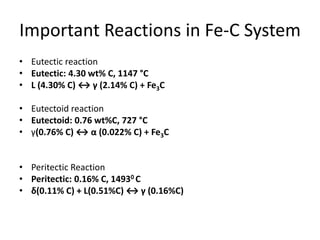
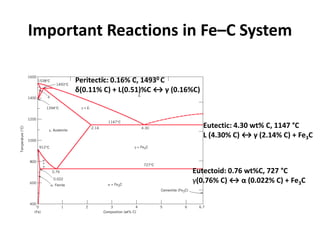
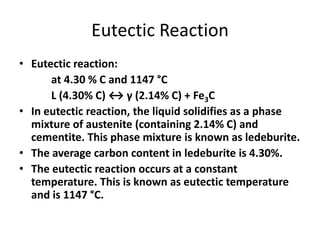
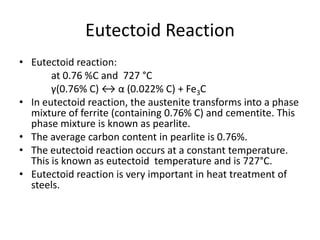
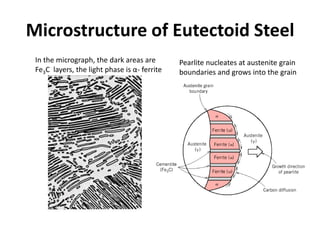
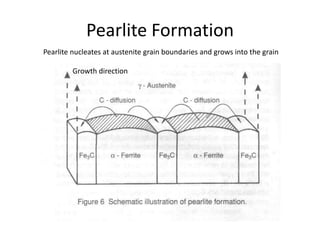
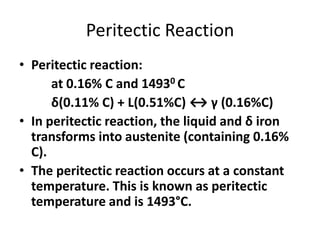
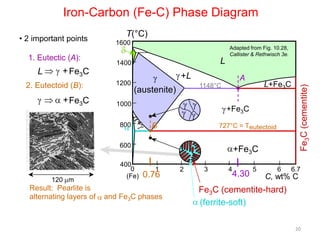
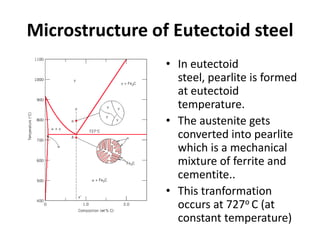
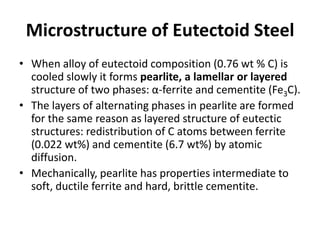
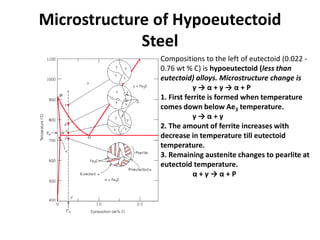
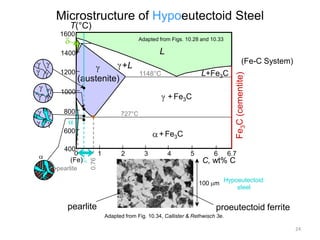
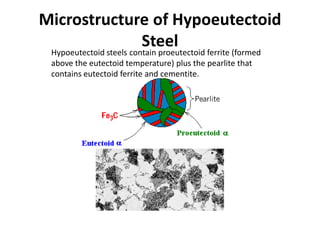
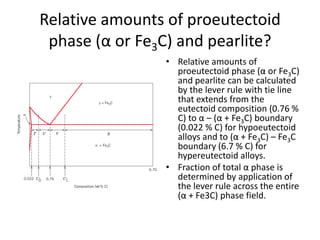
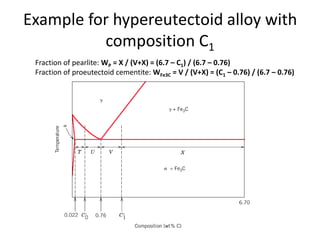
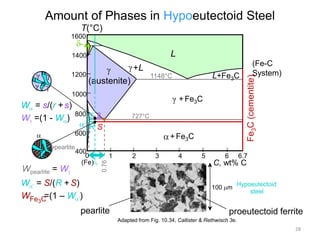
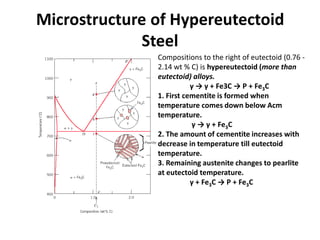
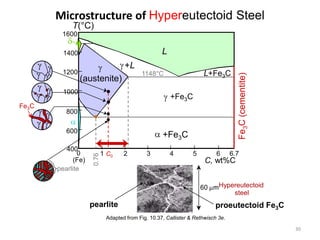
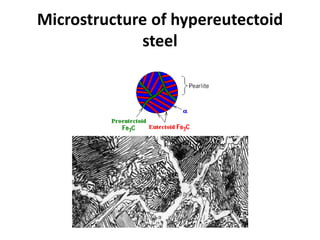
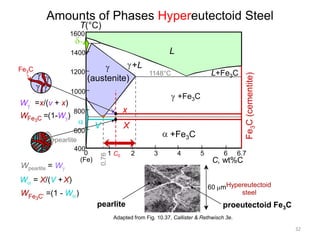
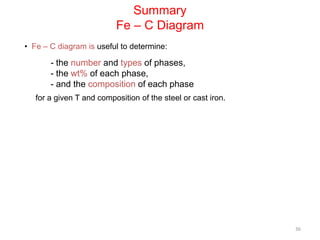
The document discusses the iron-carbon phase diagram. It describes three important reactions:
1) The eutectic reaction occurs at 4.3% carbon and 1,147°C, where liquid transforms to austenite and cementite.
2) The eutectoid reaction occurs at 0.76% carbon and 727°C, where austenite transforms to ferrite and cementite to form pearlite.
3) The peritectic reaction occurs at 0.16% carbon and 1,493°C, where liquid and delta-ferrite transform to austenite.
The phase diagram is used to explain the microstructures that form in steels with different carbon
Iron – Carbon Diagram is also known as Iron – Carbon Phase Diagram or Iron – Carbon Equilibrium diagram or Iron – Iron Carbide diagram or Fe-Fe3C diagram
phase transition (or phase change) is most commonly used to describe transitions between solid, liquid and gaseous states of matter, and, in rare cases, plasma.
The iron-carbon diagram (also called the iron-carbon phase or equilibrium diagram) is a graphic representation of the respective microstructure states depending on temperature (y axis) and carbon content (x axis).
Mumbai University.
Mechanical Engineering
SEM III
Material Technology
MOdule 2.2
Theory of Alloys& Alloys Diagrams :
Significance of alloying, Definition, Classification and properties of different types of alloys, Solidification of pure metal, Different types of phase diagrams (Isomorphous, Eutectic,
08
University of Mumbai, B. E. (Mechanical Engineering), Rev 2016 19
Peritectic, Eutectoid, Peritectoid) and their analysis, Importance of Iron as engineering material, Allotropic forms of Iron, Influence of carbon in Iron- Carbon alloying Iron-Iron carbide diagram and its analysis
JMeter webinar - integration with InfluxDB and GrafanaRTTS
Watch this recorded webinar about real-time monitoring of application performance. See how to integrate Apache JMeter, the open-source leader in performance testing, with InfluxDB, the open-source time-series database, and Grafana, the open-source analytics and visualization application.
In this webinar, we will review the benefits of leveraging InfluxDB and Grafana when executing load tests and demonstrate how these tools are used to visualize performance metrics.
Length: 30 minutes
Session Overview
-------------------------------------------
During this webinar, we will cover the following topics while demonstrating the integrations of JMeter, InfluxDB and Grafana:
- What out-of-the-box solutions are available for real-time monitoring JMeter tests?
- What are the benefits of integrating InfluxDB and Grafana into the load testing stack?
- Which features are provided by Grafana?
- Demonstration of InfluxDB and Grafana using a practice web application
To view the webinar recording, go to:
https://www.rttsweb.com/jmeter-integration-webinar
Elevating Tactical DDD Patterns Through Object CalisthenicsDorra BARTAGUIZ
After immersing yourself in the blue book and its red counterpart, attending DDD-focused conferences, and applying tactical patterns, you're left with a crucial question: How do I ensure my design is effective? Tactical patterns within Domain-Driven Design (DDD) serve as guiding principles for creating clear and manageable domain models. However, achieving success with these patterns requires additional guidance. Interestingly, we've observed that a set of constraints initially designed for training purposes remarkably aligns with effective pattern implementation, offering a more ‘mechanical’ approach. Let's explore together how Object Calisthenics can elevate the design of your tactical DDD patterns, offering concrete help for those venturing into DDD for the first time!
Accelerate your Kubernetes clusters with Varnish CachingThijs Feryn
A presentation about the usage and availability of Varnish on Kubernetes. This talk explores the capabilities of Varnish caching and shows how to use the Varnish Helm chart to deploy it to Kubernetes.
This presentation was delivered at K8SUG Singapore. See https://feryn.eu/presentations/accelerate-your-kubernetes-clusters-with-varnish-caching-k8sug-singapore-28-2024 for more details.
UiPath Test Automation using UiPath Test Suite series, part 4DianaGray10
Welcome to UiPath Test Automation using UiPath Test Suite series part 4. In this session, we will cover Test Manager overview along with SAP heatmap.
The UiPath Test Manager overview with SAP heatmap webinar offers a concise yet comprehensive exploration of the role of a Test Manager within SAP environments, coupled with the utilization of heatmaps for effective testing strategies.
Participants will gain insights into the responsibilities, challenges, and best practices associated with test management in SAP projects. Additionally, the webinar delves into the significance of heatmaps as a visual aid for identifying testing priorities, areas of risk, and resource allocation within SAP landscapes. Through this session, attendees can expect to enhance their understanding of test management principles while learning practical approaches to optimize testing processes in SAP environments using heatmap visualization techniques
What will you get from this session?
1. Insights into SAP testing best practices
2. Heatmap utilization for testing
3. Optimization of testing processes
4. Demo
Topics covered:
Execution from the test manager
Orchestrator execution result
Defect reporting
SAP heatmap example with demo
Speaker:
Deepak Rai, Automation Practice Lead, Boundaryless Group and UiPath MVP
DevOps and Testing slides at DASA ConnectKari Kakkonen
My and Rik Marselis slides at 30.5.2024 DASA Connect conference. We discuss about what is testing, then what is agile testing and finally what is Testing in DevOps. Finally we had lovely workshop with the participants trying to find out different ways to think about quality and testing in different parts of the DevOps infinity loop.
Securing your Kubernetes cluster_ a step-by-step guide to success !KatiaHIMEUR1
Today, after several years of existence, an extremely active community and an ultra-dynamic ecosystem, Kubernetes has established itself as the de facto standard in container orchestration. Thanks to a wide range of managed services, it has never been so easy to set up a ready-to-use Kubernetes cluster.
However, this ease of use means that the subject of security in Kubernetes is often left for later, or even neglected. This exposes companies to significant risks.
In this talk, I'll show you step-by-step how to secure your Kubernetes cluster for greater peace of mind and reliability.
GDG Cloud Southlake #33: Boule & Rebala: Effective AppSec in SDLC using Deplo...James Anderson
Effective Application Security in Software Delivery lifecycle using Deployment Firewall and DBOM
The modern software delivery process (or the CI/CD process) includes many tools, distributed teams, open-source code, and cloud platforms. Constant focus on speed to release software to market, along with the traditional slow and manual security checks has caused gaps in continuous security as an important piece in the software supply chain. Today organizations feel more susceptible to external and internal cyber threats due to the vast attack surface in their applications supply chain and the lack of end-to-end governance and risk management.
The software team must secure its software delivery process to avoid vulnerability and security breaches. This needs to be achieved with existing tool chains and without extensive rework of the delivery processes. This talk will present strategies and techniques for providing visibility into the true risk of the existing vulnerabilities, preventing the introduction of security issues in the software, resolving vulnerabilities in production environments quickly, and capturing the deployment bill of materials (DBOM).
Speakers:
Bob Boule
Robert Boule is a technology enthusiast with PASSION for technology and making things work along with a knack for helping others understand how things work. He comes with around 20 years of solution engineering experience in application security, software continuous delivery, and SaaS platforms. He is known for his dynamic presentations in CI/CD and application security integrated in software delivery lifecycle.
Gopinath Rebala
Gopinath Rebala is the CTO of OpsMx, where he has overall responsibility for the machine learning and data processing architectures for Secure Software Delivery. Gopi also has a strong connection with our customers, leading design and architecture for strategic implementations. Gopi is a frequent speaker and well-known leader in continuous delivery and integrating security into software delivery.
Epistemic Interaction - tuning interfaces to provide information for AI supportAlan Dix
Paper presented at SYNERGY workshop at AVI 2024, Genoa, Italy. 3rd June 2024
https://alandix.com/academic/papers/synergy2024-epistemic/
As machine learning integrates deeper into human-computer interactions, the concept of epistemic interaction emerges, aiming to refine these interactions to enhance system adaptability. This approach encourages minor, intentional adjustments in user behaviour to enrich the data available for system learning. This paper introduces epistemic interaction within the context of human-system communication, illustrating how deliberate interaction design can improve system understanding and adaptation. Through concrete examples, we demonstrate the potential of epistemic interaction to significantly advance human-computer interaction by leveraging intuitive human communication strategies to inform system design and functionality, offering a novel pathway for enriching user-system engagements.
Encryption in Microsoft 365 - ExpertsLive Netherlands 2024Albert Hoitingh
In this session I delve into the encryption technology used in Microsoft 365 and Microsoft Purview. Including the concepts of Customer Key and Double Key Encryption.
Builder.ai Founder Sachin Dev Duggal's Strategic Approach to Create an Innova...Ramesh Iyer
In today's fast-changing business world, Companies that adapt and embrace new ideas often need help to keep up with the competition. However, fostering a culture of innovation takes much work. It takes vision, leadership and willingness to take risks in the right proportion. Sachin Dev Duggal, co-founder of Builder.ai, has perfected the art of this balance, creating a company culture where creativity and growth are nurtured at each stage.
Monitoring Java Application Security with JDK Tools and JFR Events
Fe-C diagram
1. The Iron–Carbon Phase Diagram
Prof. H. K. Khaira
Professor in MSME Deptt.
MANIT, Bhopal
2. Iron–Carbon Phase Diagram
• In their simplest form, steels are alloys of Iron
(Fe) and Carbon (C).
• The Fe-C phase diagram is a fairly complex
one, but we will only consider the steel and
cast iron part of the diagram, up to 6.67%
Carbon.
6. Phases Observed in Fe-C Diagram
1. Ferrite
Ferrite is the interstitial solid solution of carbon in alpha iron. It has B.C.C.
Structure. It has very limited solubility for carbon (maximum 0.022% at 727°C
and 0.008% at room temperature). Ferrite is soft and ductile.
2. Austenite
Austenite is the interstitial solid solution of carbon in gamma (γ) iron. It has
FCC structure. Austenite can have maximum 2.14% carbon at 1143°C.
Austenite is normally not stable at room temperature. Austenite is nonmagnetic and soft.
3. Cementite
Cementite or iron carbide (Fe3C) is an intermetallic compound of iron and
carbon. It contains 6.67% carbon. It is very hard and brittle. This intermetallic
compound is a metastable phase and it remains as a compound indefinitely at
room temperature.
4. δ-ferrite
It is a solid solution of carbon in δ-iron. It is stable at high temperatures. It has
BCC structure.
7. Phase Mixtures Observed in Fe-C
Diagram
• 1. Pearlite
The pearlite consists of alternate layers of ferrite
and cementite. It has properties somewhere
between ferrite and cementite. The average
carbon content in pearlite is 0.76%
• 2. Ledeburite
Ledeburite is an eutetcic mixture of austenite and
cementite in the form of alternate layers. The
average carbon content in ledeburite is 4.3%.
8. A few comments on Fe–C system
• Carbon occupies interstitial positions in Fe. It
forms a solid solution with α, γ, δ phases of
iron
• Maximum solubility in BCC α-ferrite is limited
(max. 0.025 % at 727 °C) as BCC has relatively
small interstitial positions
• Maximum solubility in FCC austenite is 2.14 %
at 1147 °C as FCC has larger interstitial
positions
9. A few comments on Fe–C system
• Mechanical properties
– Cementite is very hard and brittle - can strengthen
steels.
– Mechanical properties depend on the
microstructure, that is, amount and distribution of
ferrite and cementite.
• Magnetic properties: α -ferrite is magnetic
below 768 °C, austenite is non-magnetic
10. Fe-C Alloys
• Fe-C alloys can be of two types.
1. Steels
Steels are alloys of iron and carbon containing up
to 2.14% C. Other alloying elements may also be
present in steels.
2. Cast irons
Cast irons are alloys of iron and carbon
containing more than 2.14% C. Other alloying
elements may also be present in cast irons.
11. Important Reactions in Fe-C System
• There are three important reactions taking
place in Fe-C system
1. Eutectic reaction
2. Eutectoid reaction
3. Peritectic Reaction
12. Important Reactions in Fe-C System
• Eutectic reaction
• Eutectic: 4.30 wt% C, 1147 °C
• L (4.30% C) ↔ γ (2.14% C) + Fe3C
• Eutectoid reaction
• Eutectoid: 0.76 wt%C, 727 °C
• γ(0.76% C) ↔ α (0.022% C) + Fe3C
• Peritectic Reaction
• Peritectic: 0.16% C, 14930 C
• δ(0.11% C) + L(0.51%C) ↔ γ (0.16%C)
13. Important Reactions in Fe–C System
Peritectic: 0.16% C, 14930 C
δ(0.11% C) + L(0.51)%C ↔ γ (0.16%C)
Eutectic: 4.30 wt% C, 1147 °C
L (4.30% C) ↔ γ (2.14% C) + Fe3C
Eutectoid: 0.76 wt%C, 727 °C
γ(0.76% C) ↔ α (0.022% C) + Fe3C
14. Eutectic Reaction
• Eutectic reaction:
at 4.30 % C and 1147 °C
L (4.30% C) ↔ γ (2.14% C) + Fe3C
• In eutectic reaction, the liquid solidifies as a phase
mixture of austenite (containing 2.14% C) and
cementite. This phase mixture is known as ledeburite.
• The average carbon content in ledeburite is 4.30%.
• The eutectic reaction occurs at a constant
temperature. This is known as eutectic temperature
and is 1147 °C.
15. Eutectoid Reaction
• Eutectoid reaction:
at 0.76 %C and 727 °C
γ(0.76% C) ↔ α (0.022% C) + Fe3C
• In eutectoid reaction, the austenite transforms into a phase
mixture of ferrite (containing 0.76% C) and cementite. This
phase mixture is known as pearlite.
• The average carbon content in pearlite is 0.76%.
• The eutectoid reaction occurs at a constant temperature.
This is known as eutectoid temperature and is 727°C.
• Eutectoid reaction is very important in heat treatment of
steels.
16. Microstructure of Eutectoid Steel
In the micrograph, the dark areas are
Fe3C layers, the light phase is α- ferrite
Pearlite nucleates at austenite grain
boundaries and grows into the grain
18. Peritectic Reaction
• Peritectic reaction:
at 0.16% C and 14930 C
δ(0.11% C) + L(0.51%C) ↔ γ (0.16%C)
• In peritectic reaction, the liquid and δ iron
transforms into austenite (containing 0.16%
C).
• The peritectic reaction occurs at a constant
temperature. This is known as peritectic
temperature and is 1493°C.
20. Iron-Carbon (Fe-C) Phase Diagram
1. Eutectic (A):
L
T(°C)
1600
Adapted from Fig. 10.28,
Callister & Rethwisch 3e.
L
1400
+ Fe3C
2. Eutectoid (B):
+ Fe3C
1200
+L
AA
(austenite)
1000
800
+Fe3C
B
727°C = T eutectoid
600
120 m
Result: Pearlite is
alternating layers of
400
0
(Fe)
L+Fe3C
1148°C
Fe3C (cementite)
• 2 important points
+Fe3C
1
0.76
and Fe3C phases
2
3
4
4.30
5
6
6.7
C, wt% C
Fe3C (cementite-hard)
(ferrite-soft)
20
21. Microstructure of Eutectoid steel
• In eutectoid
steel, pearlite is formed
at eutectoid
temperature.
• The austenite gets
converted into pearlite
which is a mechanical
mixture of ferrite and
cementite..
• This tranformation
occurs at 727o C (at
constant temperature)
22. Microstructure of Eutectoid Steel
• When alloy of eutectoid composition (0.76 wt % C) is
cooled slowly it forms pearlite, a lamellar or layered
structure of two phases: α-ferrite and cementite (Fe3C).
• The layers of alternating phases in pearlite are formed
for the same reason as layered structure of eutectic
structures: redistribution of C atoms between ferrite
(0.022 wt%) and cementite (6.7 wt%) by atomic
diffusion.
• Mechanically, pearlite has properties intermediate to
soft, ductile ferrite and hard, brittle cementite.
23. Microstructure of Hypoeutectoid
Steel
Compositions to the left of eutectoid (0.022 0.76 wt % C) is hypoeutectoid (less than
eutectoid) alloys. Microstructure change is
γ→α+γ→α+P
1. First ferrite is formed when temperature
comes down below Ae3 temperature.
γ→α+γ
2. The amount of ferrite increases with
decrease in temperature till eutectoid
temperature.
3. Remaining austenite changes to pearlite at
eutectoid temperature.
α+γ→α+P
24. Microstructure of Hypoeutectoid Steel
T(°C)
1600
Adapted from Figs. 10.28 and 10.33
L
1400
1000
+ Fe3C
800
727°C
600
pearlite
+ Fe3C
1
0.76
400
0
(Fe)C0
L+Fe3C
1148°C
(austenite)
2
3
4
5
6
6.7
C, wt% C
100 m
pearlite
Fe3C (cementite)
1200
(Fe-C System)
+L
Hypoeutectoid
steel
proeutectoid ferrite
Adapted from Fig. 10.34, Callister & Rethwisch 3e.
24
26. Relative amounts of proeutectoid
phase (α or Fe3C) and pearlite?
• Relative amounts of
proeutectoid phase (α or Fe3C)
and pearlite can be calculated
by the lever rule with tie line
that extends from the
eutectoid composition (0.76 %
C) to α – (α + Fe3C) boundary
(0.022 % C) for hypoeutectoid
alloys and to (α + Fe3C) – Fe3C
boundary (6.7 % C) for
hypereutectoid alloys.
• Fraction of total α phase is
determined by application of
the lever rule across the entire
(α + Fe3C) phase field.
27. Example for hypereutectoid alloy with
composition C1
Fraction of pearlite: WP = X / (V+X) = (6.7 – C1) / (6.7 – 0.76)
Fraction of proeutectoid cementite: WFe3C = V / (V+X) = (C1 – 0.76) / (6.7 – 0.76)
28. Amount of Phases in Hypoeutectoid Steel
T(°C)
1600
L
1400
(austenite)
1000
800
600
pearlite
Wpearlite = W
+ Fe3C
r s
727°C
RS
400
0
(Fe)C0
+ Fe3C
1
0.76
W = s/(r + s)
W =(1 - W )
L+Fe3C
1148°C
W ’ = S/(R + S)
WFe3C
=(1 – W ’)
pearlite
2
3
4
5
6
(Fe-C
System)
Fe3C (cementite)
1200
+L
6.7
C, wt% C
100 m
Hypoeutectoid
steel
proeutectoid ferrite
Adapted from Fig. 10.34, Callister & Rethwisch 3e.
28
29. Microstructure of Hypereutectoid
Steel
Compositions to the right of eutectoid (0.76 2.14 wt % C) is hypereutectoid (more than
eutectoid) alloys.
γ → γ + Fe3C → P + Fe3C
1. First cementite is formed when
temperature comes down below Acm
temperature.
γ → γ + Fe3C
2. The amount of cementite increases with
decrease in temperature till eutectoid
temperature.
3. Remaining austenite changes to pearlite
at eutectoid temperature.
γ + Fe3C → P + Fe3C
32. Amounts of Phases Hypereutectoid Steel
T(°C)
1600
L
1400
1200
+L
1000
+Fe3C
W =x/(v + x)
v x
800
600
pearlite
400
0
(Fe)
Wpearlite = W
V
X
+Fe3C
0.76
WFe3C =(1-W )
1 C0
W = X/(V + X)
WFe
3C’
L+Fe3C
1148°C
(austenite)
2
3
4
5
6
Fe3C (cementite)
Fe3C
6.7
C, wt%C
60 mHypereutectoid
steel
=(1 - W )
pearlite
proeutectoid Fe3C
Adapted from Fig. 10.37, Callister & Rethwisch 3e.
32
33. Example Problem Steel
For a 99.6 wt% Fe-0.40 wt% C steel at a
temperature just below the eutectoid,
determine the following:
a) The compositions of Fe3C and ferrite ( ).
b) The amount of cementite (in grams) that
forms in 100 g of steel.
c) The amounts of pearlite and proeutectoid
ferrite ( ) in the 100 g.
33
34. Solution to Problem
a) Use RS tie line just below
Eutectoid
b)
Use lever rule with
the tie line shown
WFe 3C
R
R S
1600
T(°C)
1200
C0 C
CFe 3C C
0.40 0.022
6.70 0.022
L
1400
+L
1000
+ Fe3C
800
727°C
R
0.057
S
+ Fe3C
600
400
0
Amount of Fe3C in 100 g
L+Fe3C
1148°C
(austenite)
Fe3C (cementite)
C = 0.022 wt% C
CFe3C = 6.70 wt% C
C C0
1
2
3
4
C, wt% C
5
6
6.7
CFe
3C
= (100 g)WFe3C
= (100 g)(0.057) = 5.7 g
34
35. Solution to Problem
c) Using the VX tie line just above the eutectoid
and realizing that
C0 = 0.40 wt% C
C = 0.022 wt% C
Cpearlite = C = 0.76 wt% C
V X
T(°C)
C0 C
C C
0.40 0.022
0.76 0.022
L
1400
1200
+L
L+Fe3C
1148°C
(austenite)
1000
+ Fe3C
0.512
800
727°C
VX
Amount of pearlite in 100 g
= (100 g)Wpearlite
= (100 g)(0.512) = 51.2 g
600
400
0
+ Fe3C
1
C C0 C
2
3
4
5
6
Fe C (cementite)
Wpearlite
V
1600
6.7
C, wt% C
35
36. Summary
Fe – C Diagram
• Fe – C diagram is useful to determine:
- the number and types of phases,
- the wt% of each phase,
- and the composition of each phase
for a given T and composition of the steel or cast iron.
36
37. Alloying Steel With More Elements
Ti
Mo
• Ceutectoid changes:
Si
W
Cr
Mn
Ni
wt. % of alloying elements
Adapted from Fig. 10.38,Callister & Rethwisch 3e.
(Fig. 10.38 from Edgar C. Bain, Functions of the
Alloying Elements in Steel, American Society for
Metals, 1939, p. 127.)
Ceutectoid (wt% C)
T Eutectoid (°C)
• Teutectoid changes:
Ni
Cr
Si
Ti Mo
W
Mn
wt. % of alloying elements
Adapted from Fig. 10.39,Callister & Rethwisch 3e.
(Fig. 10.39 from Edgar C. Bain, Functions of the
Alloying Elements in Steel, American Society for
Metals, 1939, p. 127.)
37