Downloaded 290 times

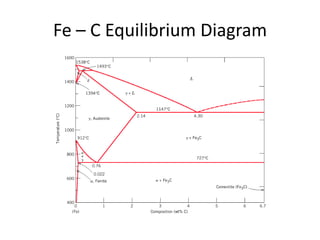
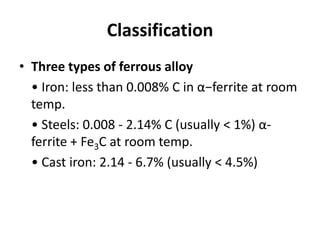
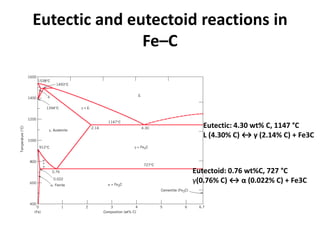

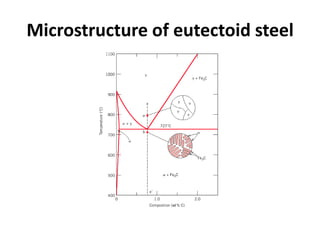
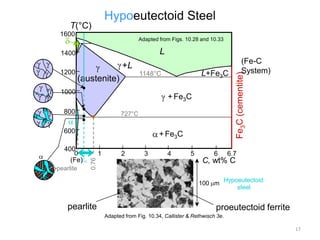
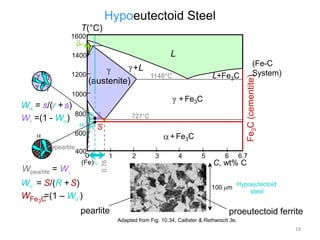
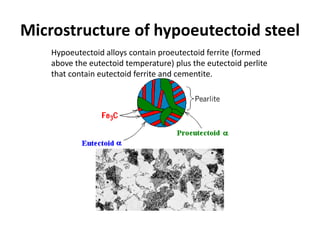
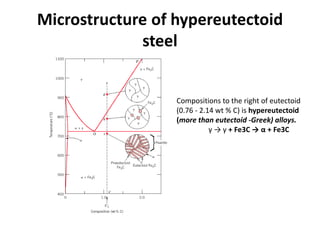
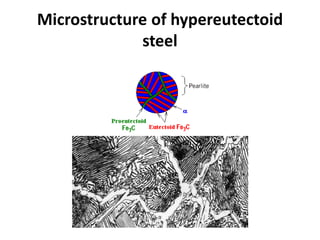
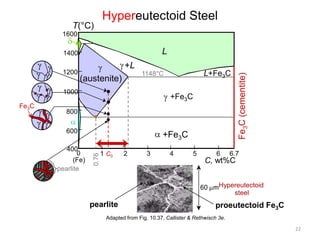
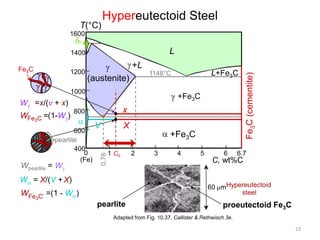
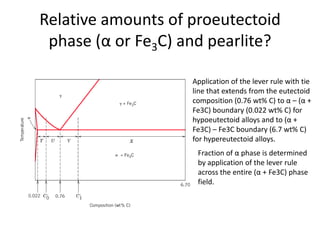
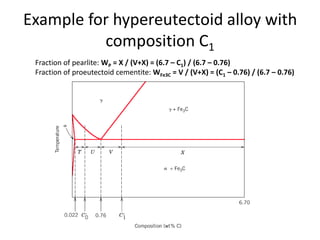
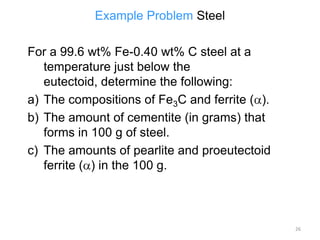
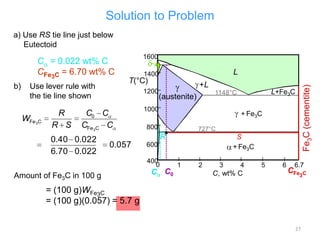
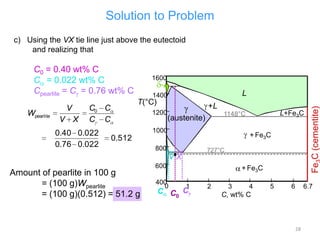


The document discusses the iron-carbon phase diagram and the microstructures that form in steels of different carbon compositions. It describes the phases in the Fe-C system including α-ferrite, γ-austenite, δ-ferrite, and Fe3C cementite. The eutectic and eutectoid reactions are identified. Microstructures that form in hypoeutectoid, eutectoid, and hypereutectoid steels upon slow cooling are discussed. These include proeutectoid ferrite or cementite plus pearlite. The lever rule is used to determine the fraction of phases. An example problem demonstrates using the phase diagram and lever rule to calculate phase compositions and