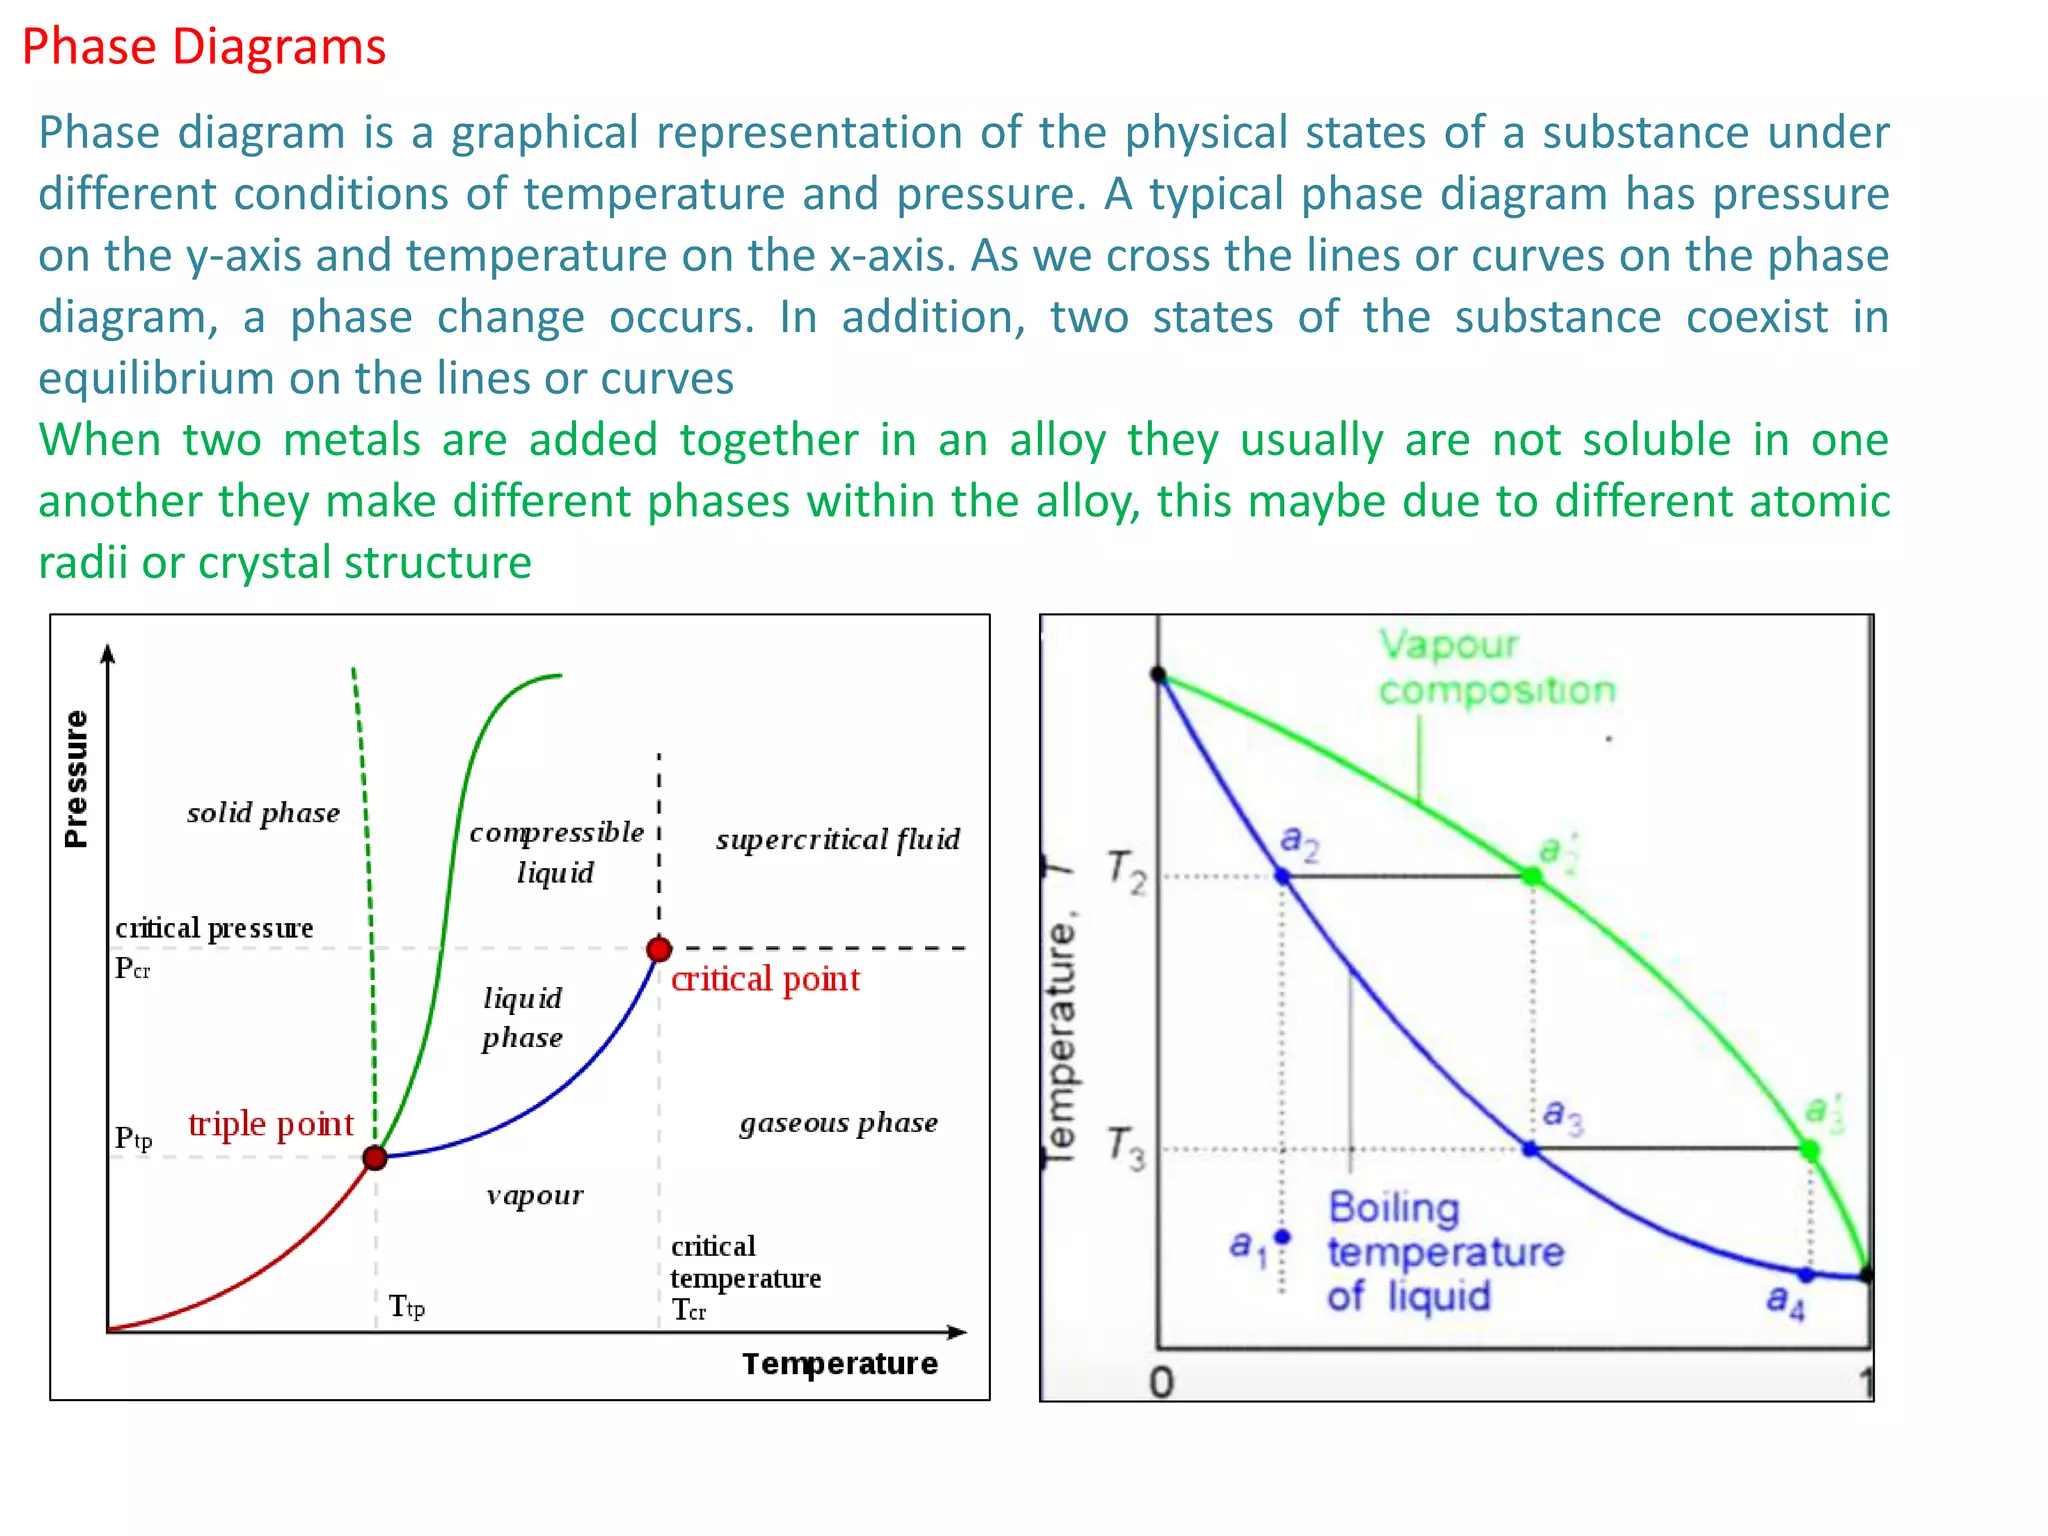
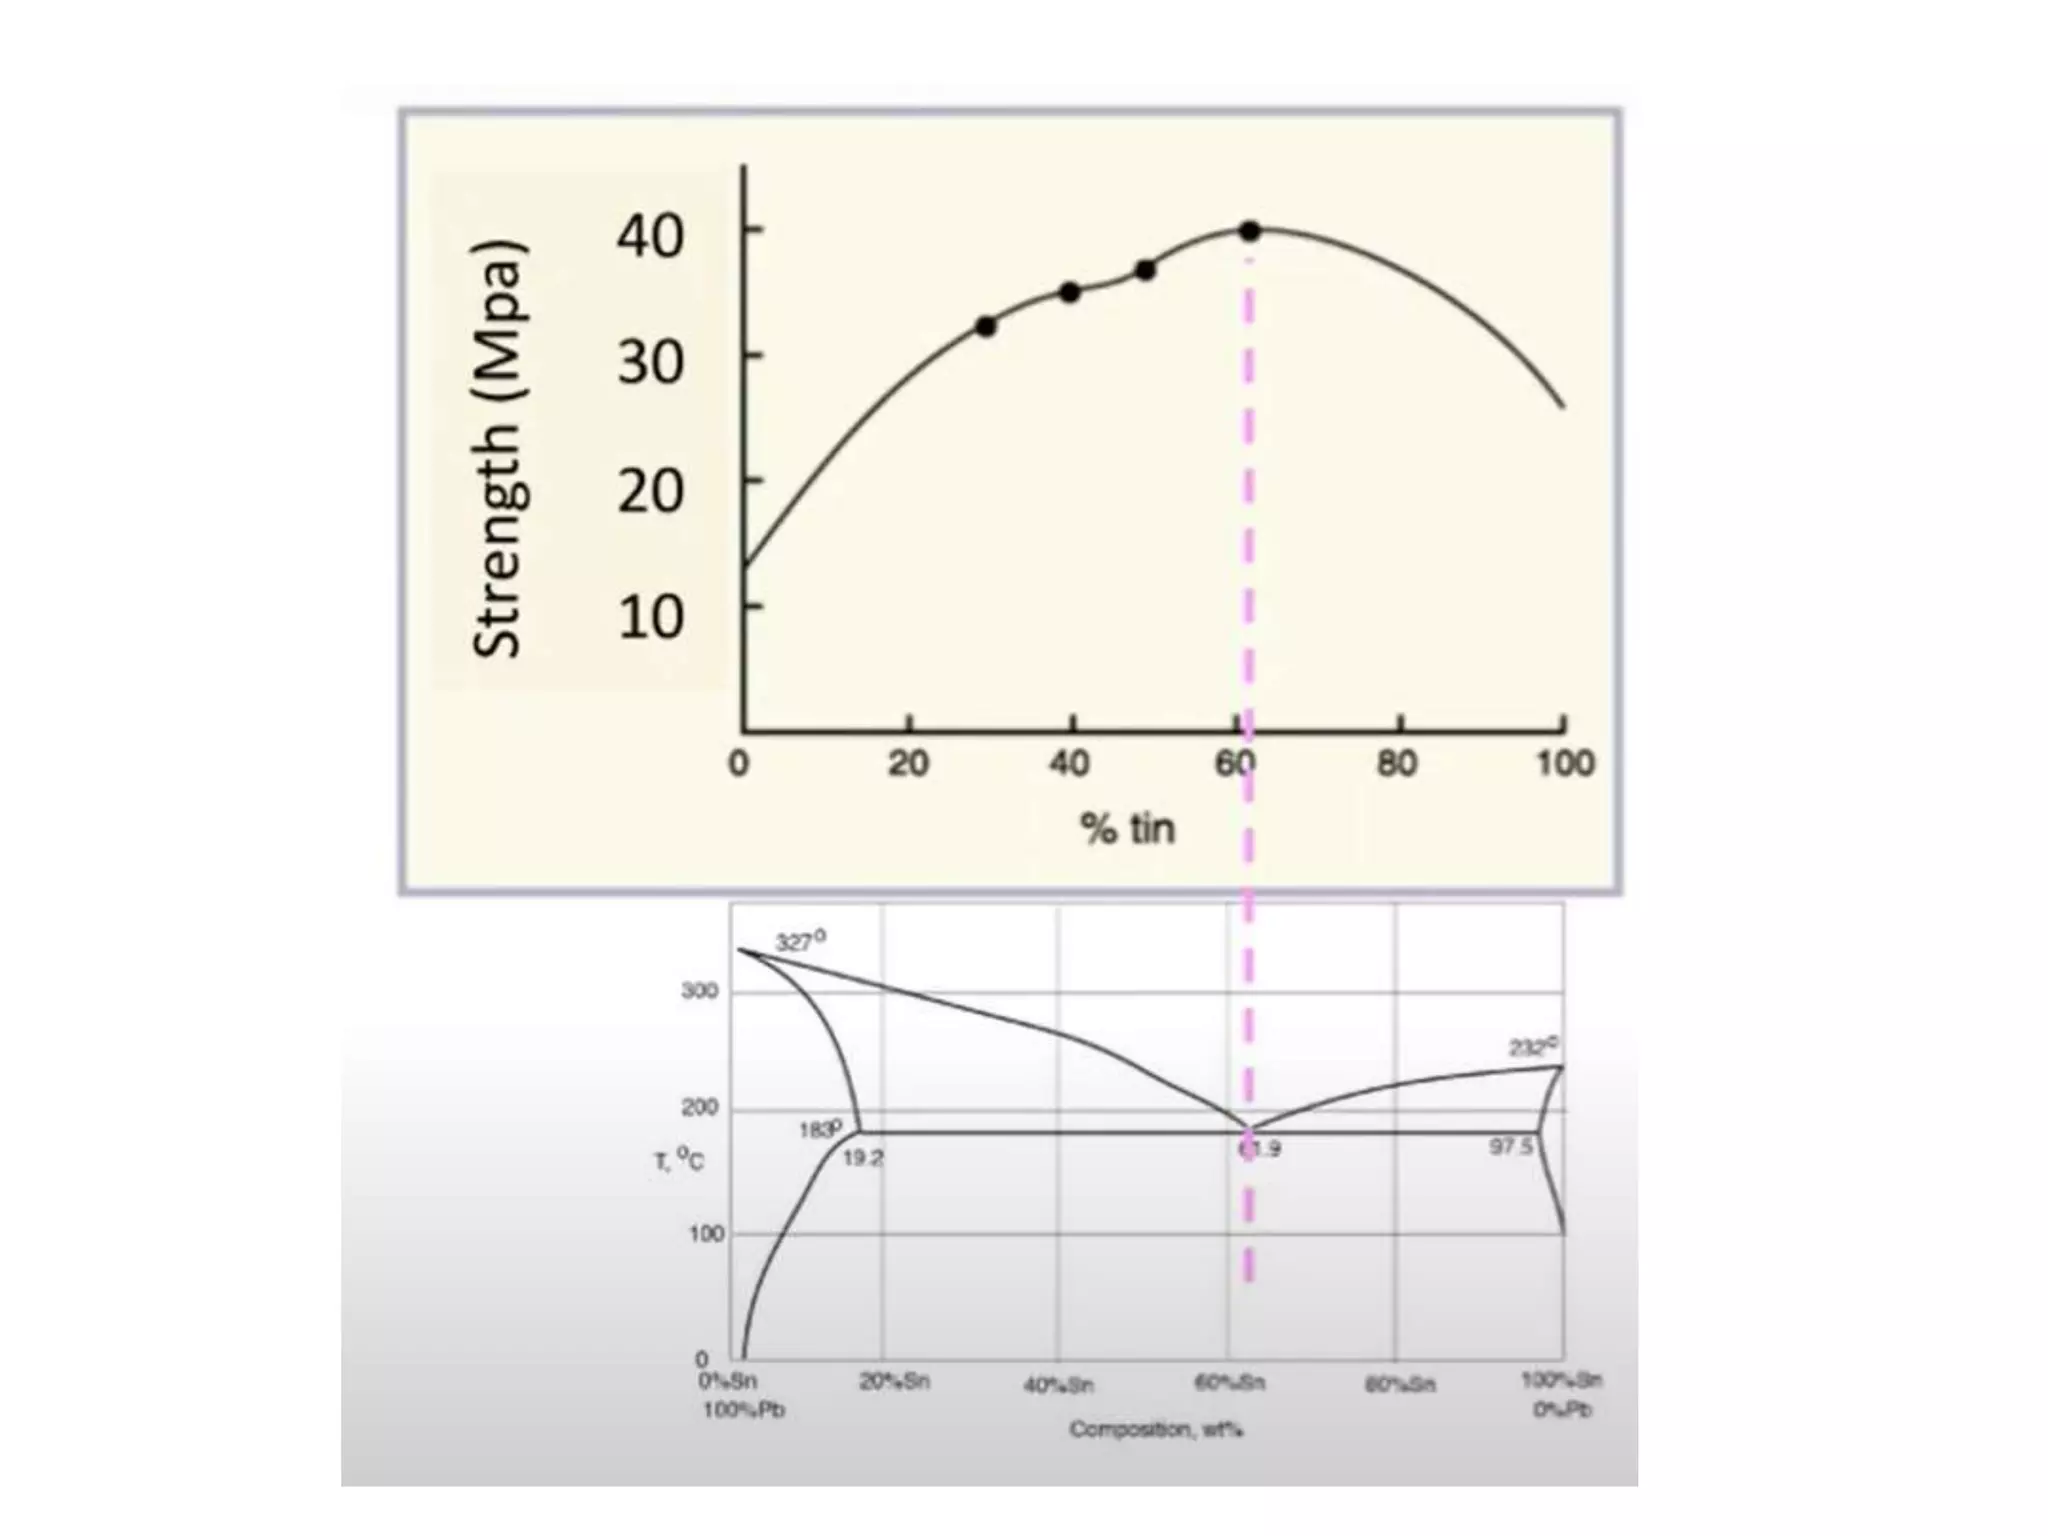
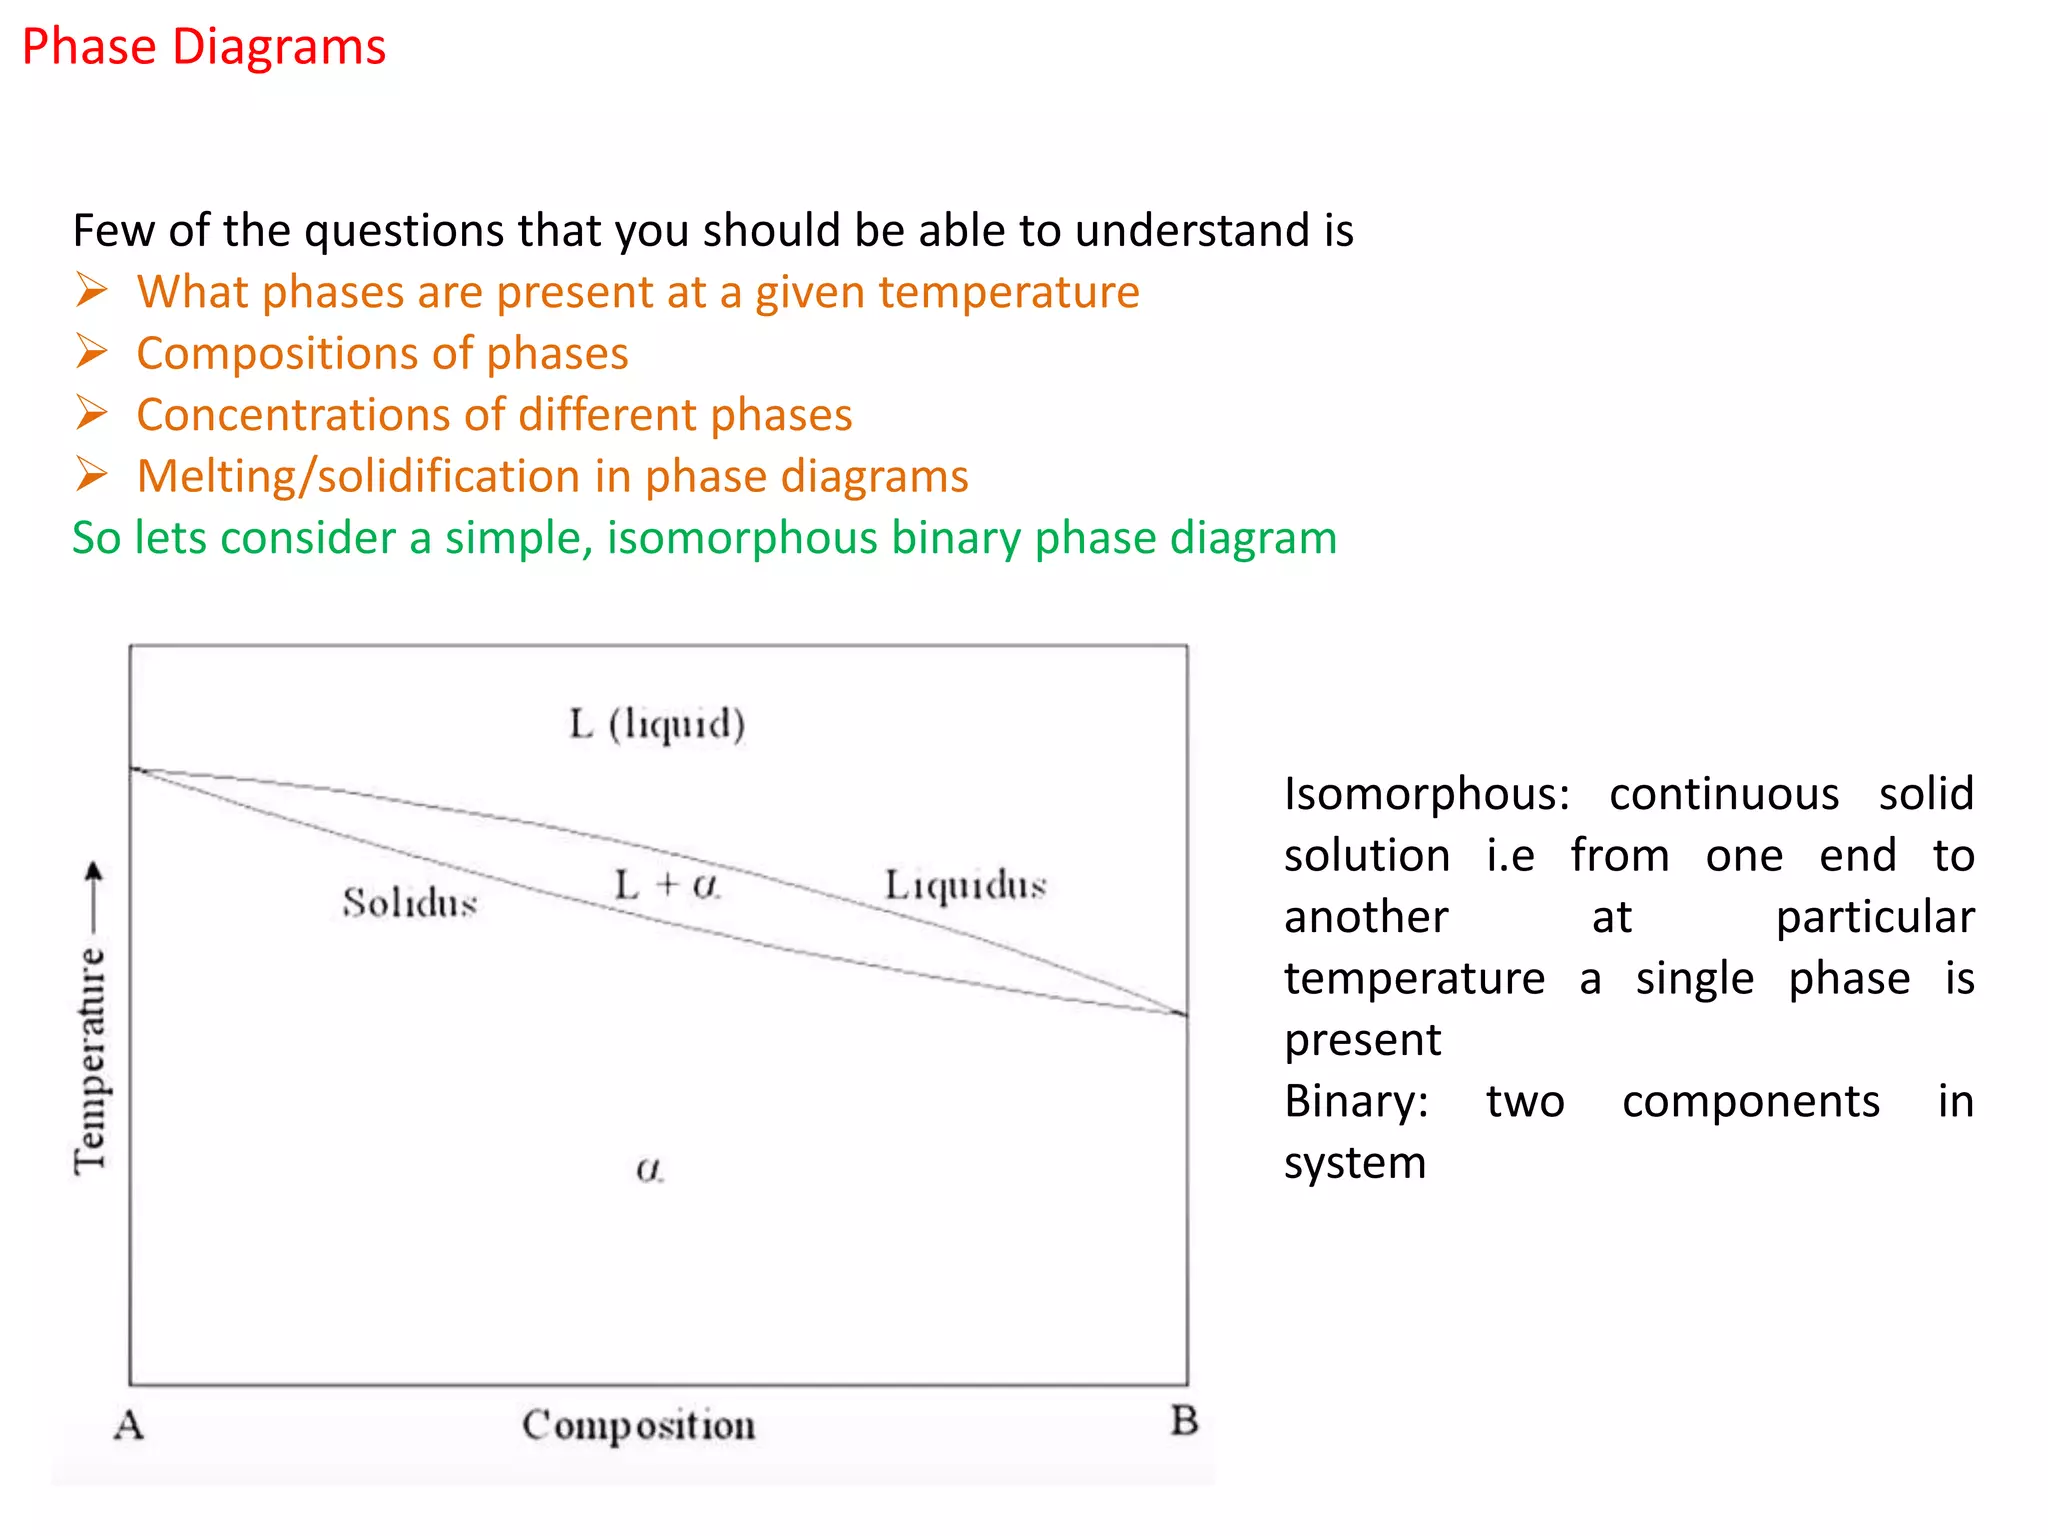
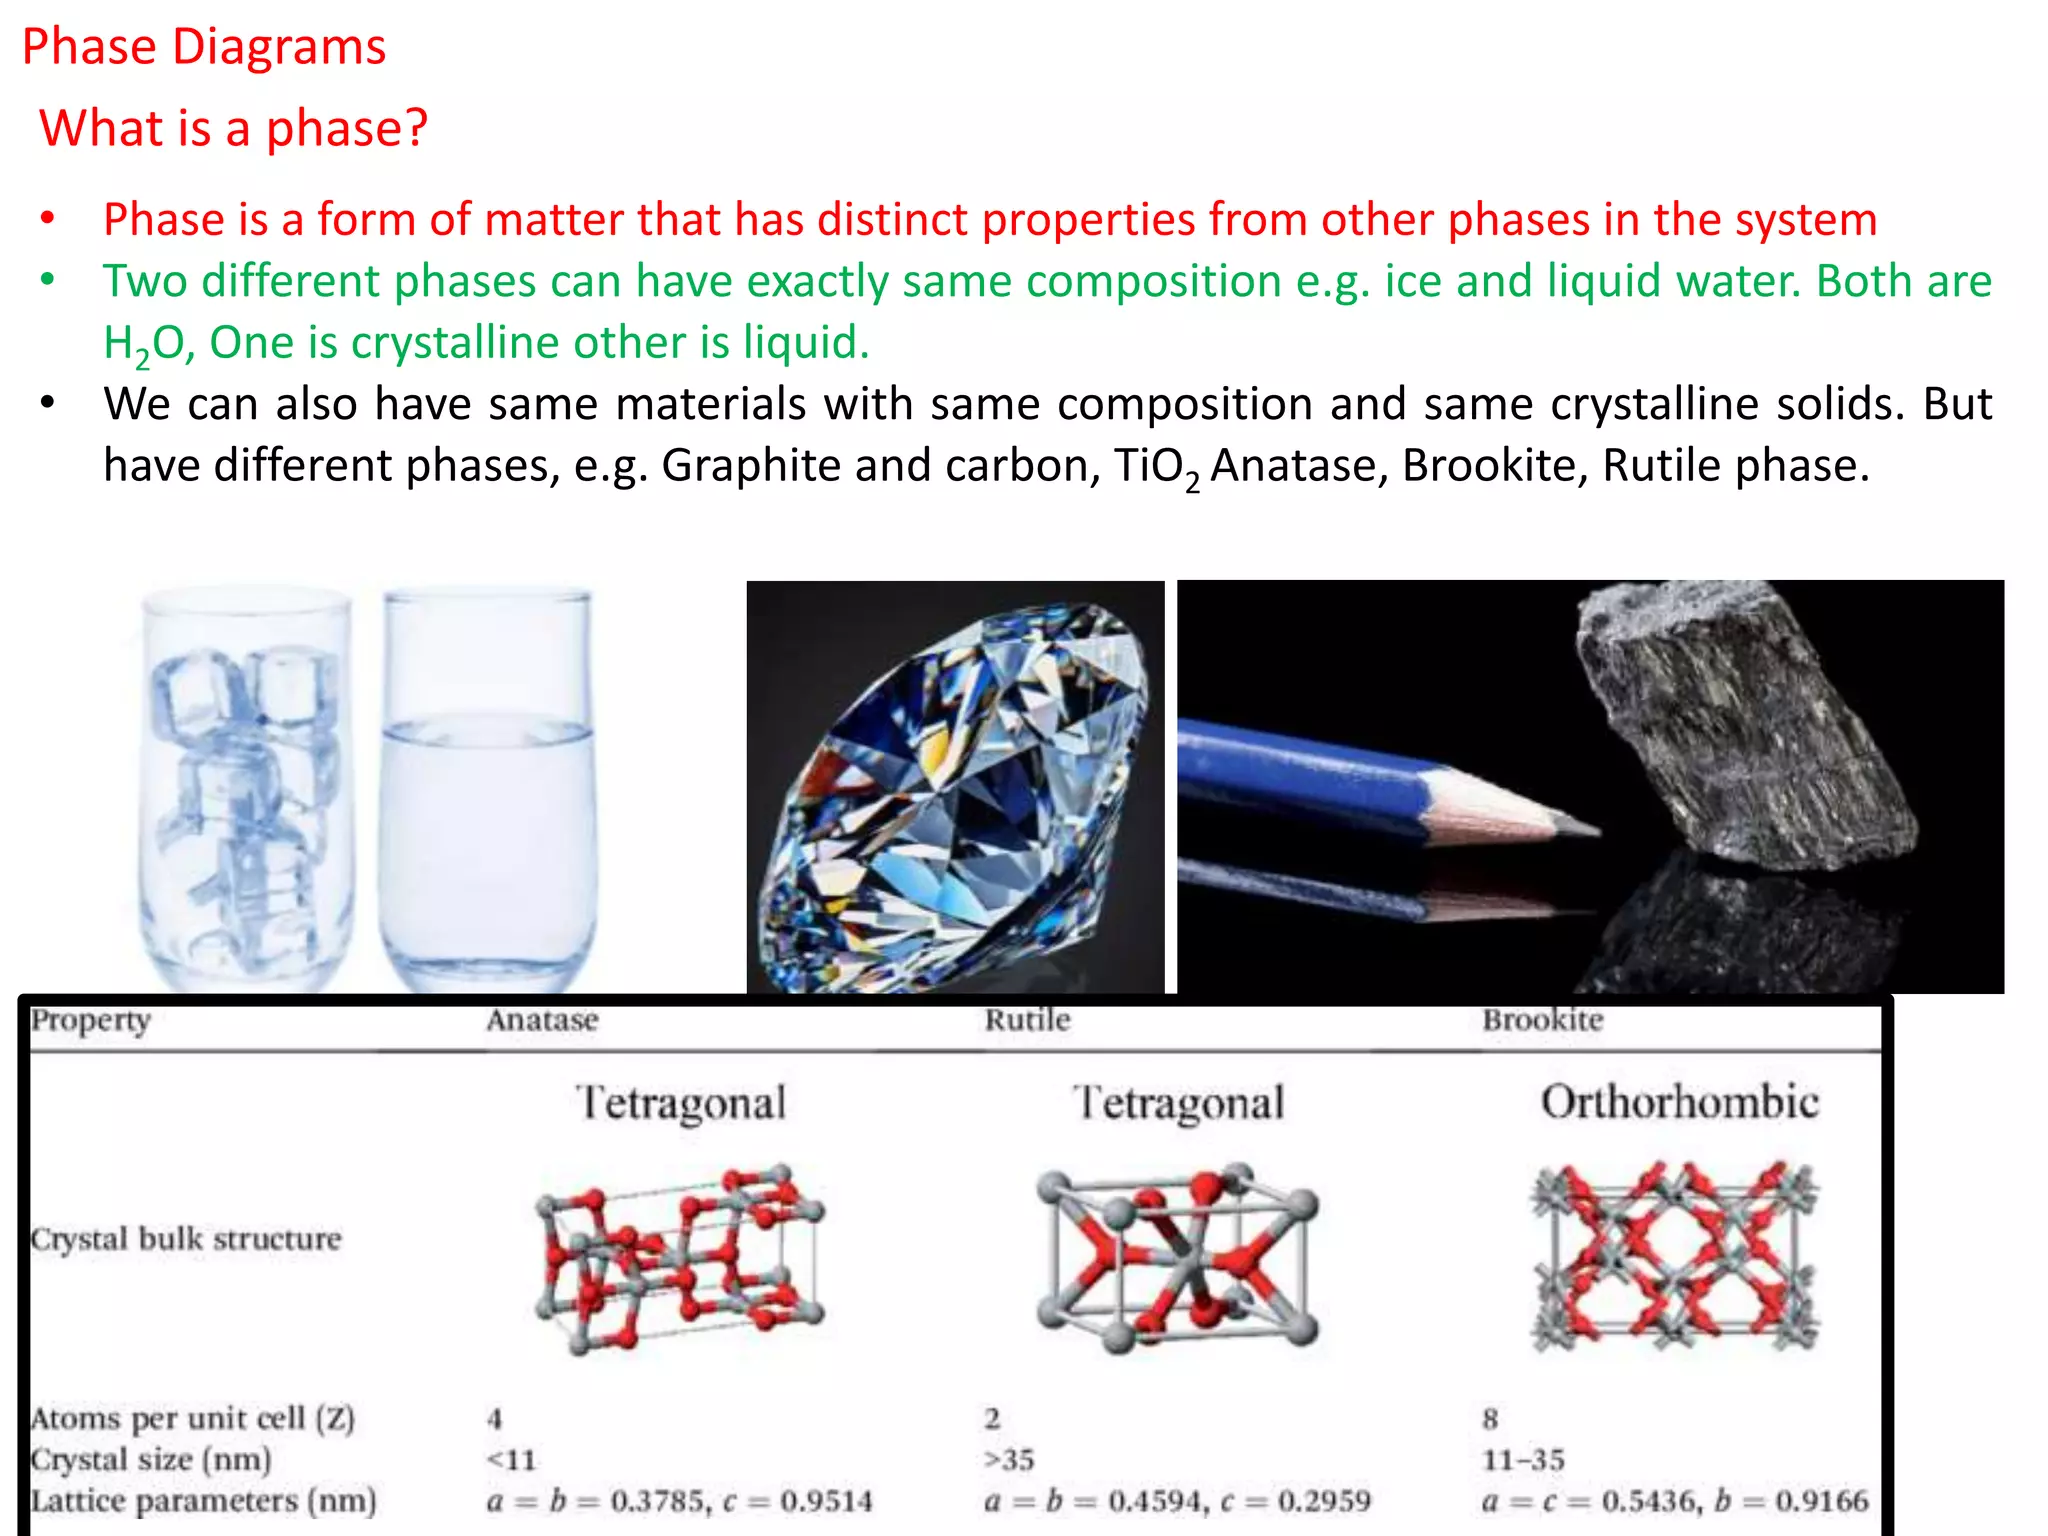
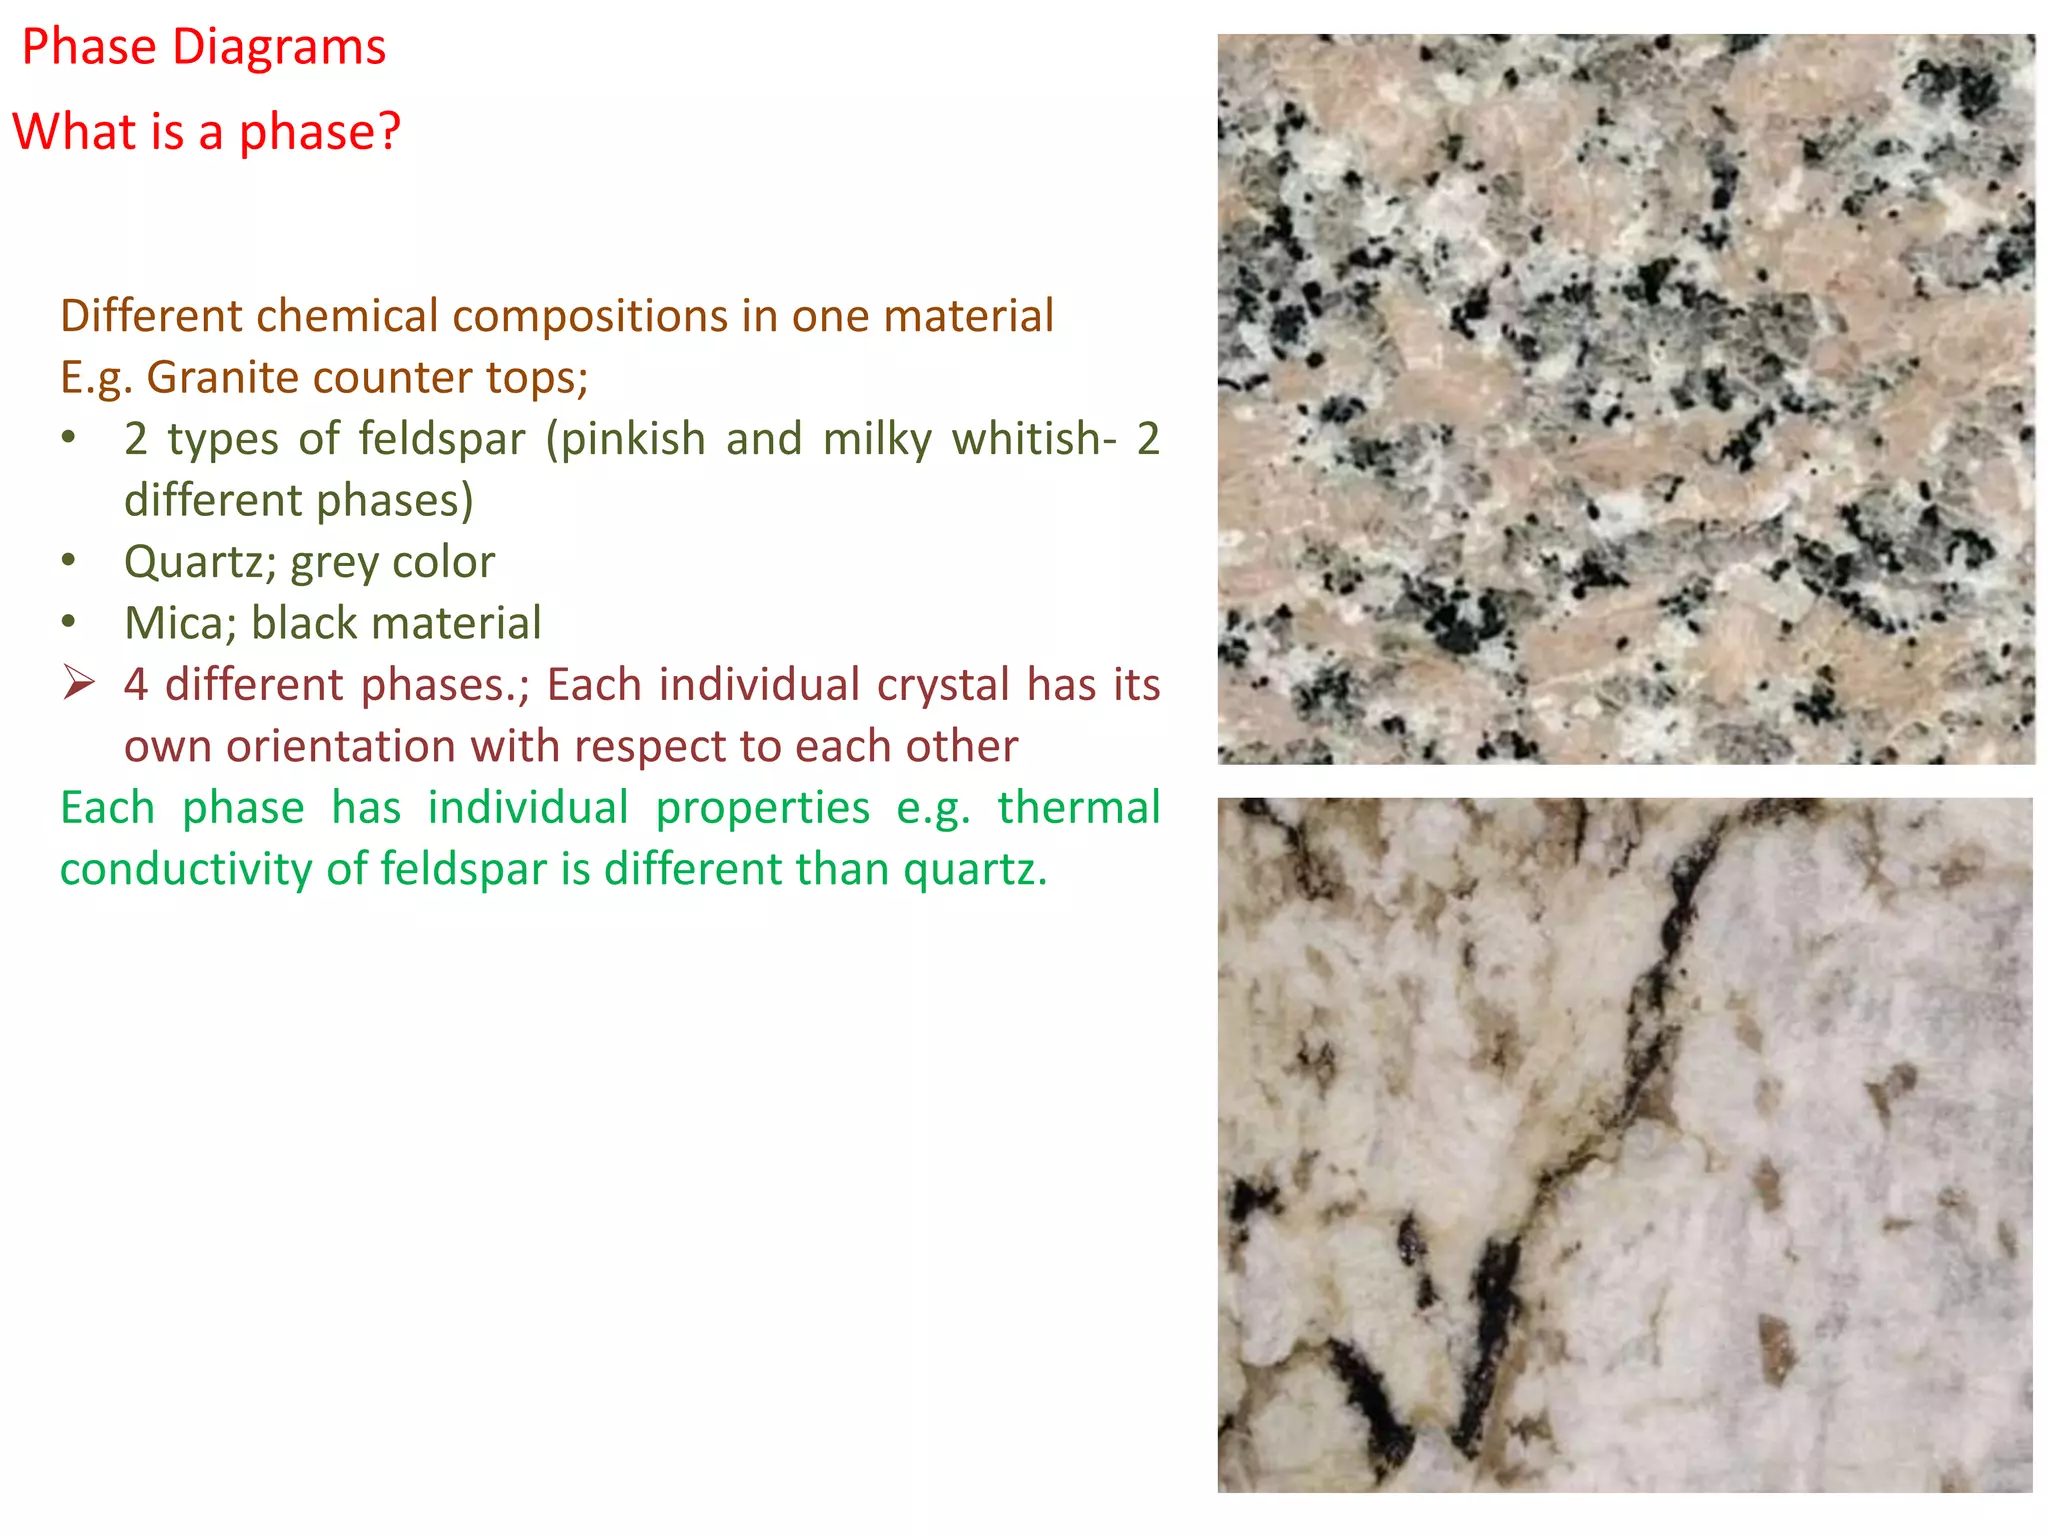
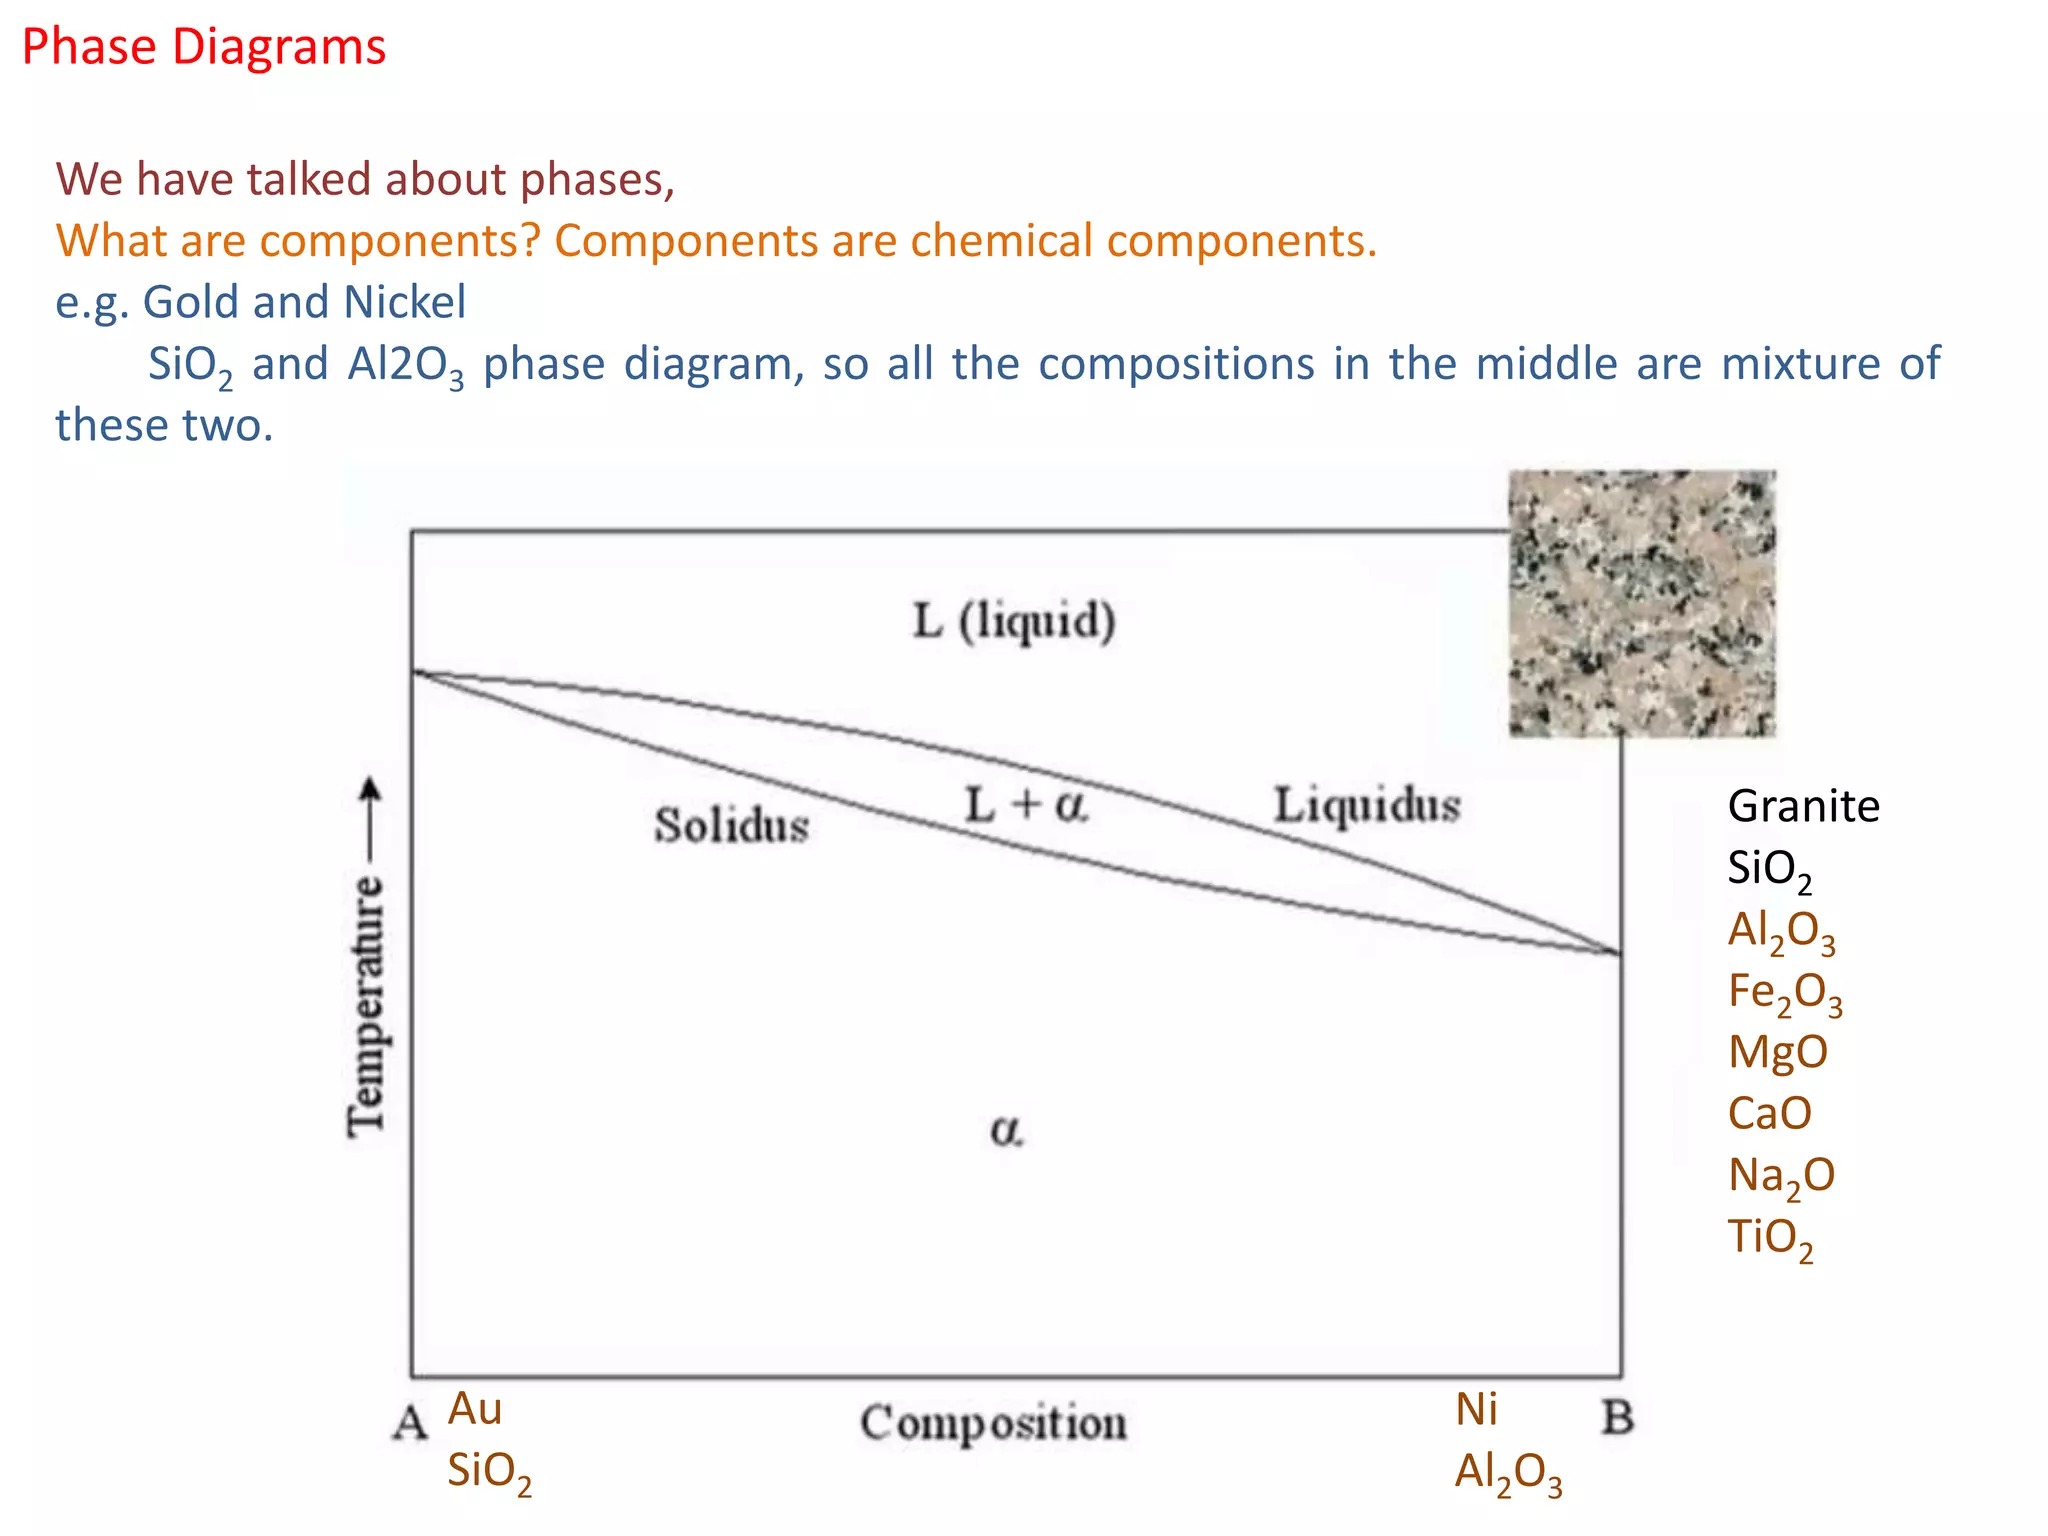
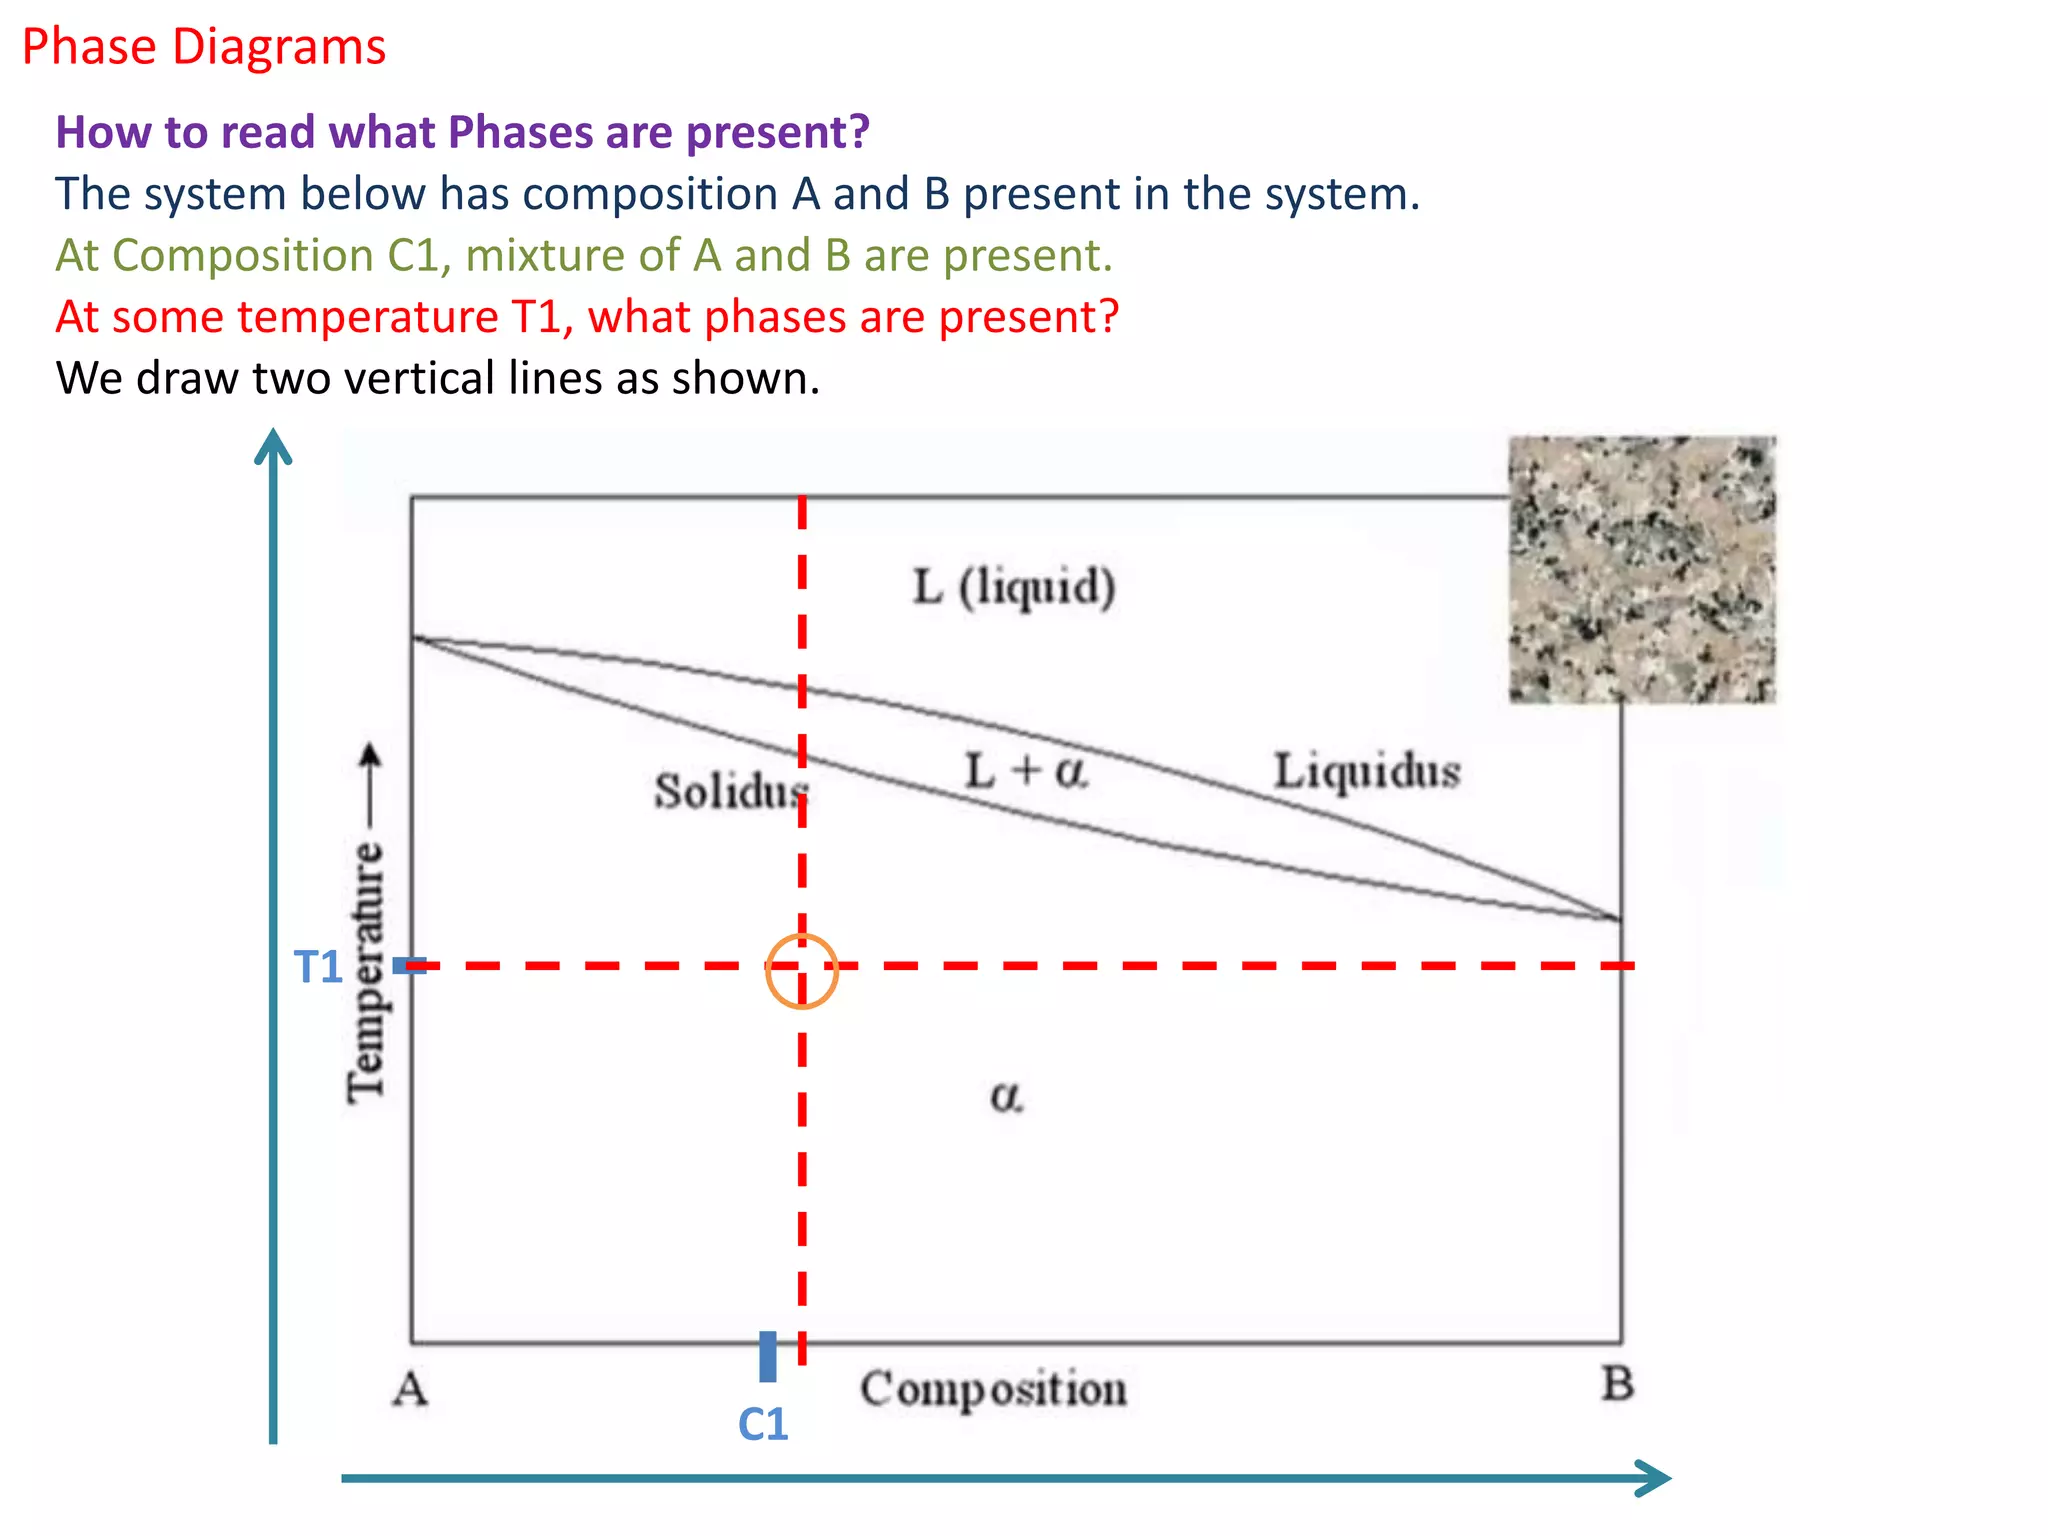
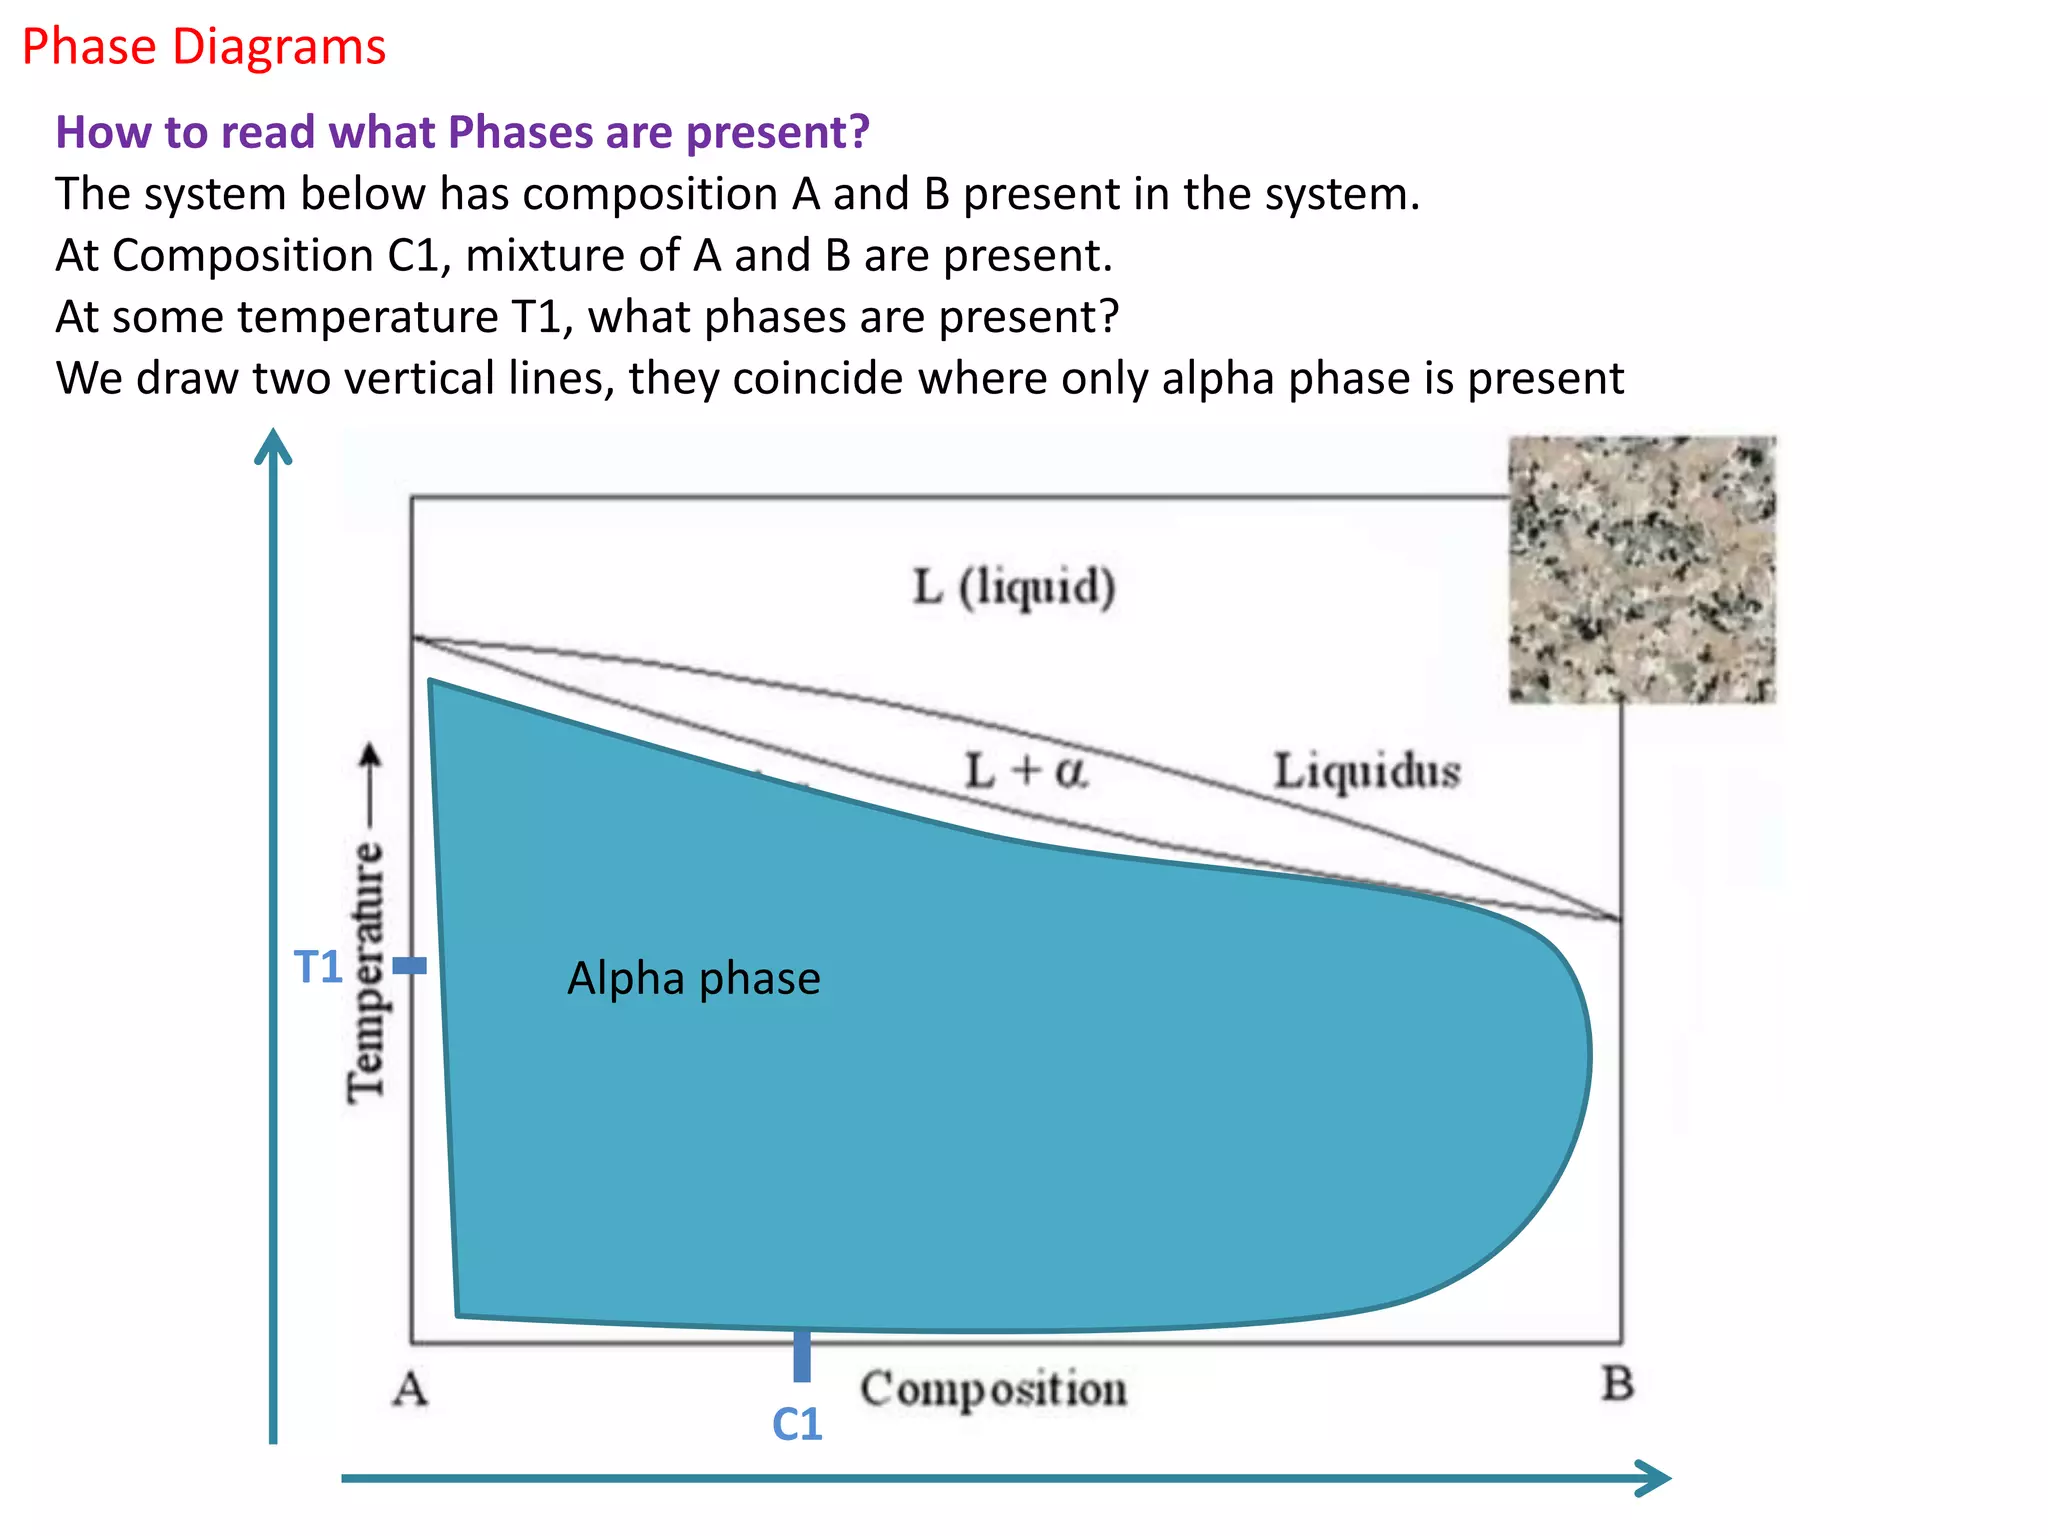
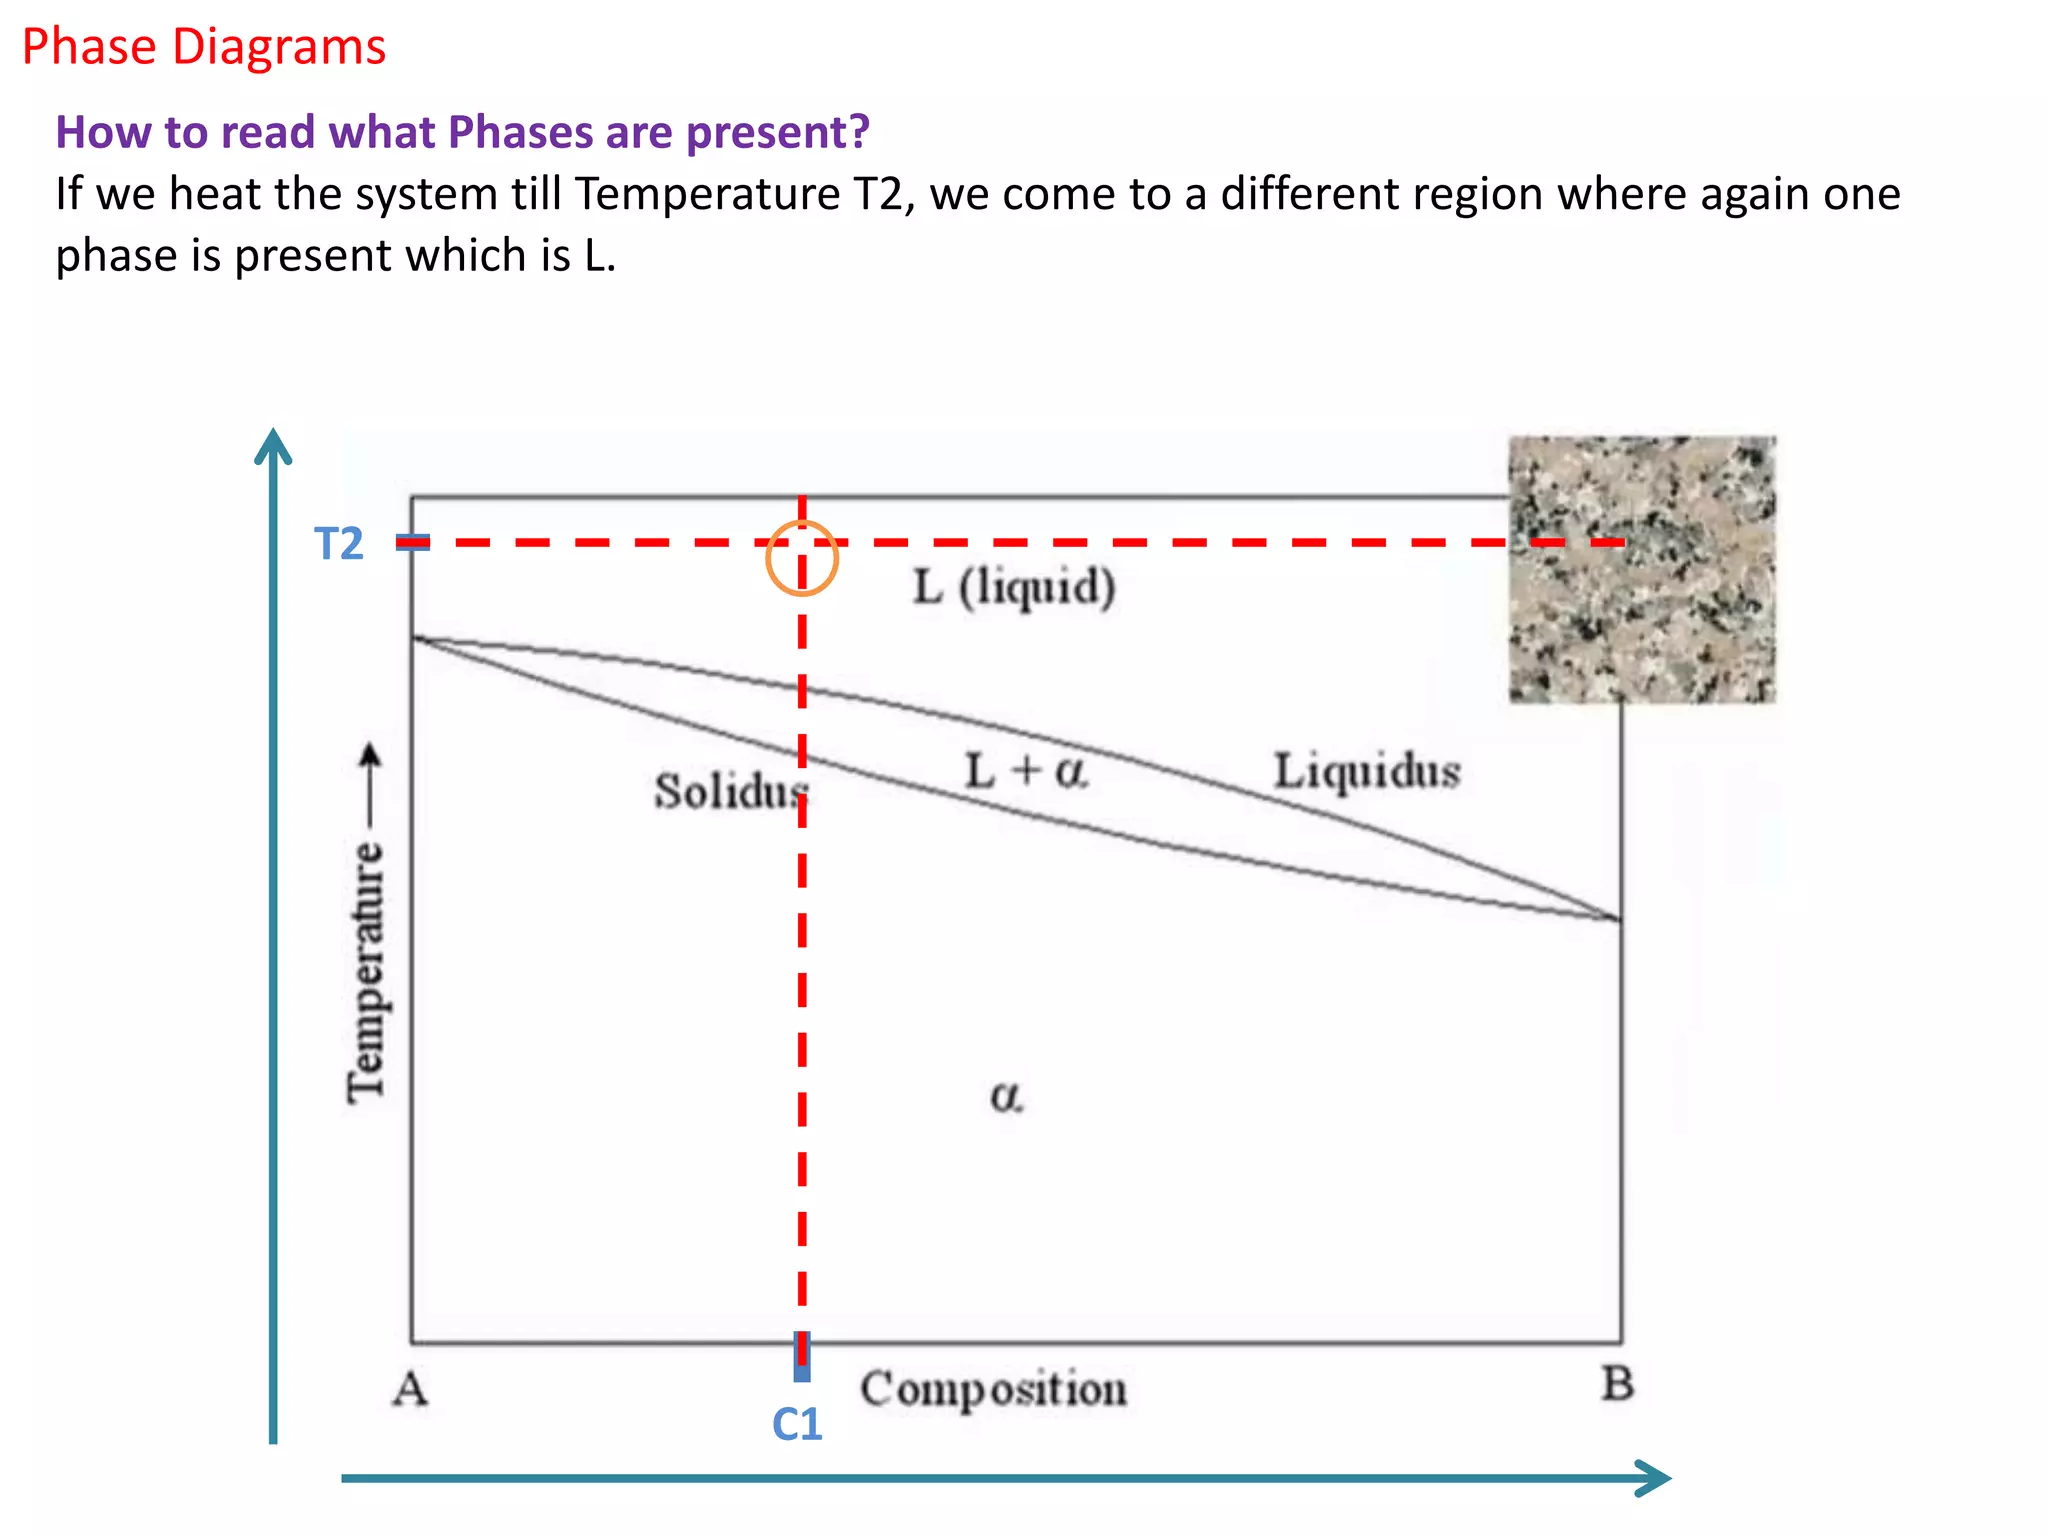
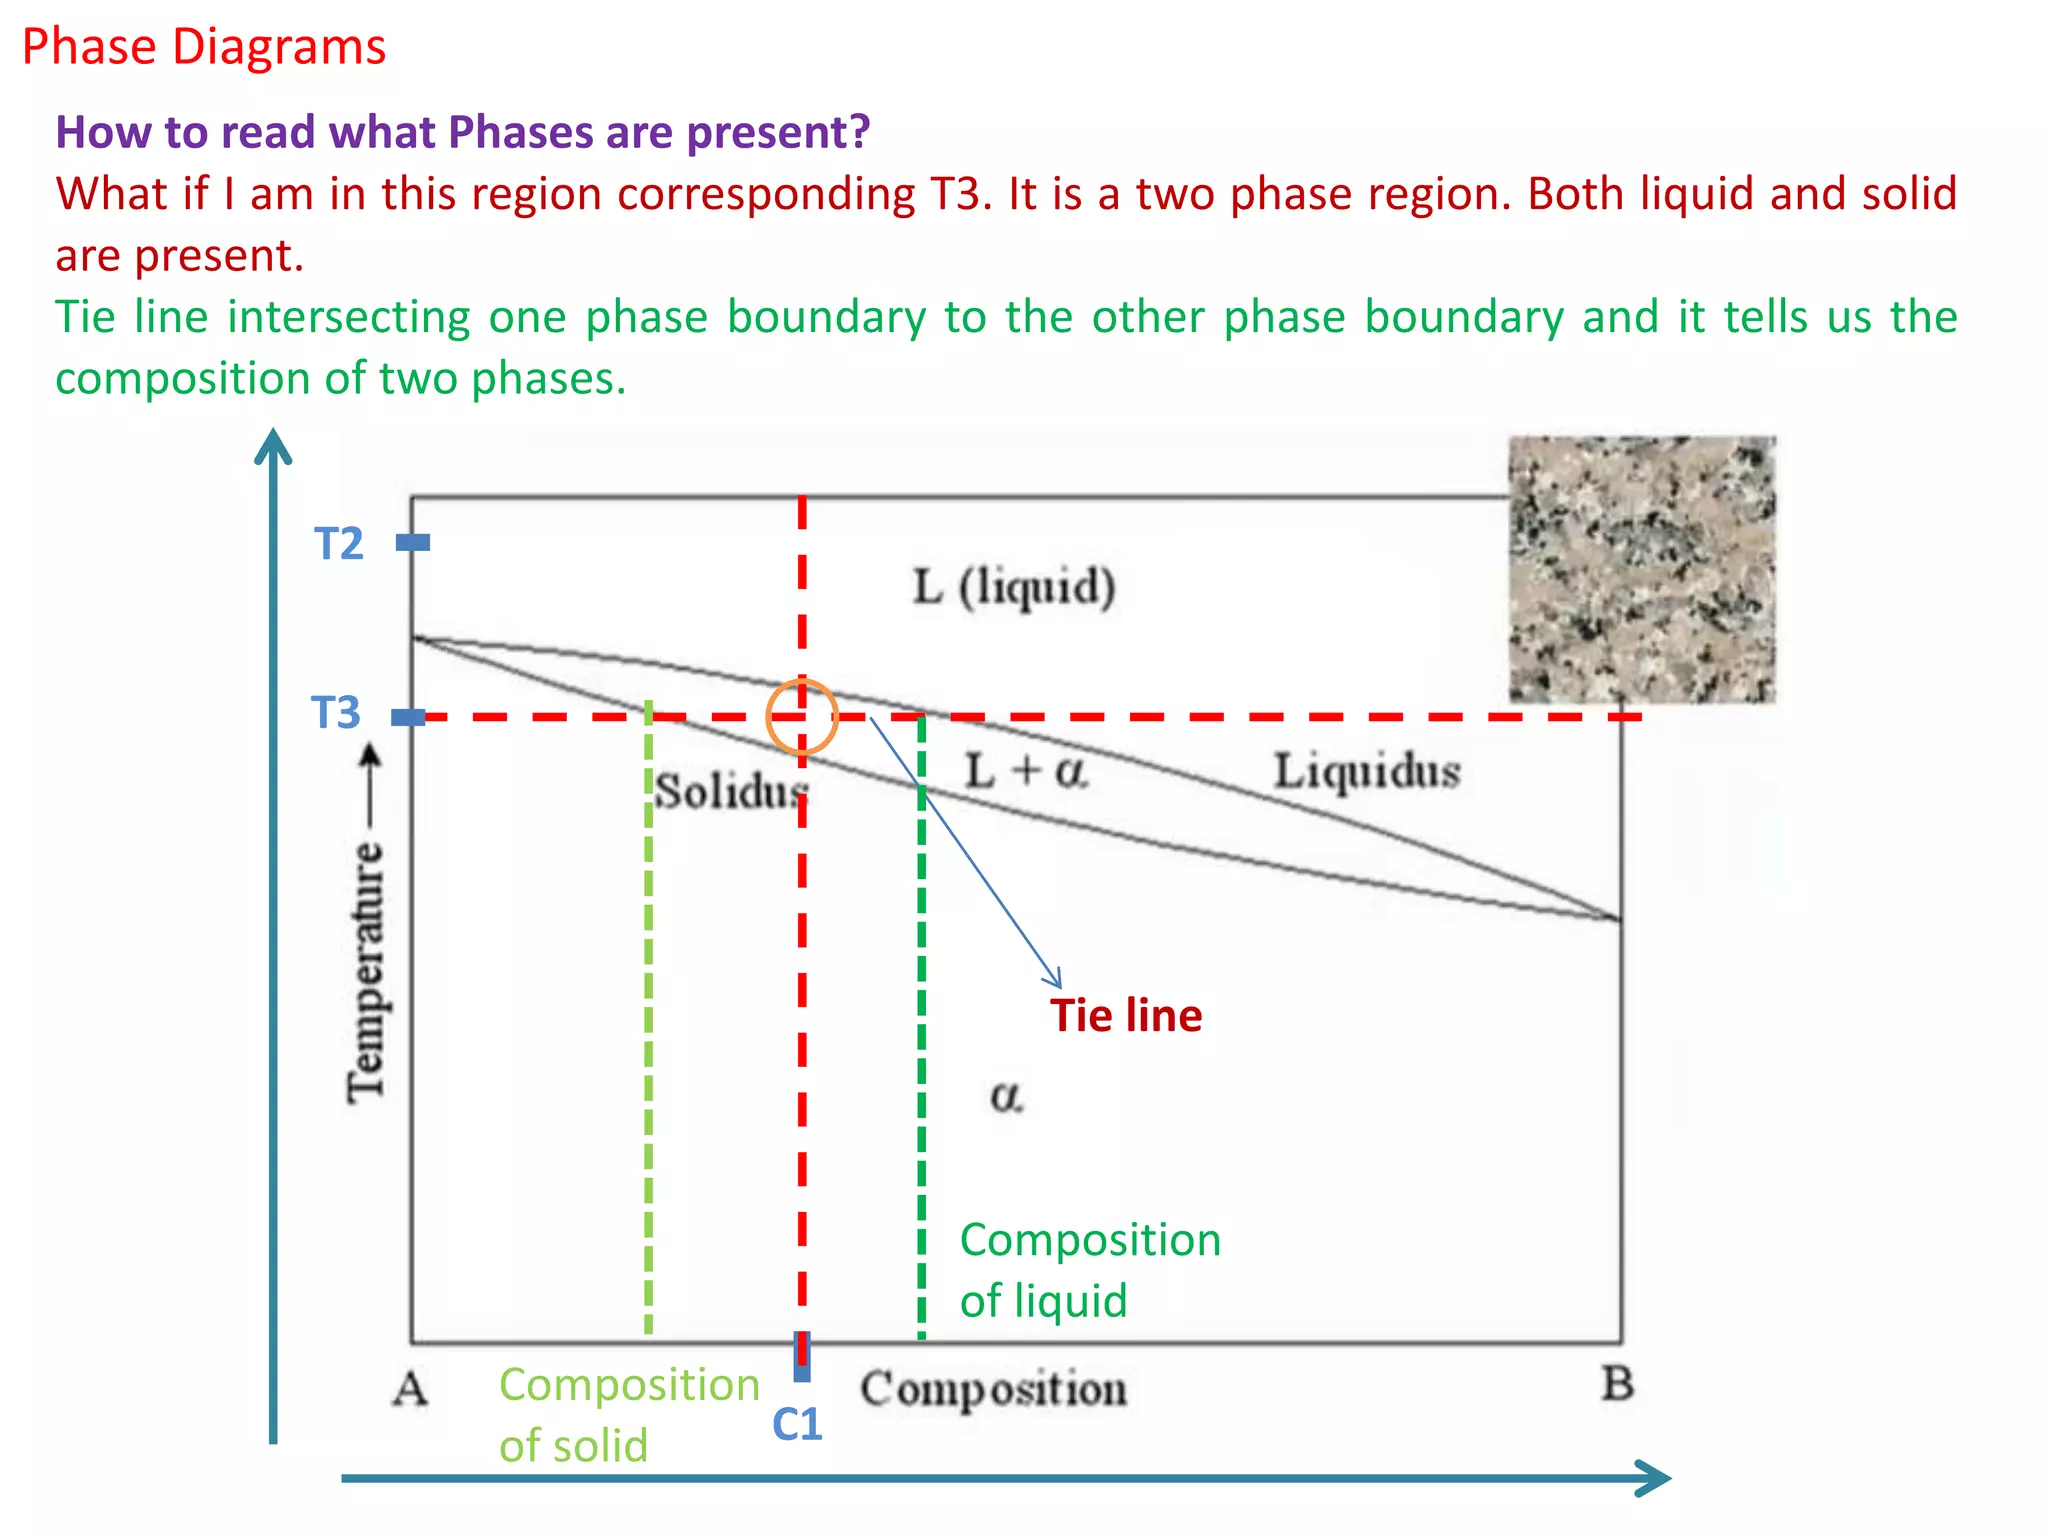
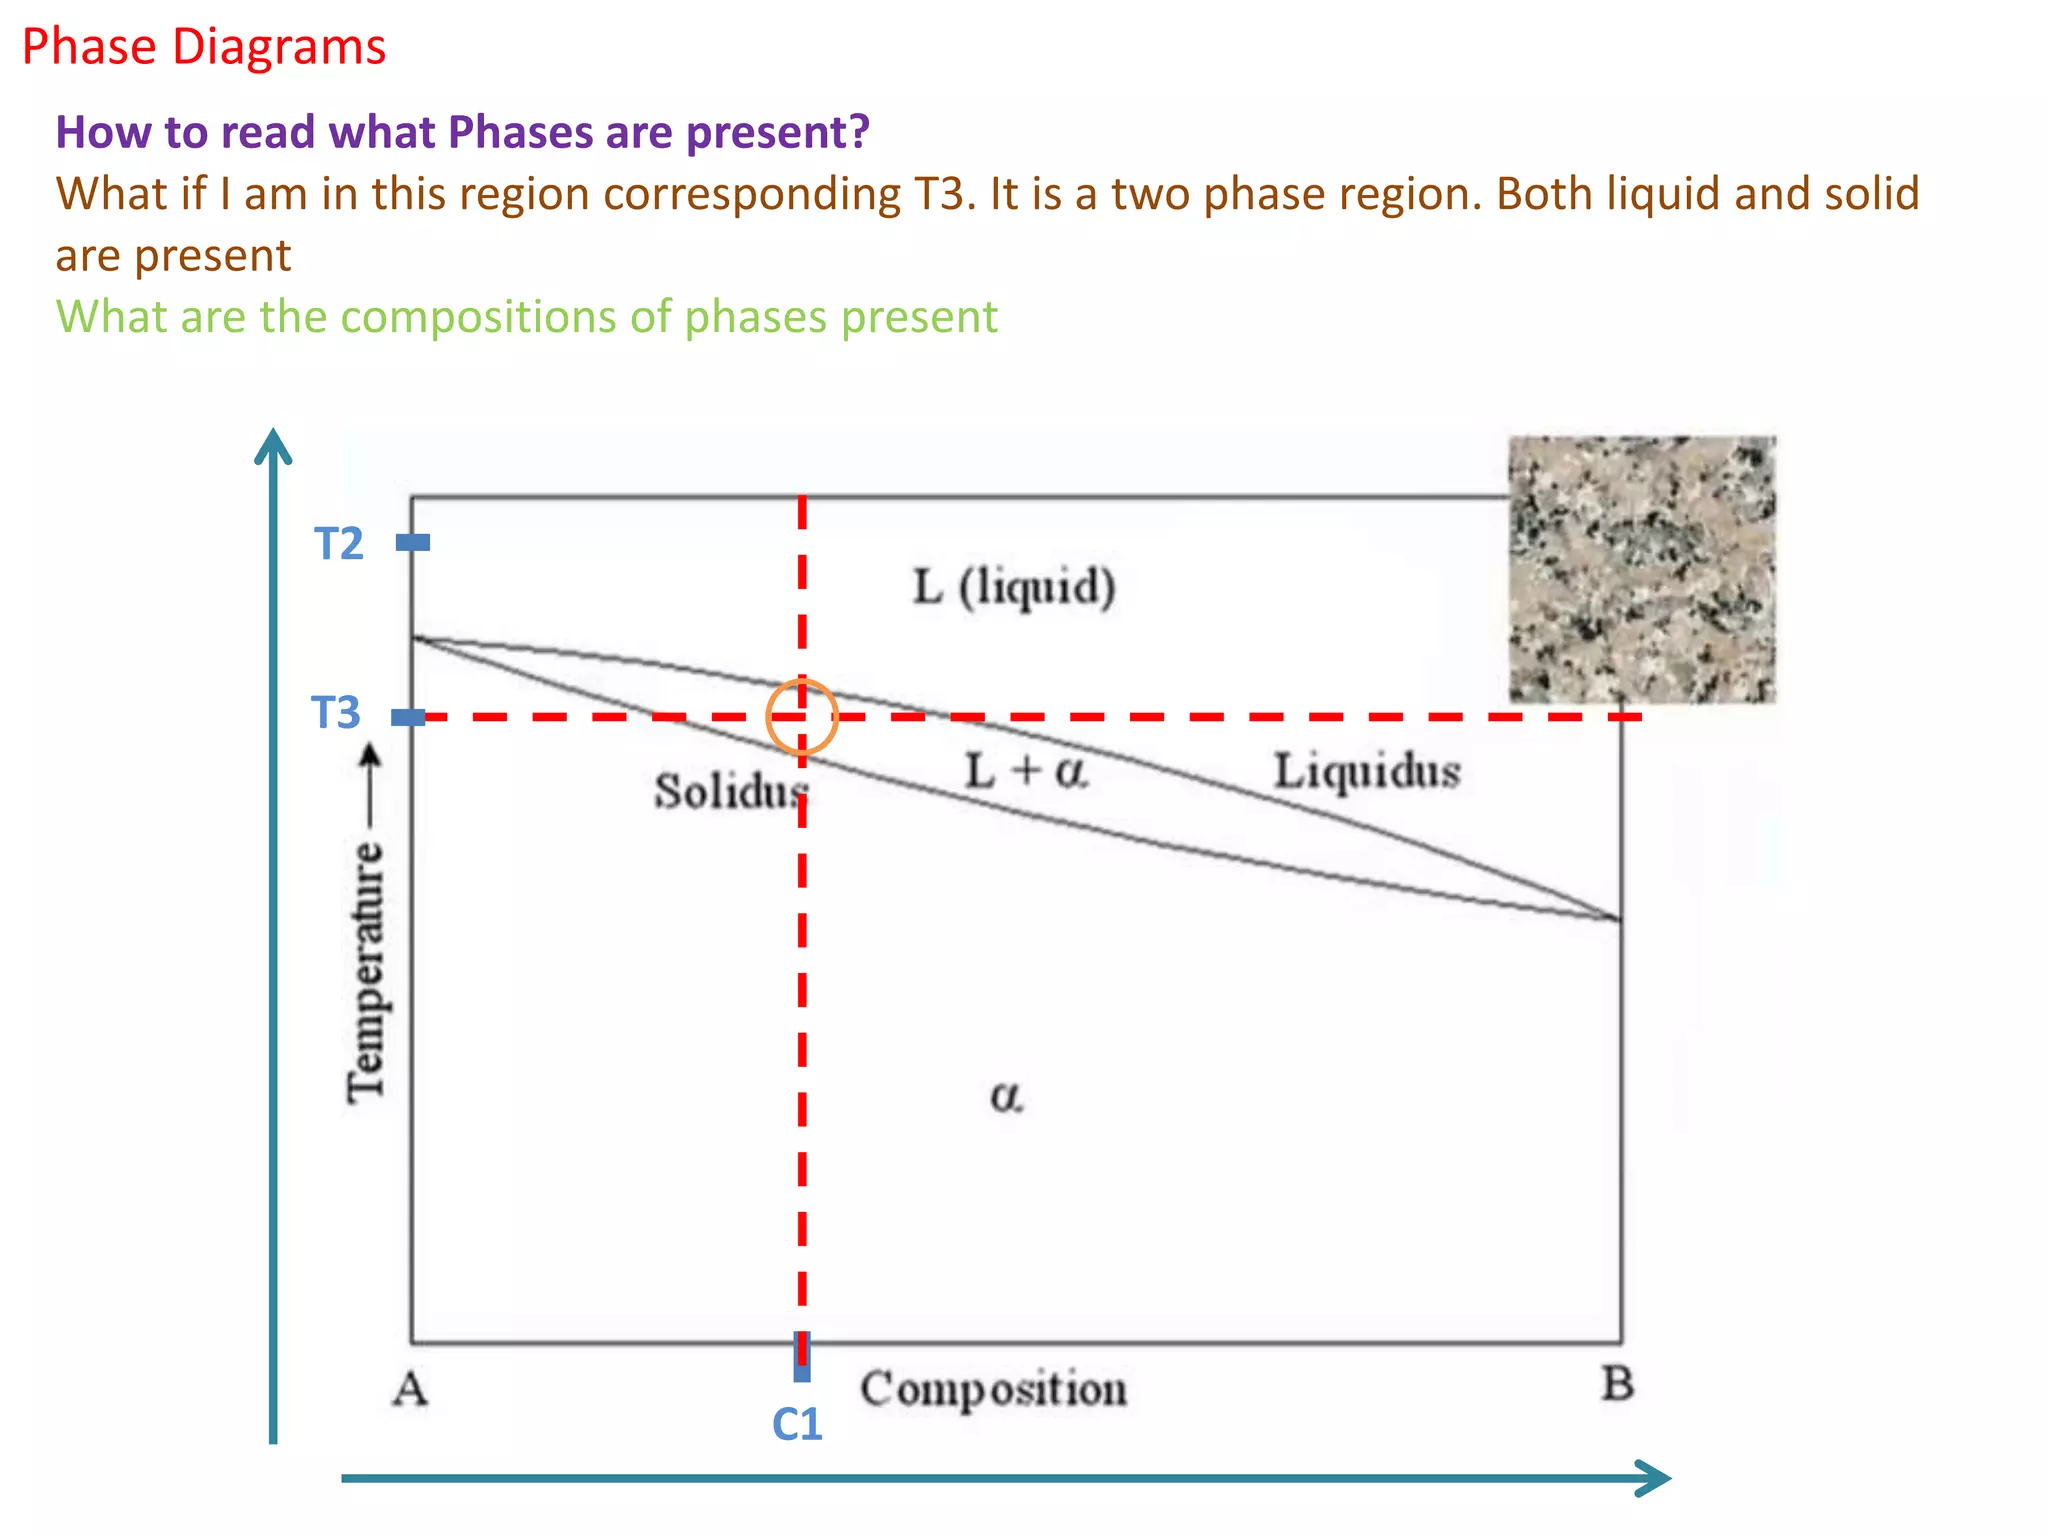
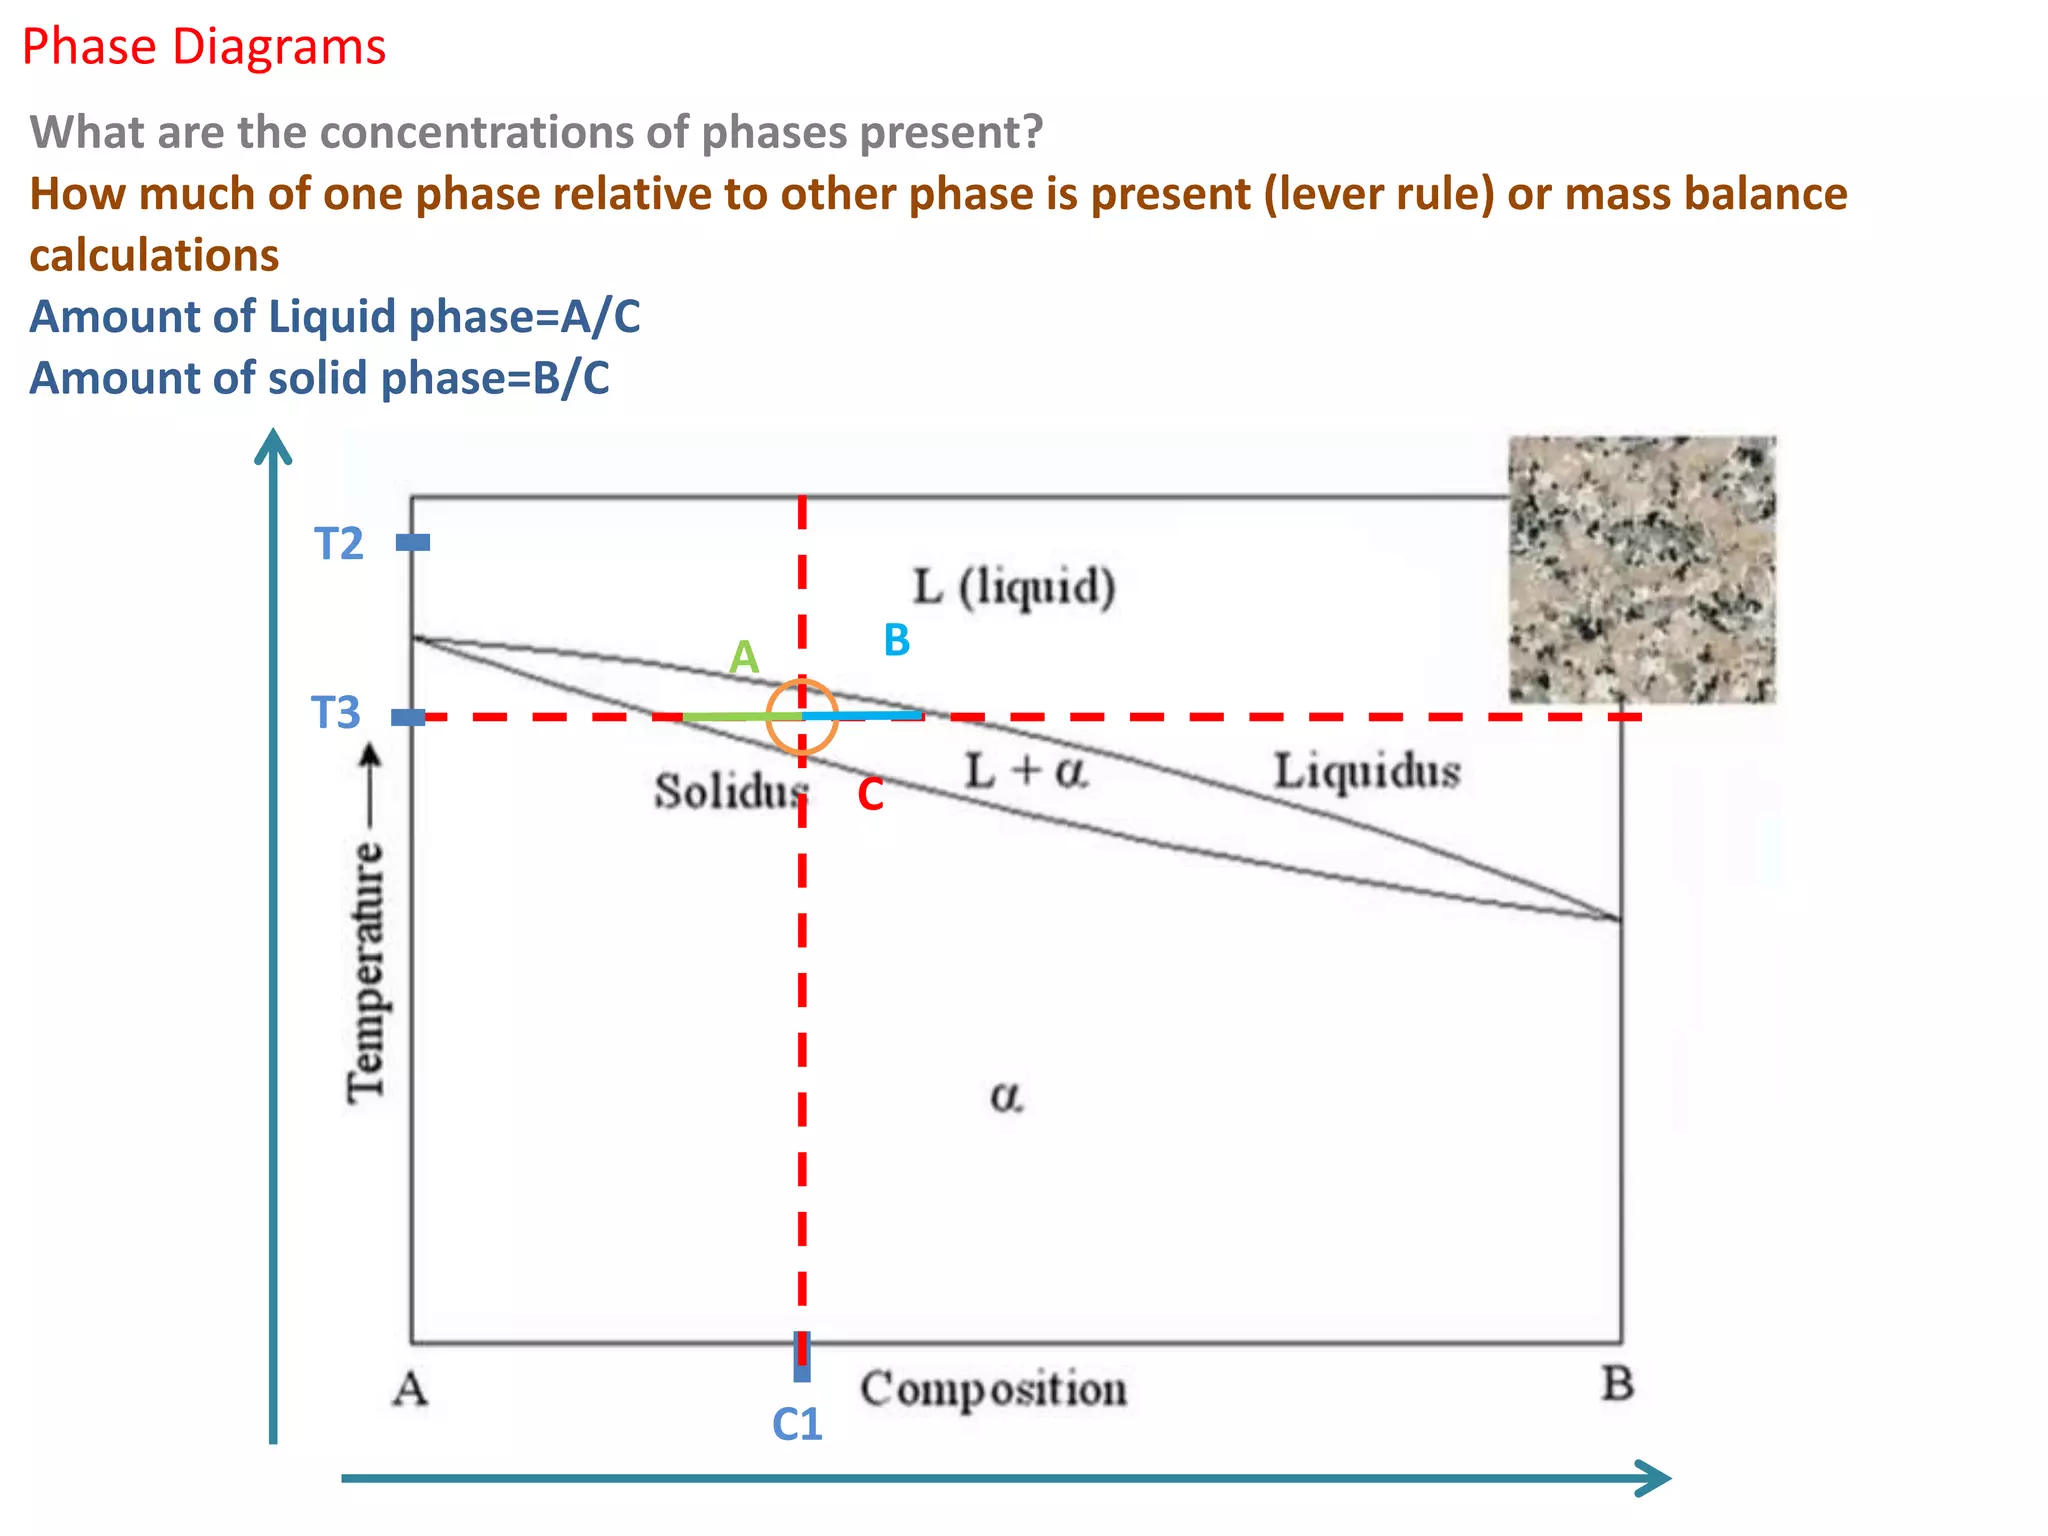
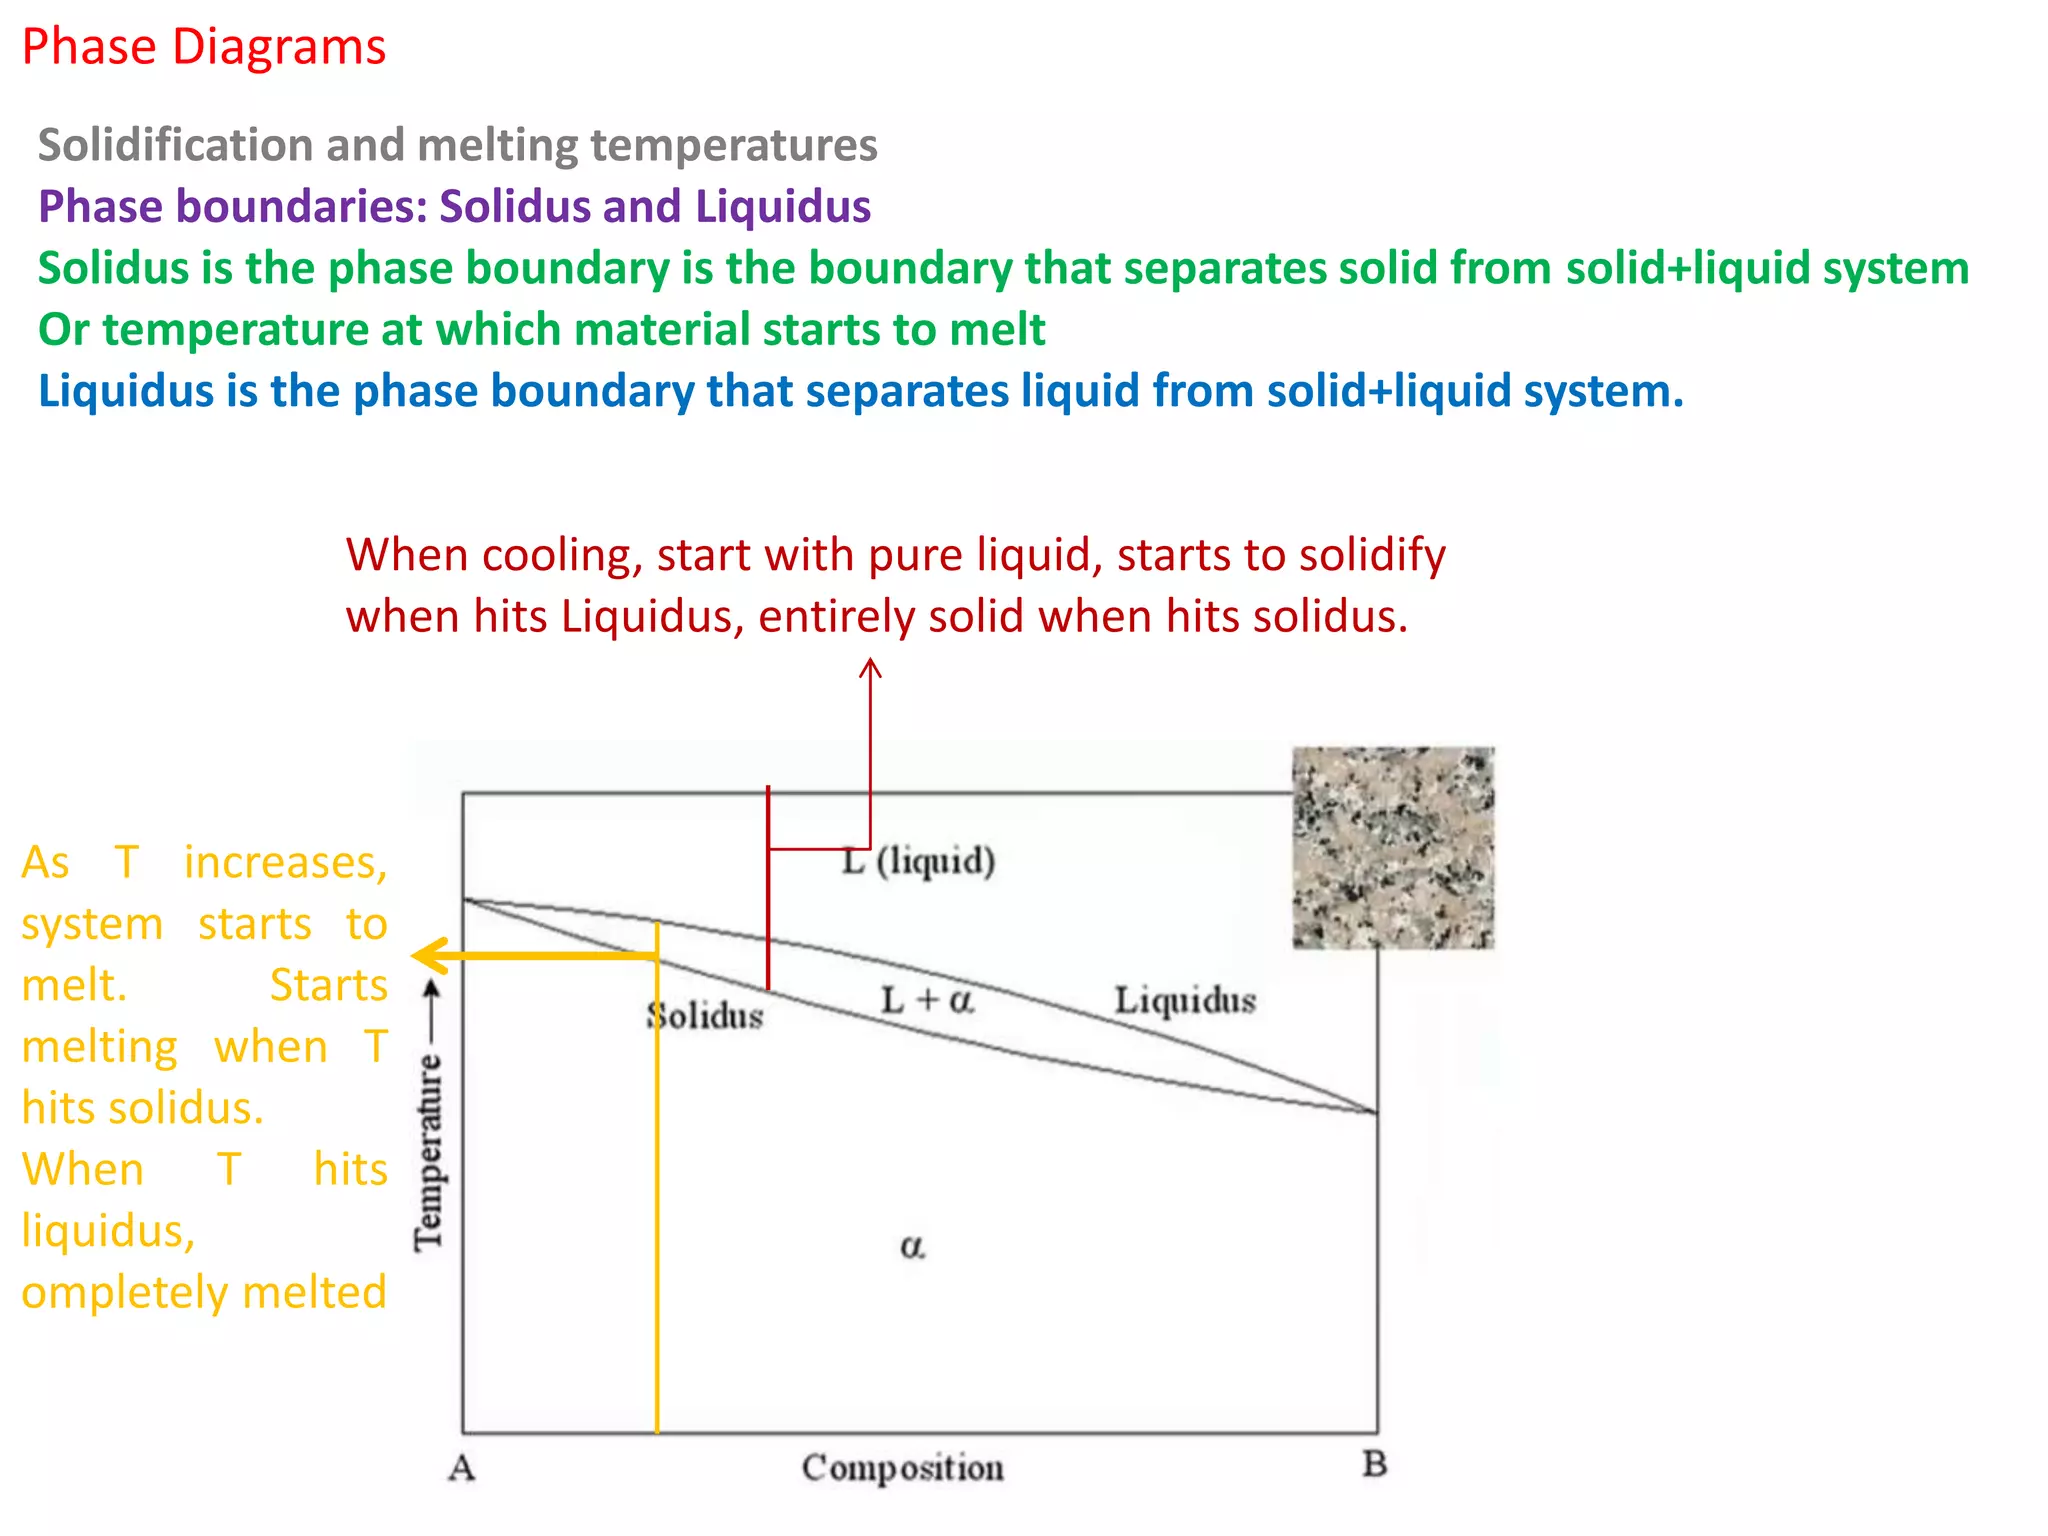
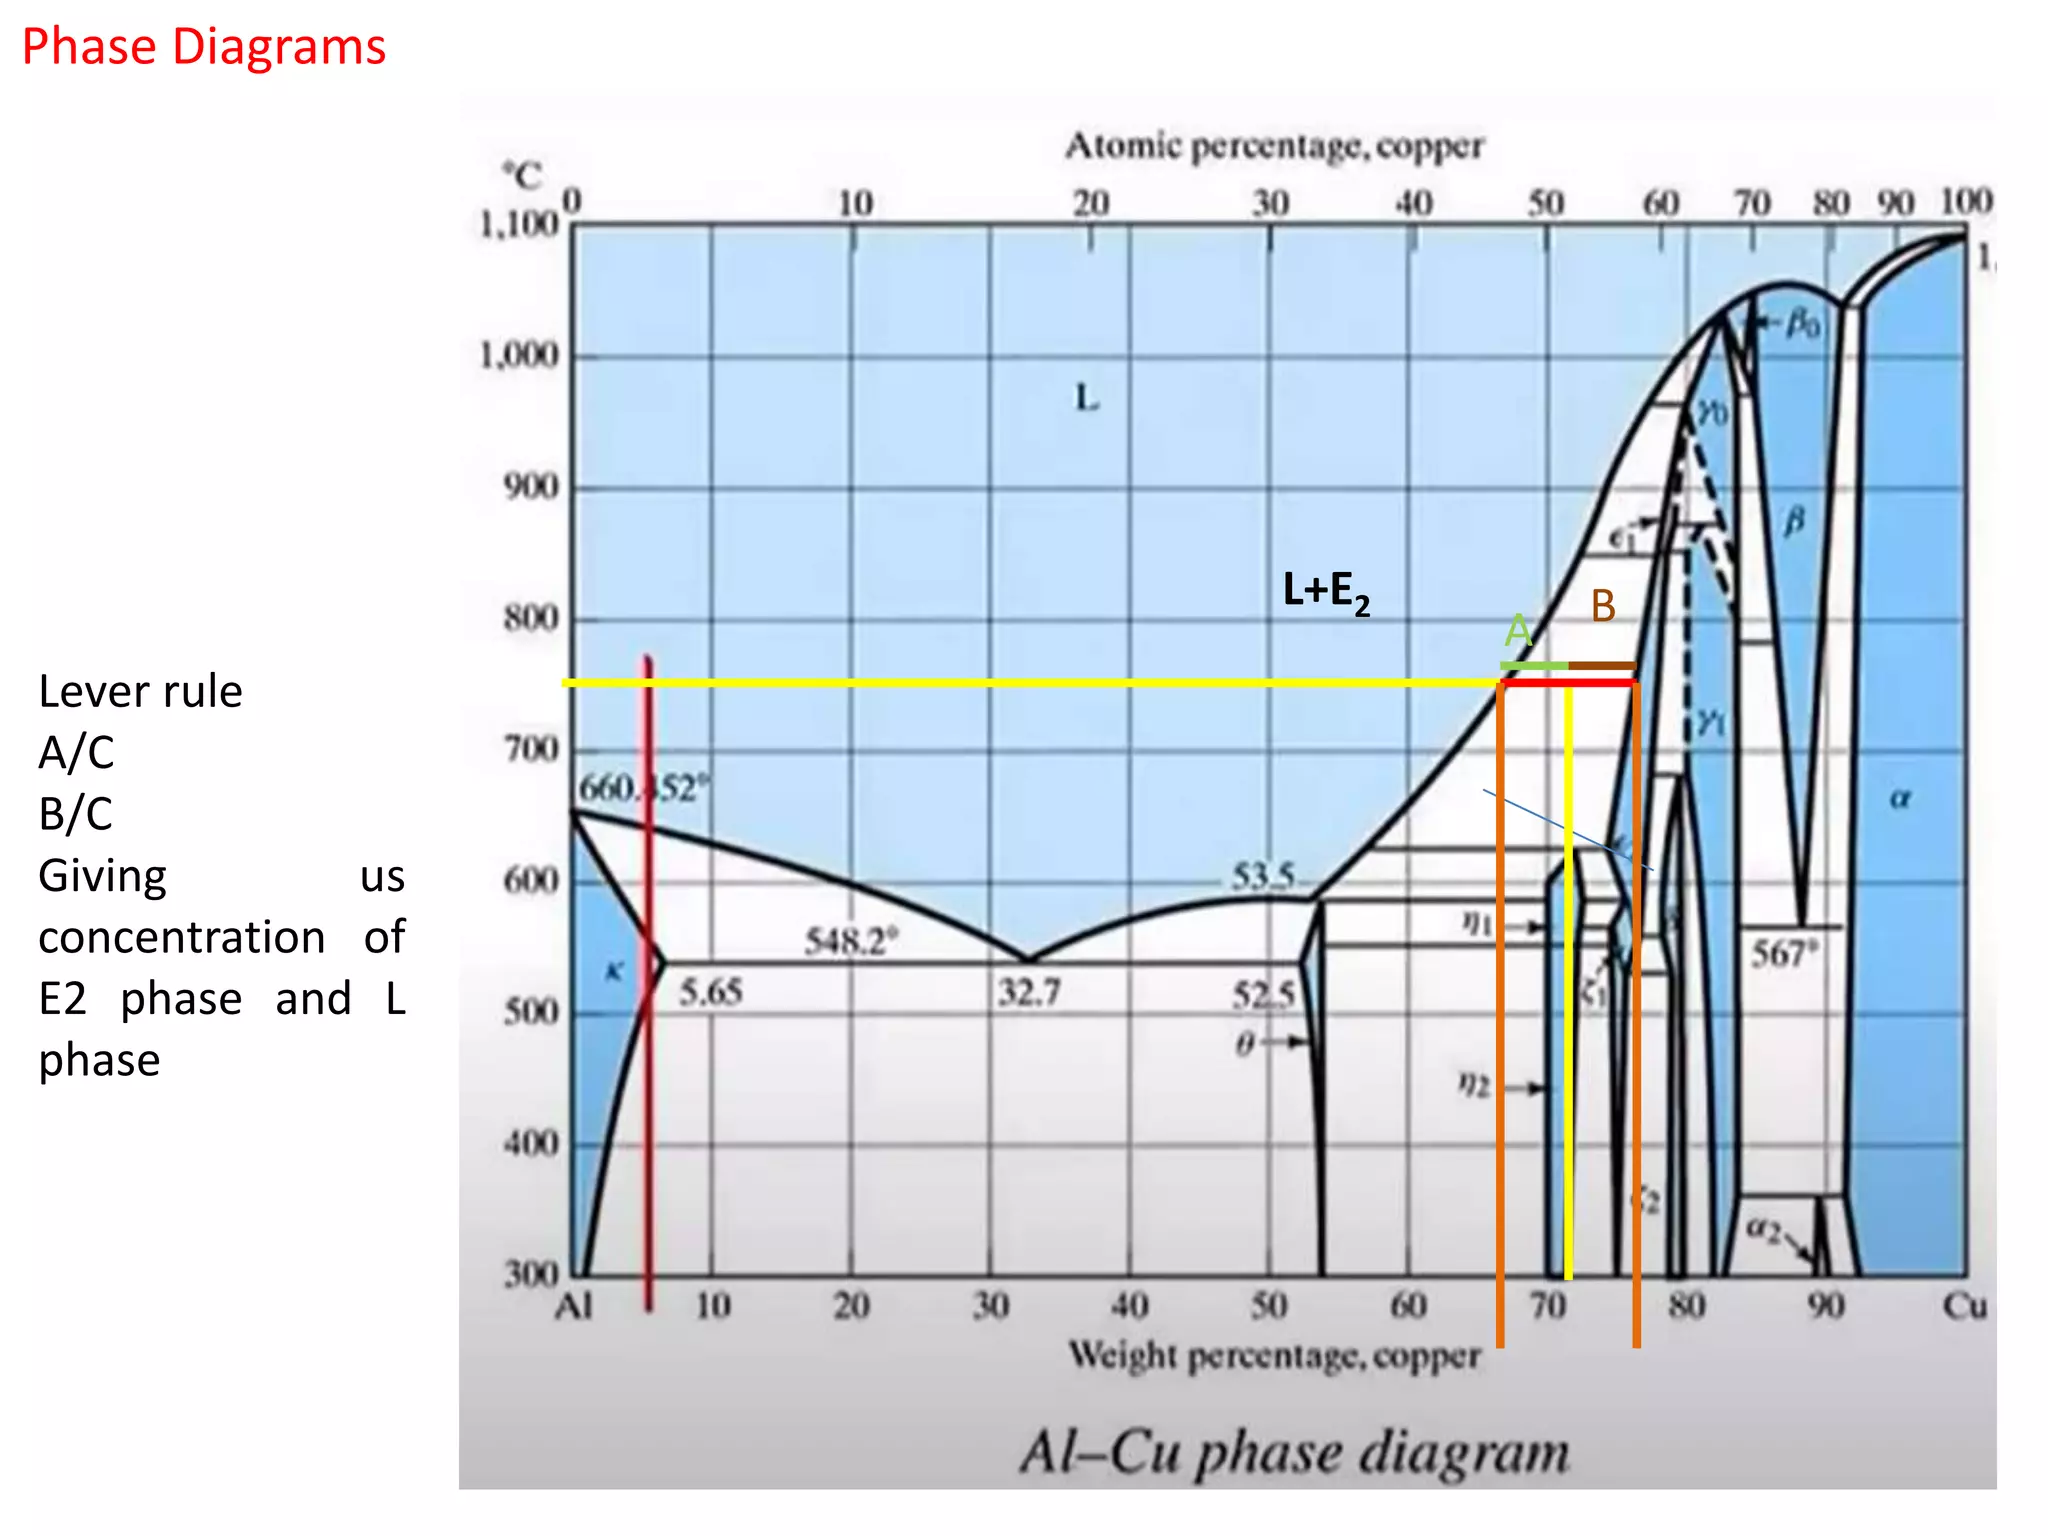
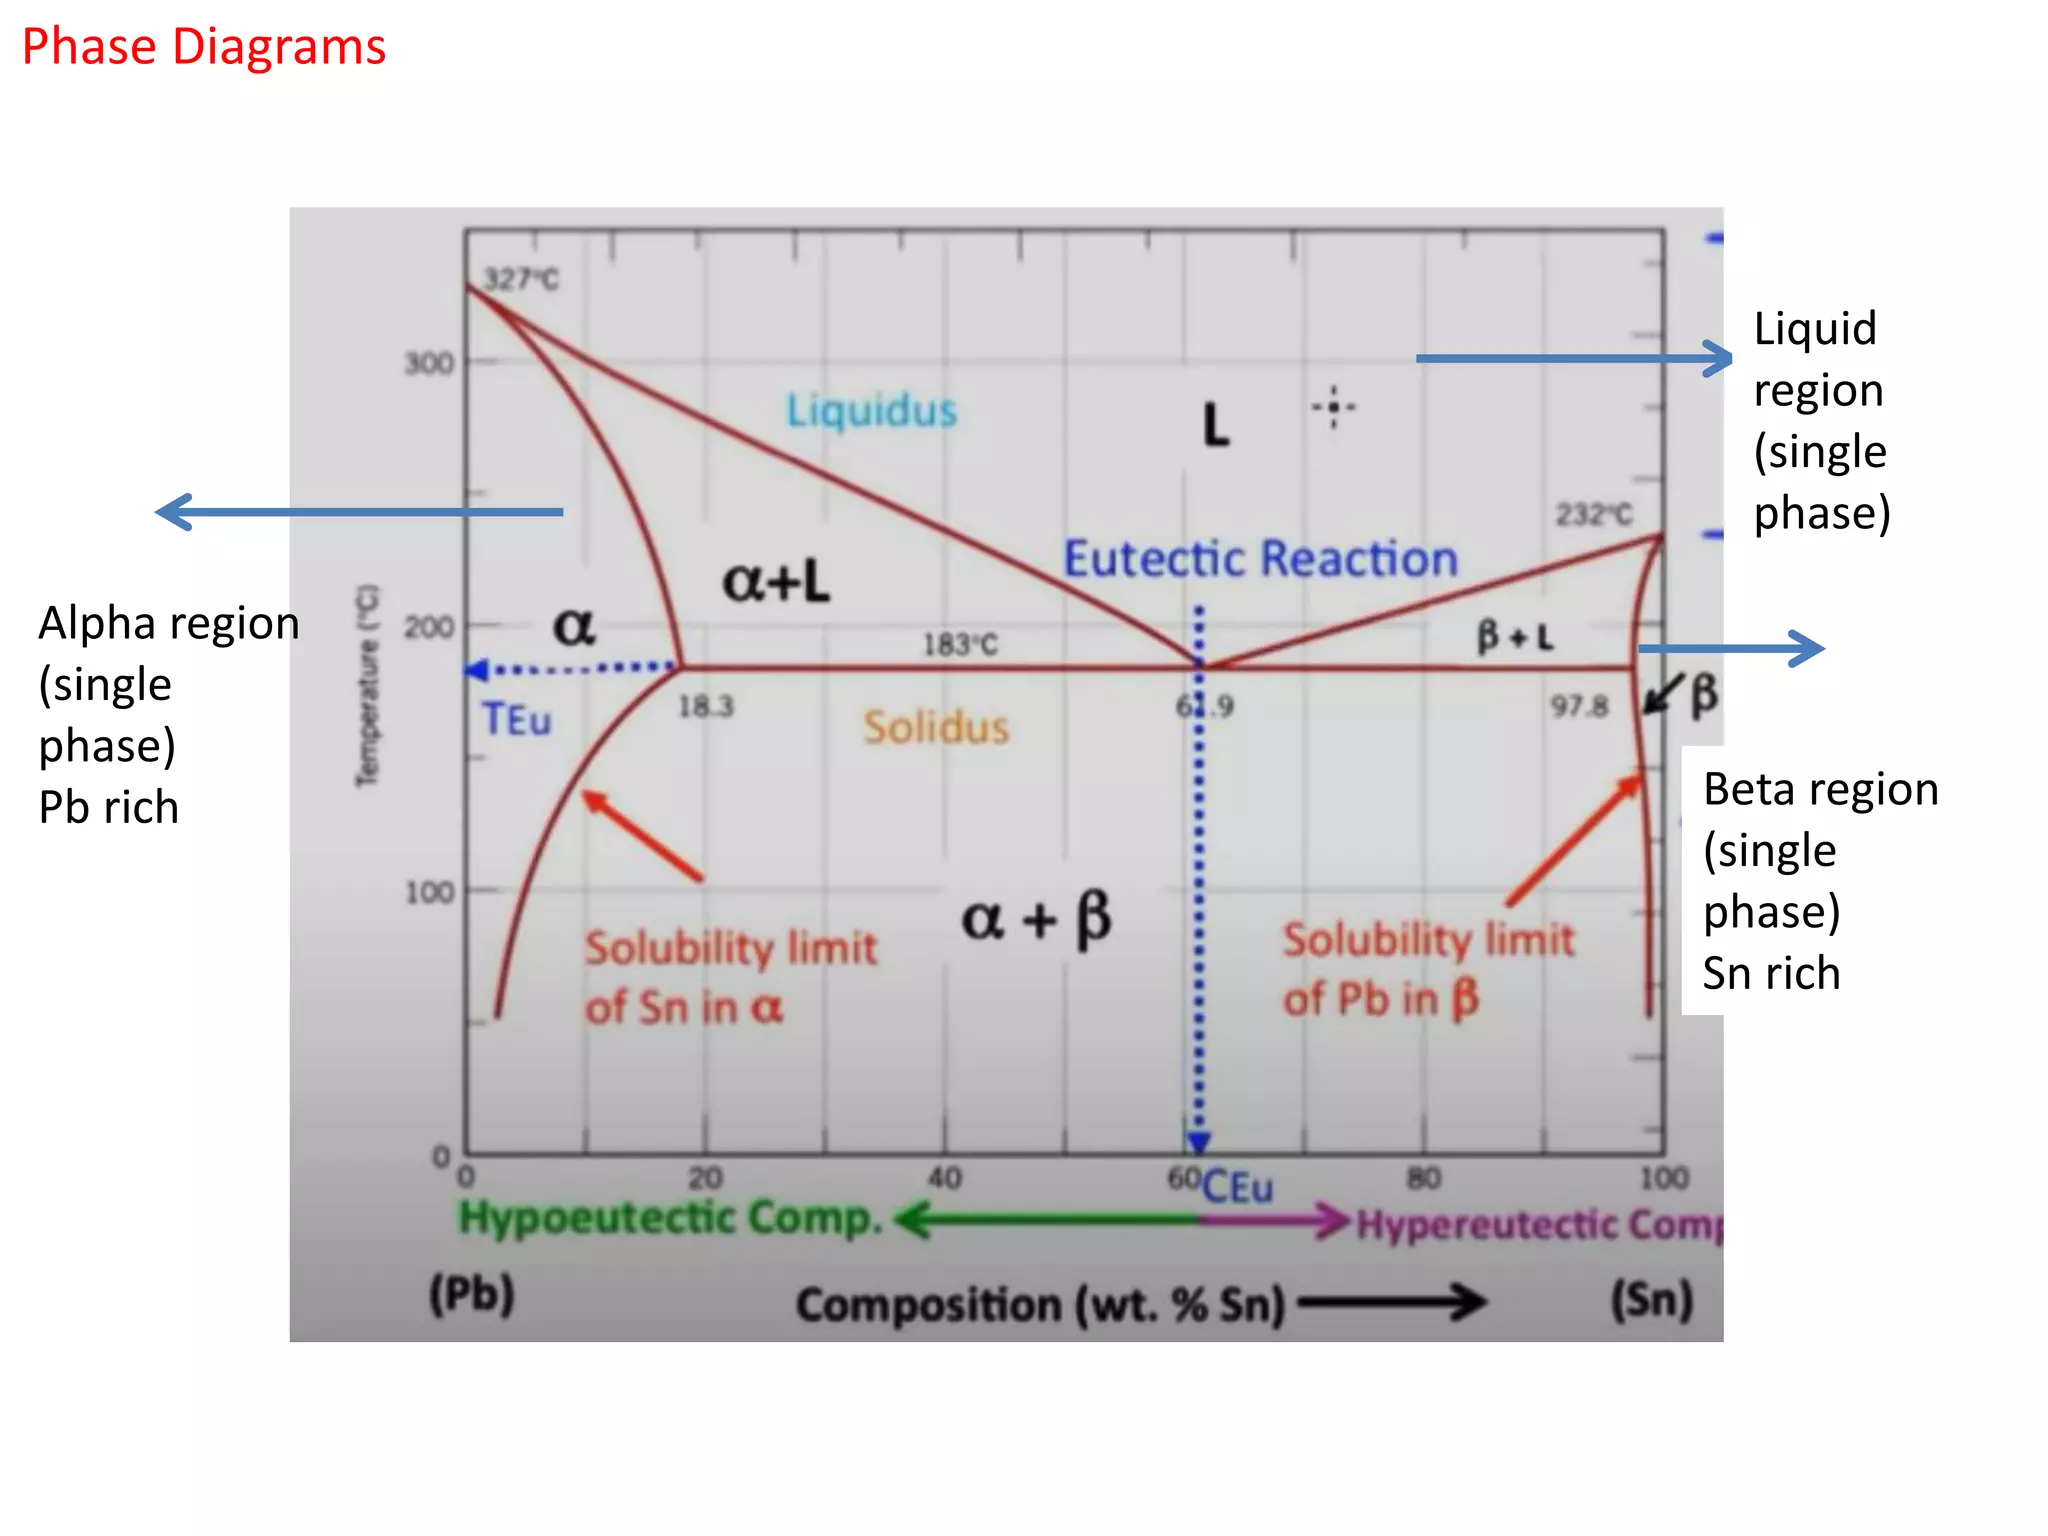
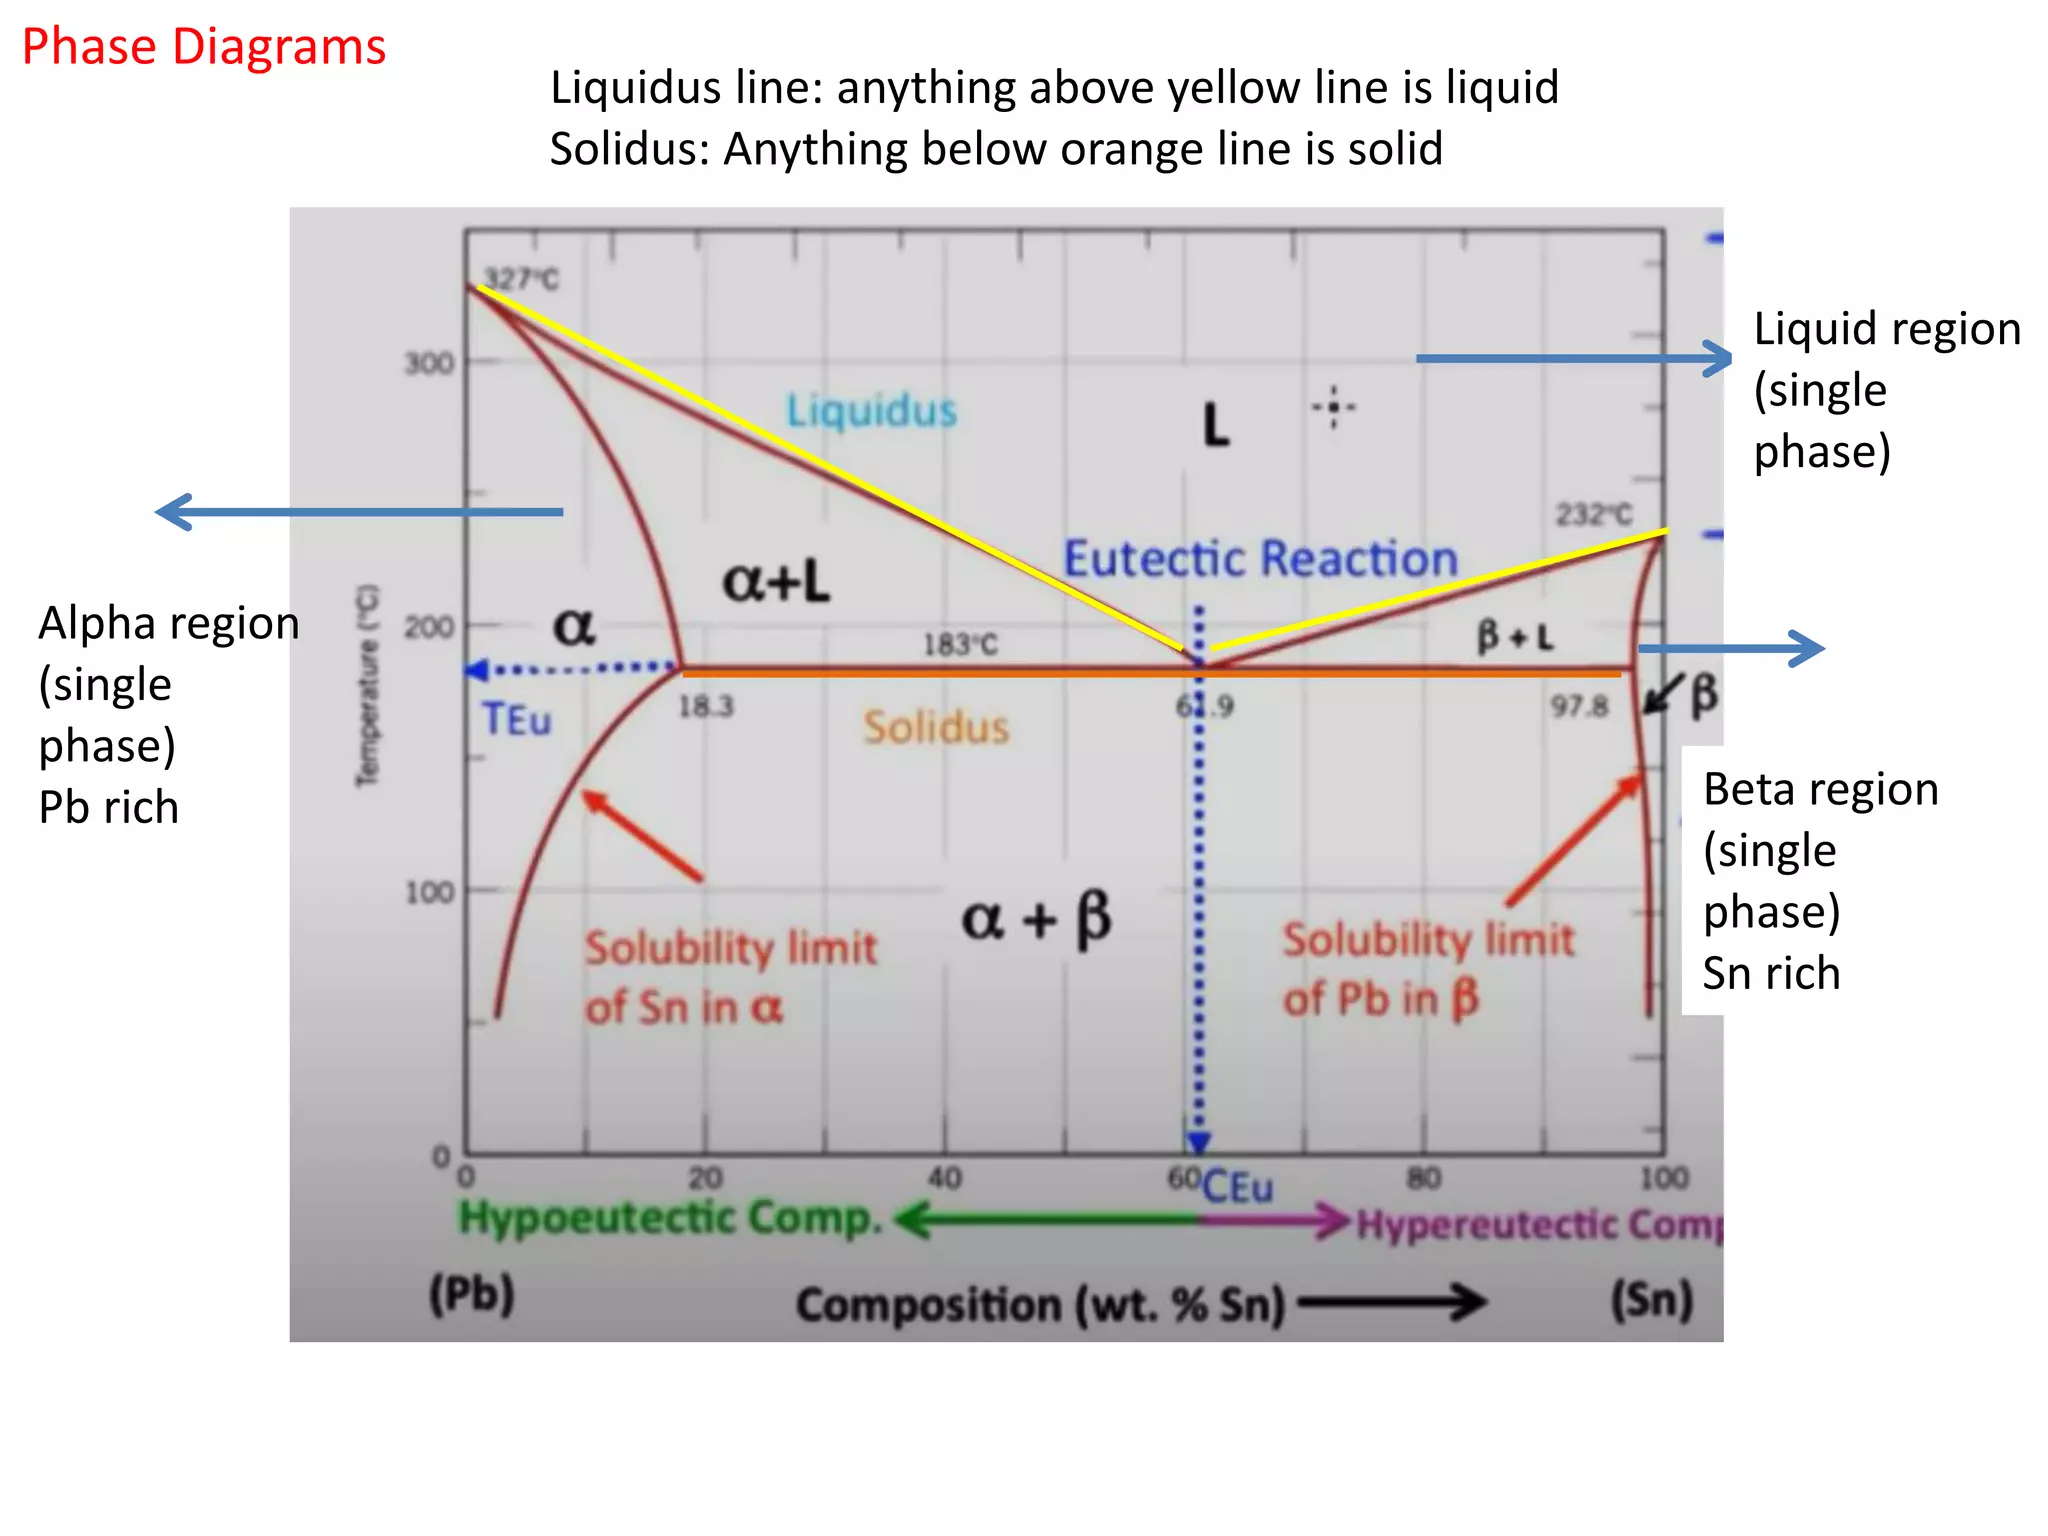
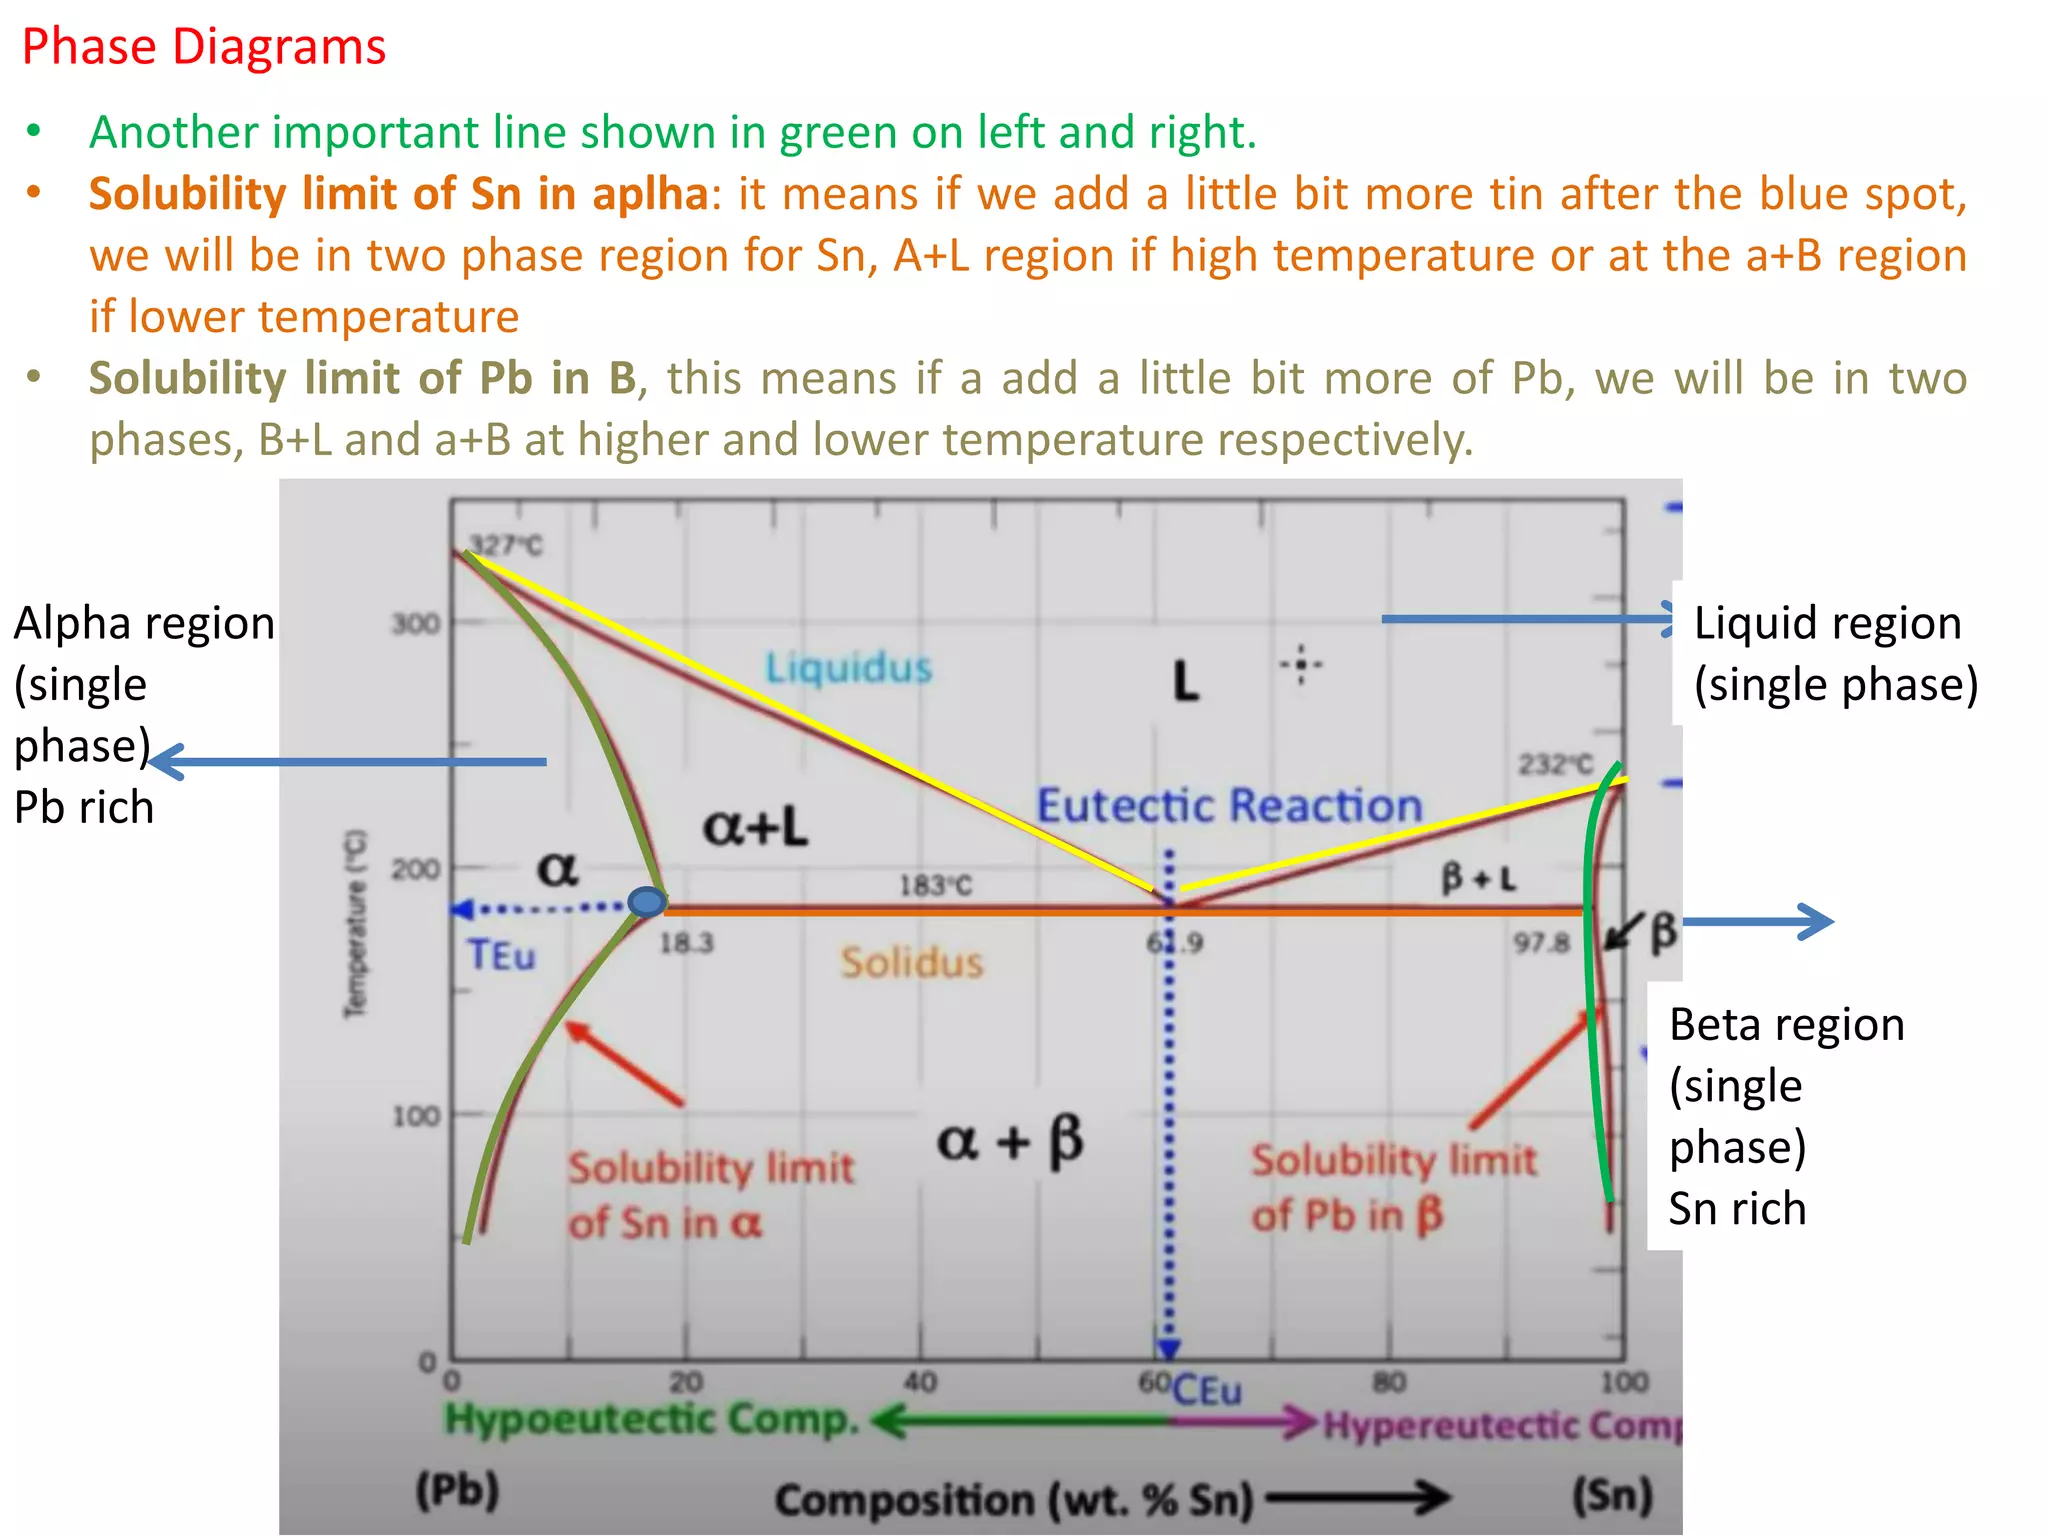
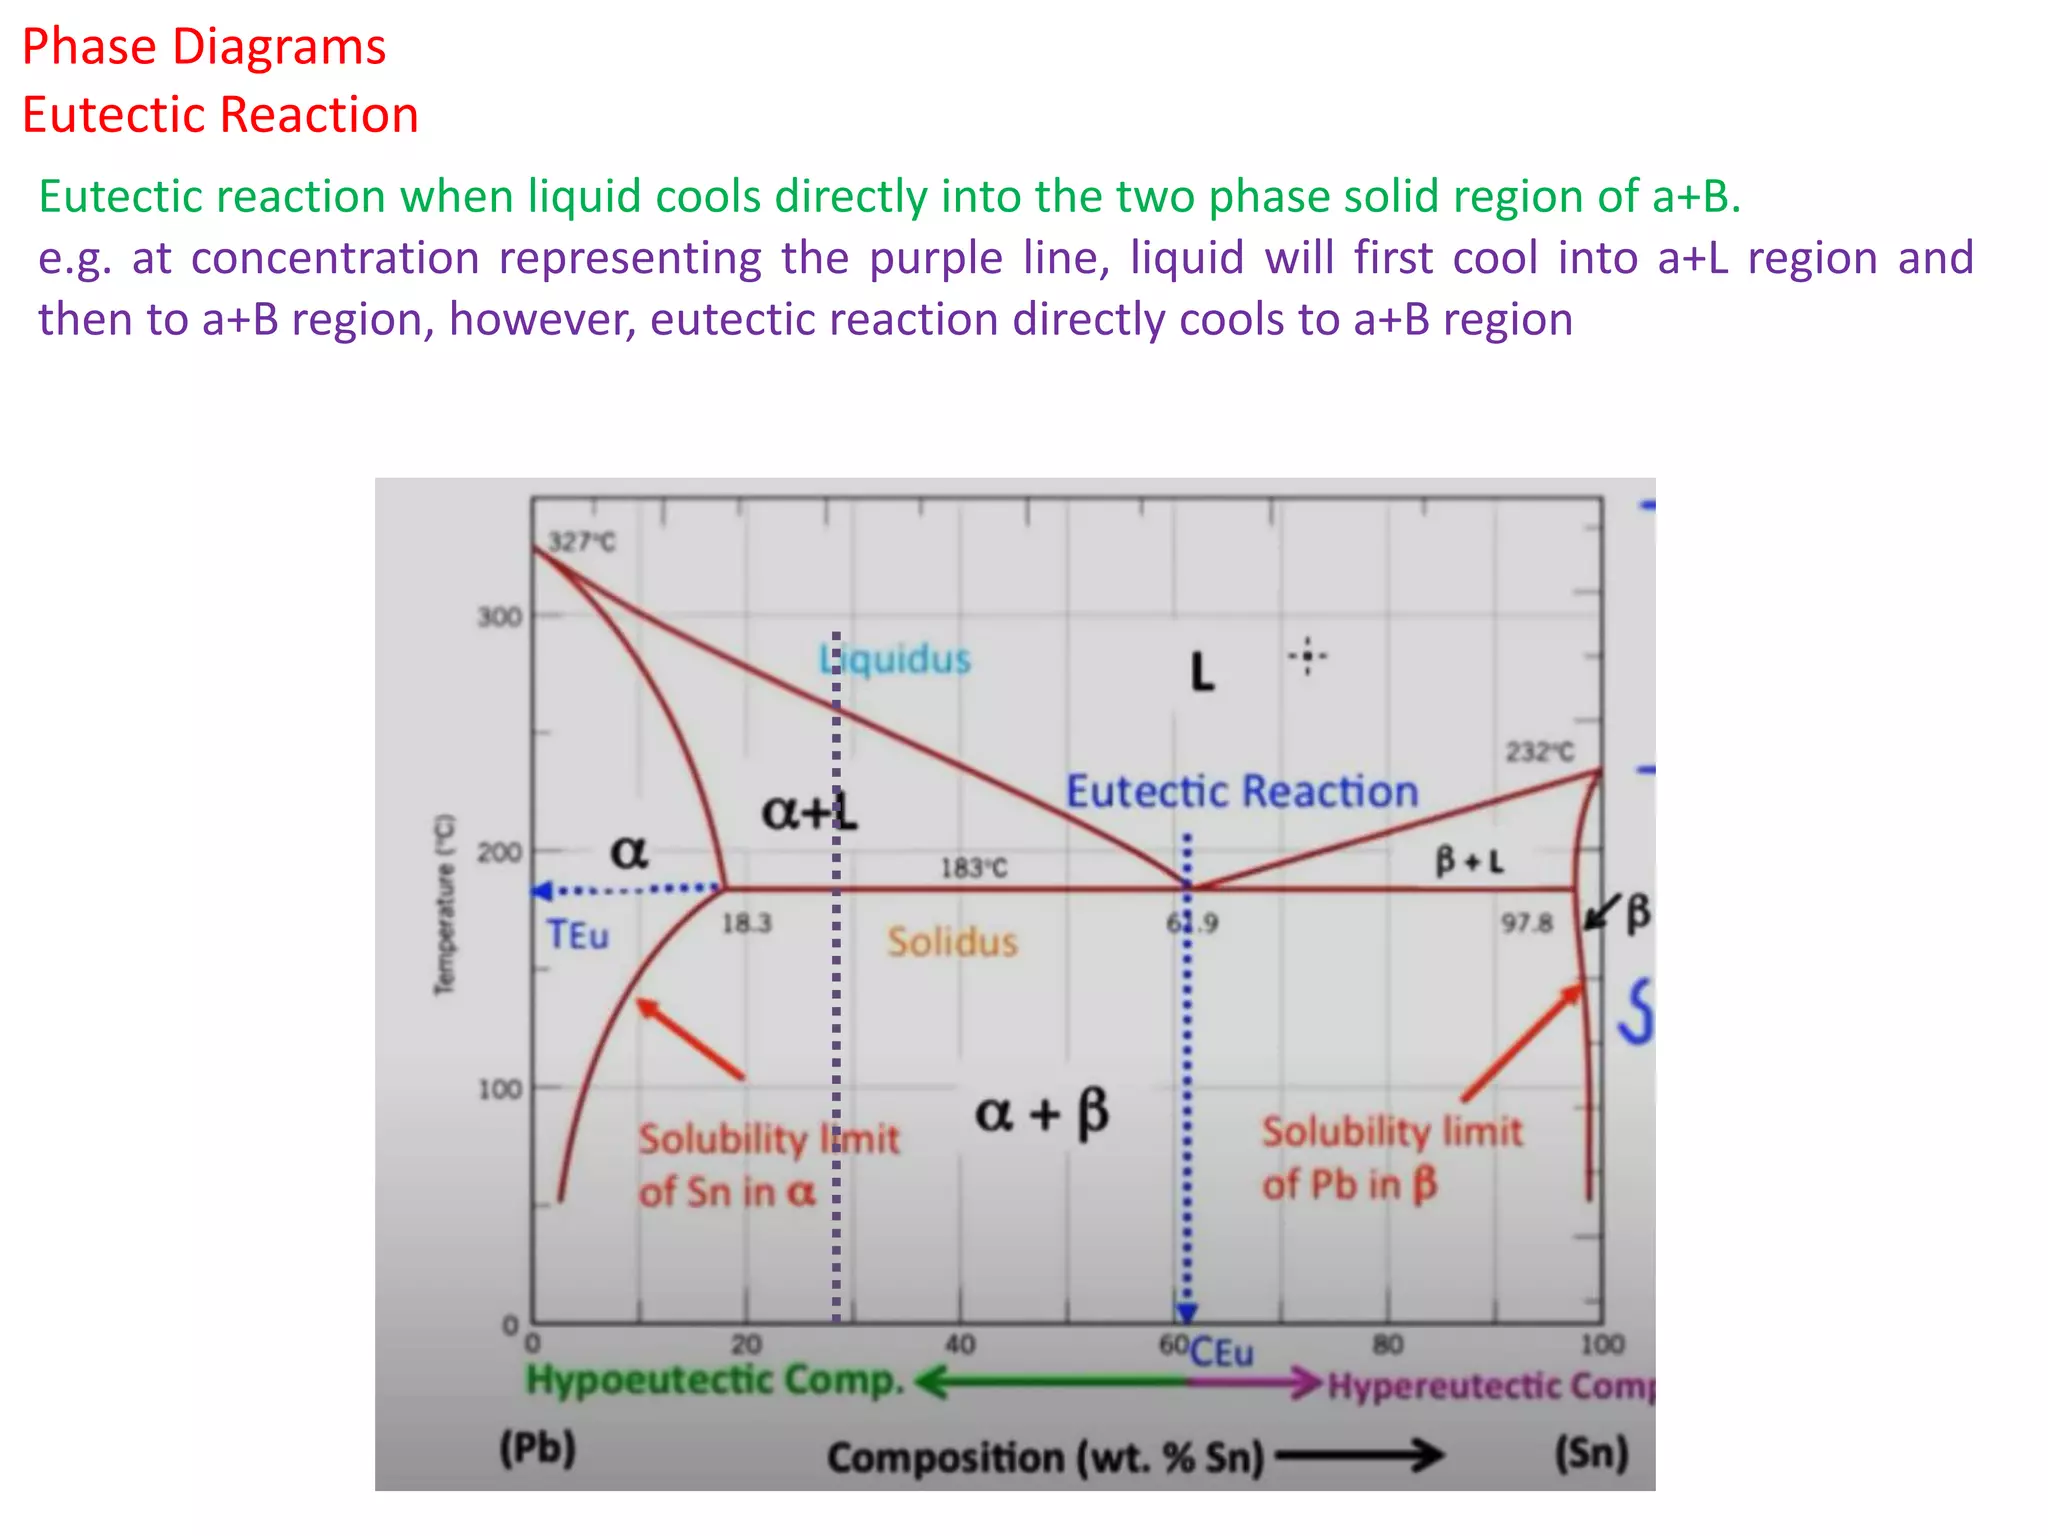
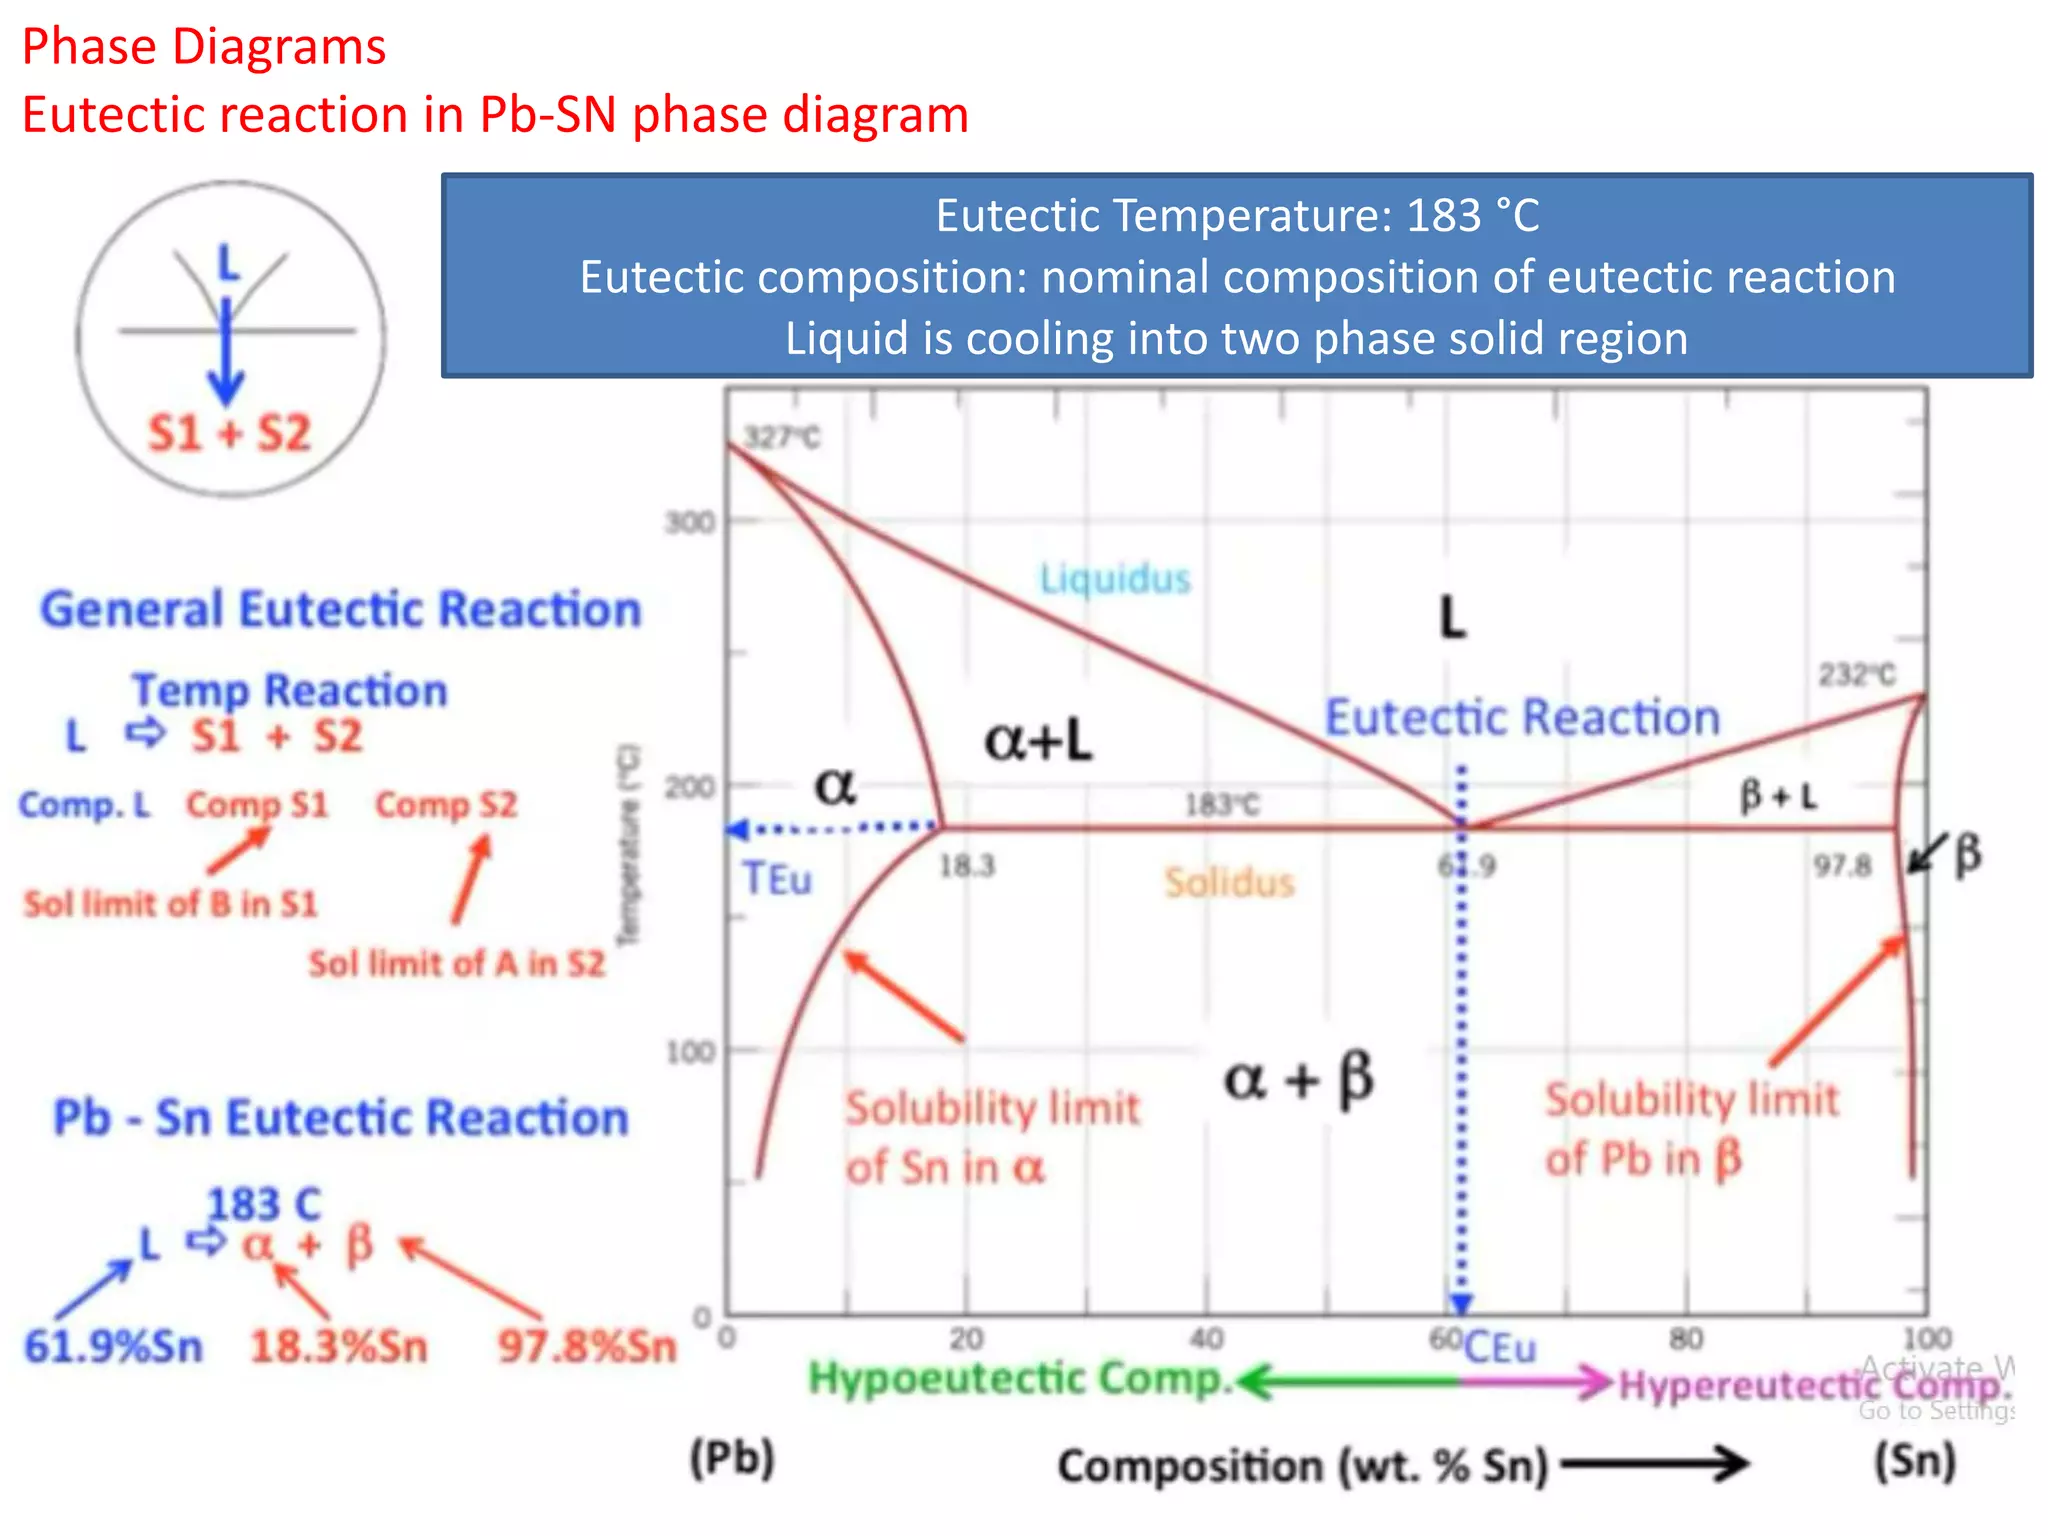
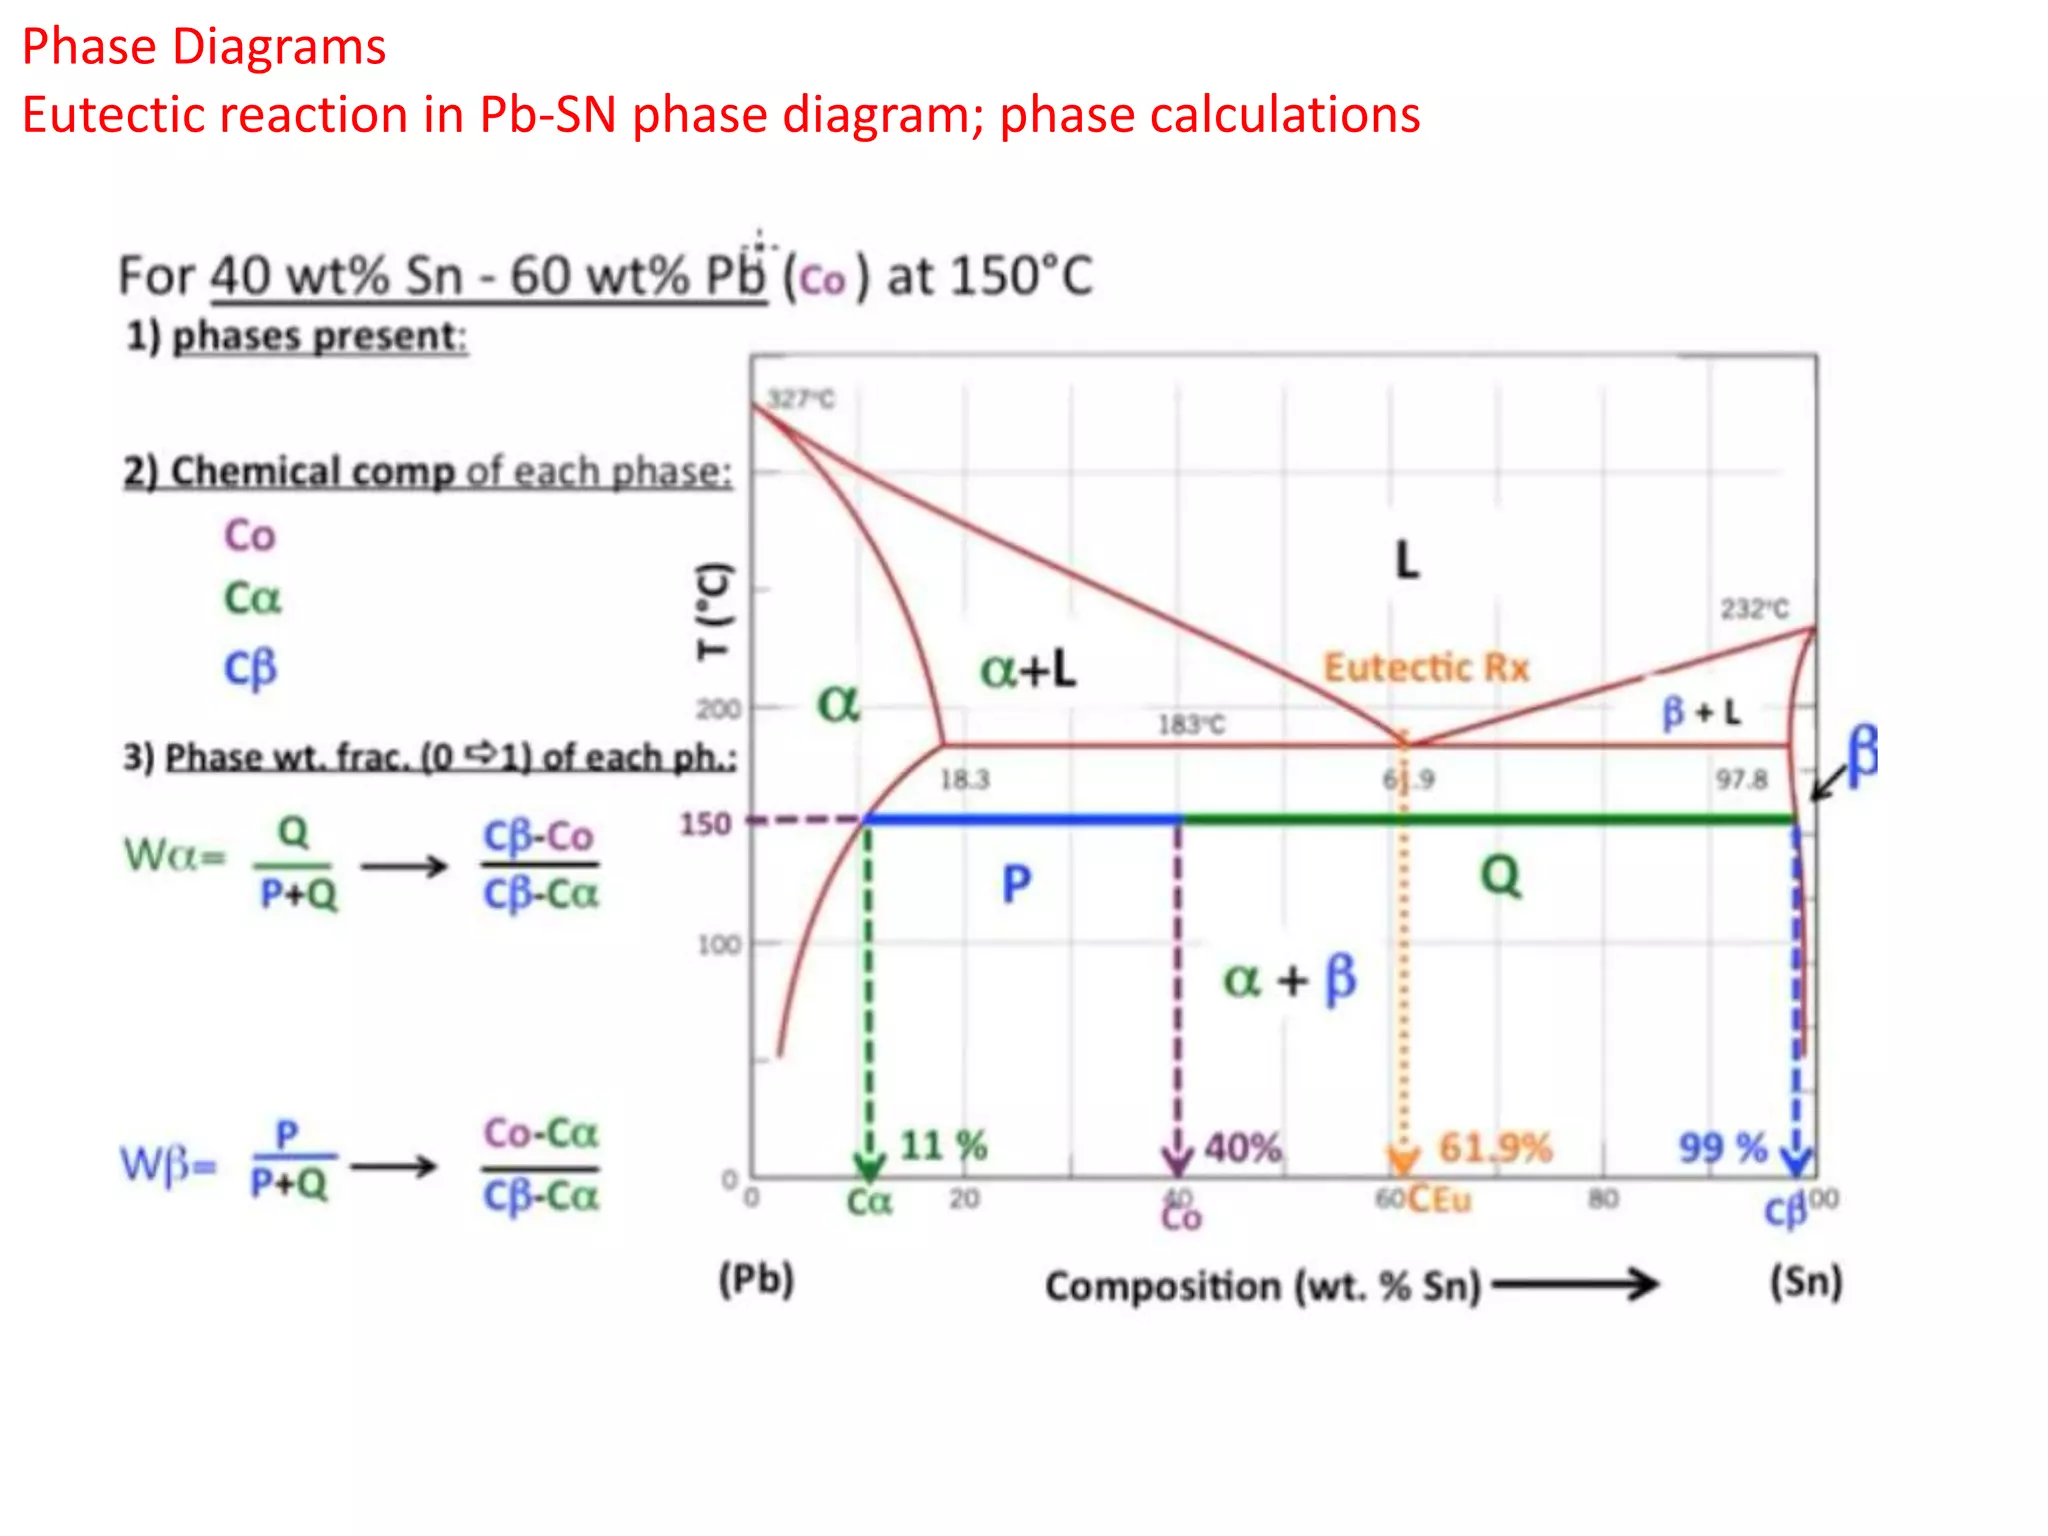
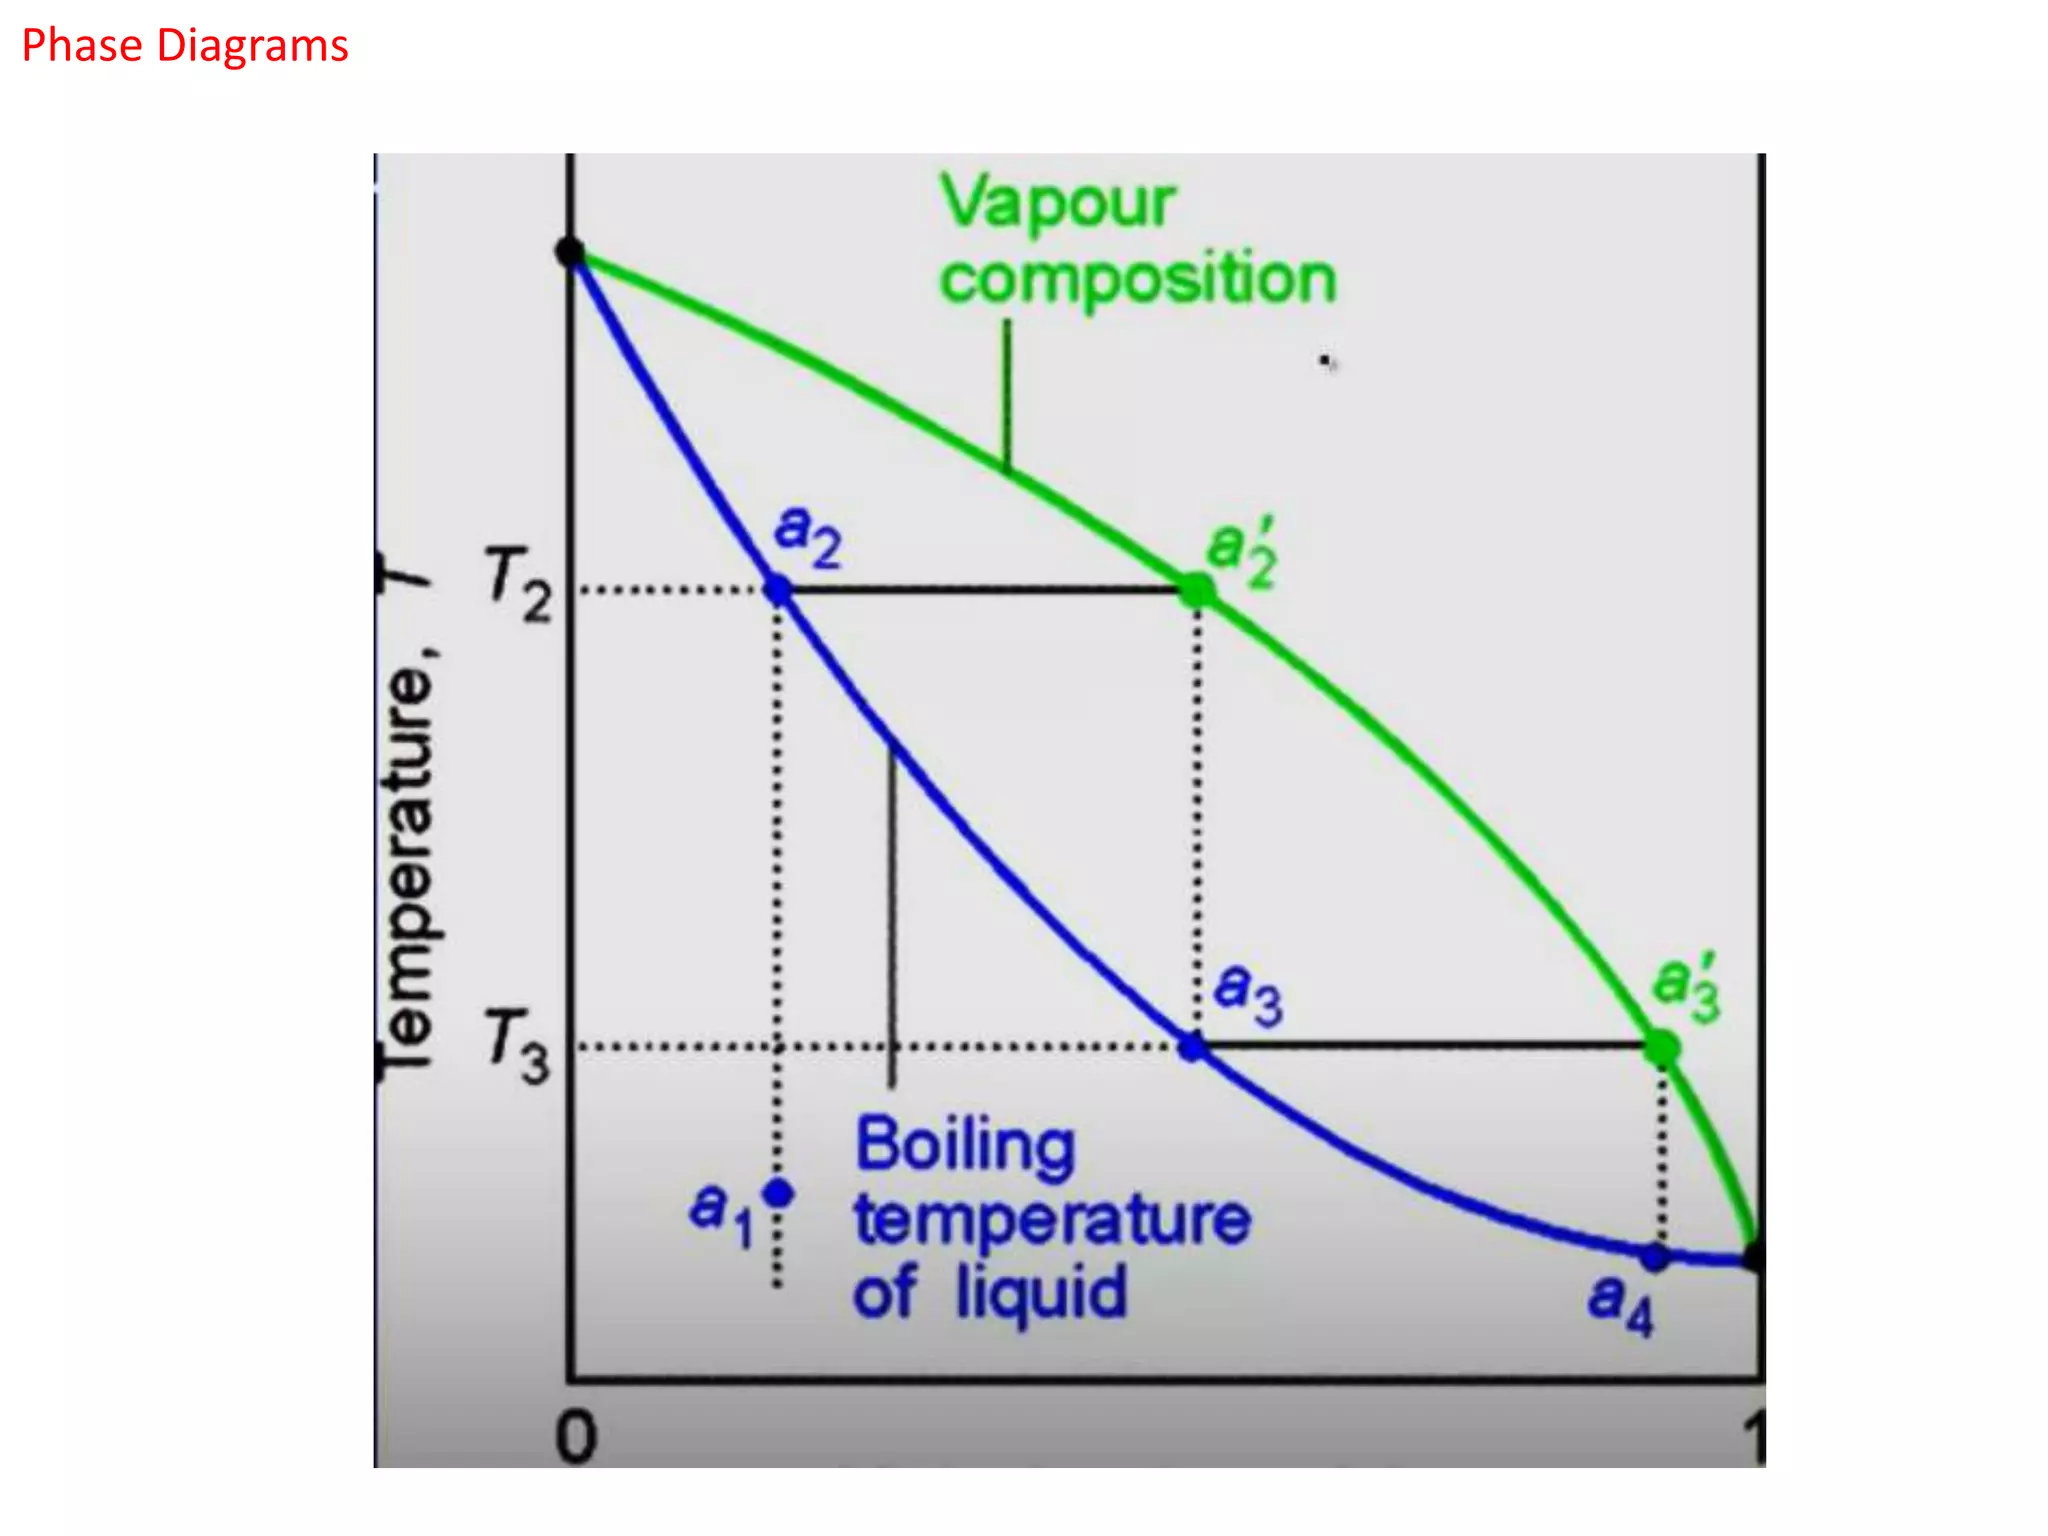
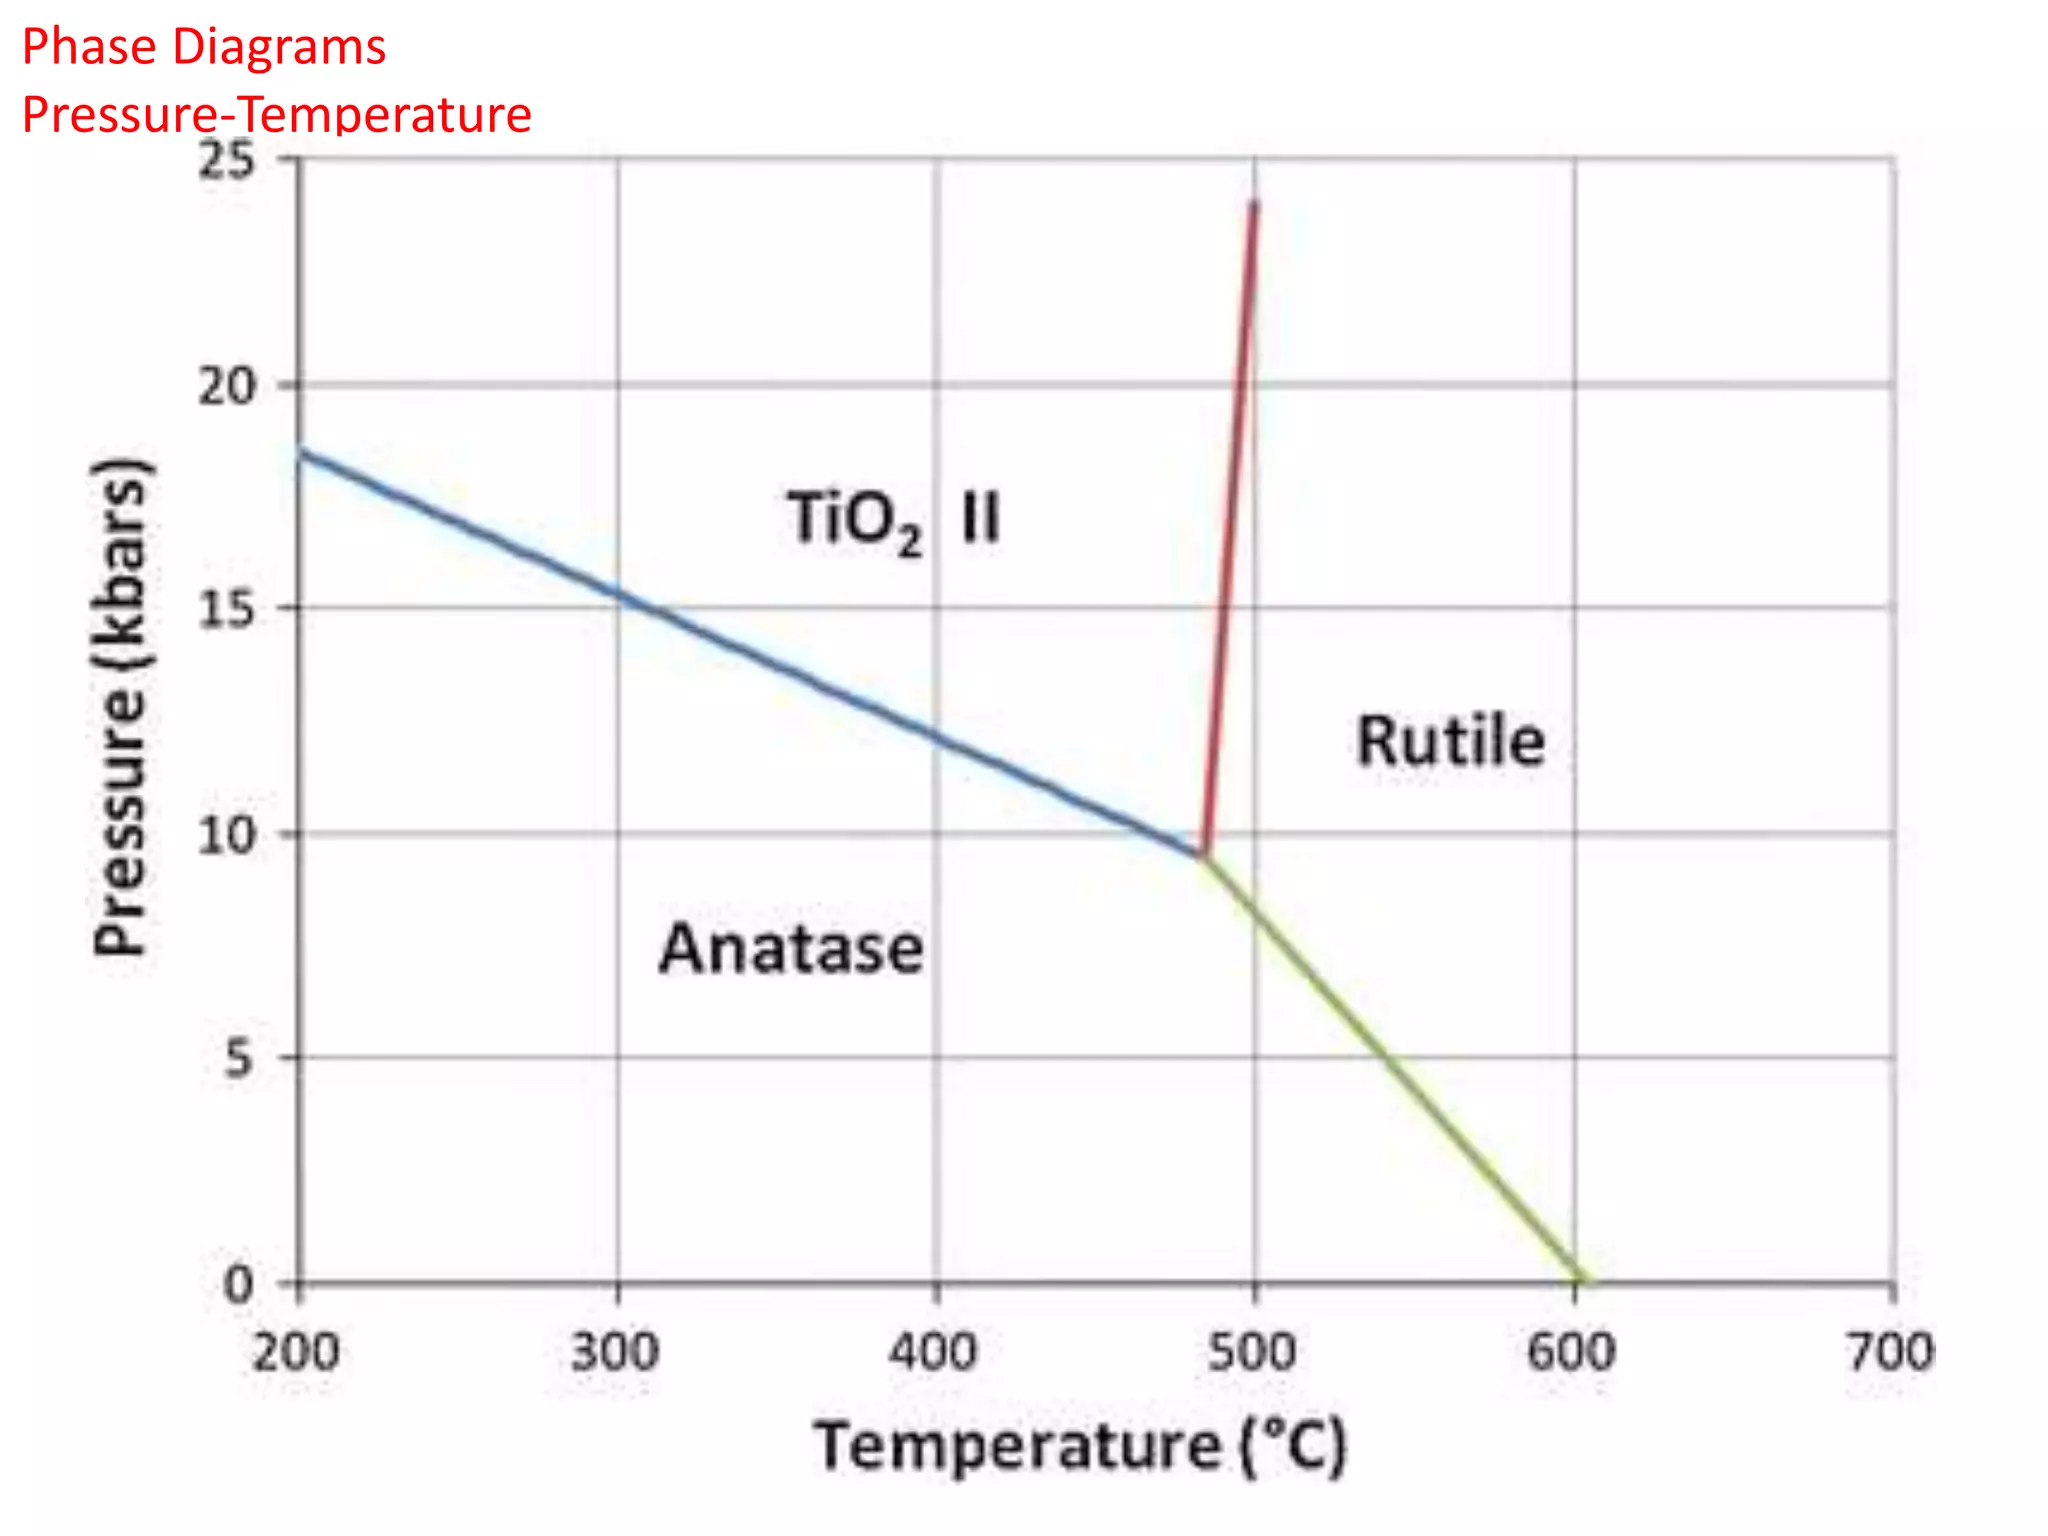
1
Materials Science and Engineering
Instructor: Dr. Sehar Shakir
Contact: sehar@uspcase.nust.edu.pk
Phase Diagrams
Phase diagram is a graphical representation of the physical states of a substance under
different conditions of temperature and pressure. A typical phase diagram has pressure
on the y-axis and temperature on the x-axis. As we cross the lines or curves on the phase
diagram, a phase change occurs. In addition, two states of the substance coexist in
equilibrium on the lines or curves
When two metals are added together in an alloy they usually are not soluble in one
another they make different phases within the alloy, this maybe due to different atomic
radii or crystal structure
Phase Diagrams
Few of the questions that you should be able to understand is
 What phases are present at a given temperature
 Compositions of phases
 Concentrations of different phases
 Melting/solidification in phase diagrams
So lets consider a simple, isomorphous binary phase diagram
Isomorphous: continuous solid
solution i.e from one end to
another at particular
temperature a single phase is
present
Binary: two components in
system
Phase Diagrams
What is a phase?
• Phase is a form of matter that has distinct properties from other phases in the system
• Two different phases can have exactly same composition e.g. ice and liquid water. Both are
H2O, One is crystalline other is liquid.
• We can also have same materials with same composition and same crystalline solids. But
have different phases, e.g. Graphite and carbon, TiO2 Anatase, Brookite, Rutile phase.
Different chemical compositions in one material
E.g. Granite counter tops;
• 2 types of feldspar (pinkish and milky whitish- 2
different phases)
• Quartz; grey color
• Mica; black material
 4 different phases.; Each individual crystal has its
own orientation with respect to each other
Each phase has individual properties e.g. thermal
conductivity of feldspar is different than quartz.
What is a phase?
Phase Diagrams
Phase Diagrams
We have talked about phases,
What are components? Components are chemical components.
e.g. Gold and Nickel
SiO2 and Al2O3 phase diagram, so all the compositions in the middle are mixture of
these two.
Au
SiO2
Ni
Al2O3
Granite
SiO2
Al2O3
Fe2O3
MgO
CaO
Na2O
TiO2
Phase Diagrams
How to read what Phases are present?
The system below has composition A and B present in the system.
At Composition C1, mixture of A and B are present.
At some temperature T1, what phases are present?
We draw two vertical lines as shown.
T1
C1
Phase Diagrams
How to read what Phases are present?
The system below has composition A and B present in the system.
At Composition C1, mixture of A and B are present.
At some temperature T1, what phases are present?
We draw two vertical lines, they coincide where only alpha phase is present
T1
C1
Alpha phase
Phase Diagrams
How to read what Phases are present?
If we heat the system till Temperature T2, we come to a different region where again one
phase is present which is L.
T2
C1
Phase Diagrams
How to read what Phases are present?
What if I am in this region corresponding T3. It is a two phase region. Both liquid and solid
are present.
Tie line intersecting one phase boundary to the other phase boundary and it tells us the
composition of two phases.
T2
C1
T3
Tie line
Composition
of solid
Composition
of liquid
Phase Diagrams
How to read what Phases are present?
What if I am in this region corresponding T3. It is a two phase region. Both liquid and solid
are present
What are the compositions of phases present
T2
C1
T3
Phase Diagrams
T2
C1
T3
What are the concentrations of phases present?
How much of one phase relative to other phase is present (lever rule) or mass balance
calculations
Amount of Liquid phase=A/C
Amount of solid phase=B/C
B
A
C
Phase Diagrams
Solidification and melting temperatures
Phase boundaries: Solidus and Liquidus
Solidus is the phase boundary is the boundary that separates solid from solid+liquid system
Or temperature at which material starts to melt
Liquidus is the phase boundary that separates liquid from solid+liquid system.
As T increases,
system starts to
melt. Starts
melting when T
hits solidus.
When T hits
liquidus,
ompletely melted
When cooling, start with pure liquid, starts to solidify
when hits Liquidus, entirely solid when hits solidus.
Phase Diagrams
L+E2
A B
Lever rule
A/C
B/C
Giving us
concentration of
E2 phase and L
phase
Phase Diagrams
Alpha region
(single
phase)
Pb rich Beta region
(single
phase)
Sn rich
Liquid
region
(single
phase)
Phase Diagrams
Alpha region
(single
phase)
Pb rich Beta region
(single
phase)
Sn rich
Liquid region
(single
phase)
Liquidus line: anything above yellow line is liquid
Solidus: Anything below orange line is solid
Phase Diagrams
Alpha region
(single
phase)
Pb rich
• Another important line shown in green on left and right.
• Solubility limit of Sn in aplha: it means if we add a little bit more tin after the blue spot,
we will be in two phase region for Sn, A+L region if high temperature or at the a+B region
if lower temperature
• Solubility limit of Pb in B, this means if a add a little bit more of Pb, we will be in two
phases, B+L and a+B at higher and lower temperature respectively.
Beta region
(single
phase)
Sn rich
Liquid region
(single phase)
Phase Diagrams
Eutectic Reaction
Eutectic reaction when liquid cools directly into the two phase solid region of a+B.
e.g. at concentration representing the purple line, liquid will first cool into a+L region and
then to a+B region, however, eutectic reaction directly cools to a+B region
Phase Diagrams
Eutectic reaction in Pb-SN phase diagram
Eutectic Temperature: 183 °C
Eutectic composition: nominal composition of eutectic reaction
Liquid is cooling into two phase solid region
Phase Diagrams
Eutectic reaction in Pb-SN phase diagram; phase calculations
Phase Diagrams
Phase Diagrams
Pressure-Temperature

Lec Week 9 Phase diagrams(1).pptx

  • 1.
    1 Materials Science andEngineering Instructor: Dr. Sehar Shakir Contact: sehar@uspcase.nust.edu.pk
  • 2.
    Phase Diagrams Phase diagramis a graphical representation of the physical states of a substance under different conditions of temperature and pressure. A typical phase diagram has pressure on the y-axis and temperature on the x-axis. As we cross the lines or curves on the phase diagram, a phase change occurs. In addition, two states of the substance coexist in equilibrium on the lines or curves When two metals are added together in an alloy they usually are not soluble in one another they make different phases within the alloy, this maybe due to different atomic radii or crystal structure
  • 4.
    Phase Diagrams Few ofthe questions that you should be able to understand is  What phases are present at a given temperature  Compositions of phases  Concentrations of different phases  Melting/solidification in phase diagrams So lets consider a simple, isomorphous binary phase diagram Isomorphous: continuous solid solution i.e from one end to another at particular temperature a single phase is present Binary: two components in system
  • 5.
    Phase Diagrams What isa phase? • Phase is a form of matter that has distinct properties from other phases in the system • Two different phases can have exactly same composition e.g. ice and liquid water. Both are H2O, One is crystalline other is liquid. • We can also have same materials with same composition and same crystalline solids. But have different phases, e.g. Graphite and carbon, TiO2 Anatase, Brookite, Rutile phase.
  • 6.
    Different chemical compositionsin one material E.g. Granite counter tops; • 2 types of feldspar (pinkish and milky whitish- 2 different phases) • Quartz; grey color • Mica; black material  4 different phases.; Each individual crystal has its own orientation with respect to each other Each phase has individual properties e.g. thermal conductivity of feldspar is different than quartz. What is a phase? Phase Diagrams
  • 7.
    Phase Diagrams We havetalked about phases, What are components? Components are chemical components. e.g. Gold and Nickel SiO2 and Al2O3 phase diagram, so all the compositions in the middle are mixture of these two. Au SiO2 Ni Al2O3 Granite SiO2 Al2O3 Fe2O3 MgO CaO Na2O TiO2
  • 8.
    Phase Diagrams How toread what Phases are present? The system below has composition A and B present in the system. At Composition C1, mixture of A and B are present. At some temperature T1, what phases are present? We draw two vertical lines as shown. T1 C1
  • 9.
    Phase Diagrams How toread what Phases are present? The system below has composition A and B present in the system. At Composition C1, mixture of A and B are present. At some temperature T1, what phases are present? We draw two vertical lines, they coincide where only alpha phase is present T1 C1 Alpha phase
  • 10.
    Phase Diagrams How toread what Phases are present? If we heat the system till Temperature T2, we come to a different region where again one phase is present which is L. T2 C1
  • 11.
    Phase Diagrams How toread what Phases are present? What if I am in this region corresponding T3. It is a two phase region. Both liquid and solid are present. Tie line intersecting one phase boundary to the other phase boundary and it tells us the composition of two phases. T2 C1 T3 Tie line Composition of solid Composition of liquid
  • 12.
    Phase Diagrams How toread what Phases are present? What if I am in this region corresponding T3. It is a two phase region. Both liquid and solid are present What are the compositions of phases present T2 C1 T3
  • 13.
    Phase Diagrams T2 C1 T3 What arethe concentrations of phases present? How much of one phase relative to other phase is present (lever rule) or mass balance calculations Amount of Liquid phase=A/C Amount of solid phase=B/C B A C
  • 14.
    Phase Diagrams Solidification andmelting temperatures Phase boundaries: Solidus and Liquidus Solidus is the phase boundary is the boundary that separates solid from solid+liquid system Or temperature at which material starts to melt Liquidus is the phase boundary that separates liquid from solid+liquid system. As T increases, system starts to melt. Starts melting when T hits solidus. When T hits liquidus, ompletely melted When cooling, start with pure liquid, starts to solidify when hits Liquidus, entirely solid when hits solidus.
  • 15.
    Phase Diagrams L+E2 A B Leverrule A/C B/C Giving us concentration of E2 phase and L phase
  • 16.
    Phase Diagrams Alpha region (single phase) Pbrich Beta region (single phase) Sn rich Liquid region (single phase)
  • 17.
    Phase Diagrams Alpha region (single phase) Pbrich Beta region (single phase) Sn rich Liquid region (single phase) Liquidus line: anything above yellow line is liquid Solidus: Anything below orange line is solid
  • 18.
    Phase Diagrams Alpha region (single phase) Pbrich • Another important line shown in green on left and right. • Solubility limit of Sn in aplha: it means if we add a little bit more tin after the blue spot, we will be in two phase region for Sn, A+L region if high temperature or at the a+B region if lower temperature • Solubility limit of Pb in B, this means if a add a little bit more of Pb, we will be in two phases, B+L and a+B at higher and lower temperature respectively. Beta region (single phase) Sn rich Liquid region (single phase)
  • 19.
    Phase Diagrams Eutectic Reaction Eutecticreaction when liquid cools directly into the two phase solid region of a+B. e.g. at concentration representing the purple line, liquid will first cool into a+L region and then to a+B region, however, eutectic reaction directly cools to a+B region
  • 20.
    Phase Diagrams Eutectic reactionin Pb-SN phase diagram Eutectic Temperature: 183 °C Eutectic composition: nominal composition of eutectic reaction Liquid is cooling into two phase solid region
  • 21.
    Phase Diagrams Eutectic reactionin Pb-SN phase diagram; phase calculations
  • 22.
  • 23.