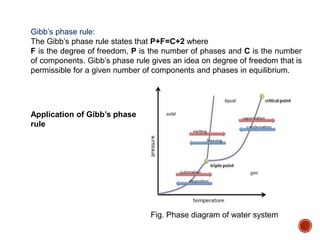
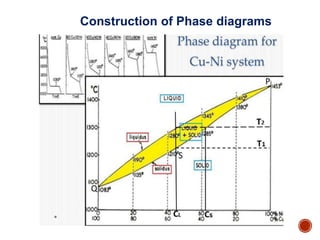
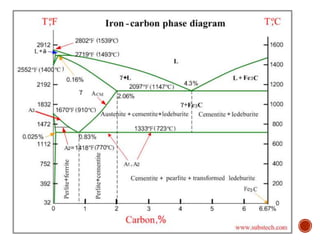
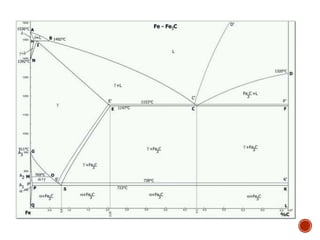
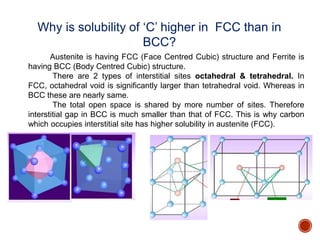
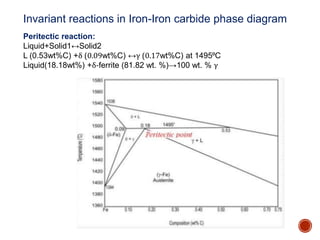
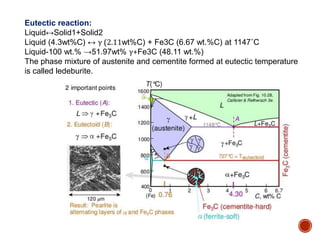
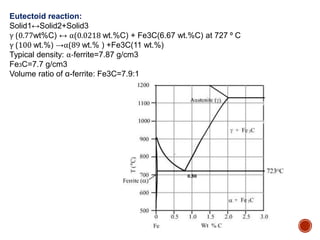
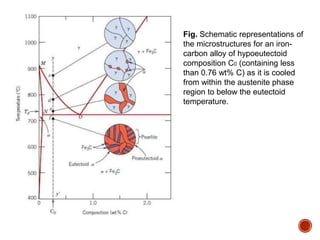
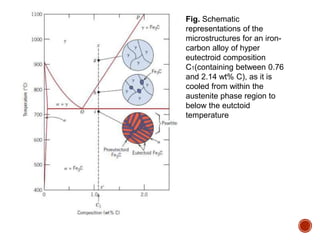
SlideShare a Scribd company logo
Malaviya National Institute of Technology Jaipur
Submitted by
Basitti Hitesh
2017PMT5094Submitted to
Dr. V.K.Sharma
Heat Treatment, Phases, Microstructures and its properties
Phase
A Phase in a material in terms of its microstructure is a region that differs in
structure and/or composition from another region.
Phase diagram
Phase diagrams are graphical representations from which it is possible to know
number and types of phases present in a material at various temperature,
pressure and composition. The following important information can be obtained
from phase diagrams:
 Number and types of phases present at different compositions and
temperatures under slow cooling (equilibrium) conditions.
Equilibrium solid solubility of one element in another.
Temperature at which an alloy starts solidifying undergoing slow cooling and
also the temperature range within which solidification take place.
Temperature at which different phases start melting and regions of stability of
phases in terms of temperature and composition.
Gibb’s phase rule:
The Gibb’s phase rule states that P+F=C+2 where
F is the degree of freedom, P is the number of phases and C is the number
of components. Gibb’s phase rule gives an idea on degree of freedom that is
permissible for a given number of components and phases in equilibrium.
Application of Gibb’s phase
rule
Fig. Phase diagram of water system
At triple point of water system, three phases are in equilibrium and water is a one
component system.
Now by applying Gibb’s phase rule F=C-P+2, we can write, for invariant
points-
F=1-3+2, i.e., F=0
Hence for this system at triple point, degree of freedom is zero which means
none of the variables viz. temperature and pressure can be changed and still
keeps three phases of coexistence. So triple point is called an invariant point.
Since most binary phase diagrams mainly deals with temperature-composition at
constant pressure at 1 atm, Gibb’s phase rule expressed as P+F=C+1.
Concept of solid solution:
An alloy is a mixture of two or more metals or a metal and nonmetal. Alloys
may have simple as well as complex structure. Solid solution is a simple type of
alloy. A solid solution is solid that consists of two or more elements atomically
dispersed in a single phase structure.
In other words, solid solution can be defined as an alloy of two or more metals,
or a metal and a nonmetal which is a single phase atomic mixture. There are
two types of solid solution –
Substitutional Solid Solution
Interstitial Solid Solution
Substitutional solid solution: In this type, solute atoms of one element can
substitute parent solvent atoms of another element. In Cu-Ni solid solution, Cu
atoms can replace Ni atoms in crystal lattice. The crystal structure of parent
solvent may remain unchanged, nut lattice may be distorted by the solute
atoms. This happens when there is significant variation in atomic diameters of
parent solvent atom and solute atoms.
Hume- Rothery, an English Metallurgist studied various alloy systems
including isomorphous Cu-Ni system and formulated the following
conditions for two elements to have complete solid solubility:
1) The crystal structure of each element of the solid solution must be the
same.
2) The size of the atoms of each of two elements must not differ by more
than 15%.
3) There should not be appreciable difference in electronegativities of the
two elements.
4) The elements should have the same valence.
Interstitial Solid Solution: This type of solid solution is formed when solute
atoms enter into the interstices of solvent atom lattice. Hydrogen, Carbon,
Nitrogen and Oxygen atoms are common which form interstitial solid
solutions.
Construction of Phase diagrams
The phase composition depending on the temperature and the carbon
content can be read off this dual diagram in which the stable system iron-
graphite (dotted lines) and the meta-stable system iron-carbide (solid lines)
are shown together.
The closeness of the equilibrium lines which correspond to one another
indicates that the difference in the stability of carbide and graphite in the
alloys is not large. Therefore, the carbon may be dissolved in the iron
after solidification or, however, may precipitate in the form of graphite.
Furthermore, it can also occur in the structure in a bound form as iron
carbide (Fe3C) and is dissolved in the α and γ solid solution in both systems.
The eutectic temperature of the iron-graphite reaction is considerably higher
than that of the iron-cementite reaction. In the case of slower cooling, mainly
graphite forms, in the case of accelerated heat dissipation, on the other hand,
mainly cementite. During annealing, graphite may form, reducing
the cementite content. The tendency for graphite to form
from cementite shows that iron or iron-rich solid solutions only form a stable
equilibrium with free carbon (graphite).
Nature of Duality in Fe-Fe3C phase diagram
Purpose of the iron-carbon phase diagram?
To know what will be the crystal structure and physical and chemical
properties of iron at known carbon percentage and temperature. provided
that slow and uniform cooling rate is there and no quenching.
Different phases present in Iron-Iron carbide system
‘γ’ phase or Austenite:
Interstitial solid solution of carbon in iron of FCC crystal structure having
solubility limit of 2.11 wt.% at 1147⁰C with respect to cementite. The stability of
the phase ranges between 727-1495⁰C and solubility ranges 0-0.77 wt.%C with
respect to alpha ferrite and 0.77-2.11 wt.% C with respect to cementite, at 0
wt.%C the stability ranges from 910-1394⁰C.
α - ferrite:
Interstitial solid solution of carbon in iron of BCC crystal structure (α-iron)
having solubility limit of 0.0218 wt % C at 727⁰C with respect to austenite.
The stability of the phase ranges between low temperatures to 910⁰C, and
solubility ranges 0.008 wt. % C at room temperature to 0.0218 wt%C at 727⁰C
with respect to cementite.
Pearlite:
This phase is a product of eutectoid decomposition of austenite into mixture of
ferrite and cementite (Fe3C).
Delta ferrite:
The high-temperature ferrite is labeled delta-iron, even though its crystal
structure is identical to that of alpha-ferrite. The delta-ferrite remains stable
until it melts at 1538 °C. Maximum solubility is 0.1 wt% C at 1495 °C.
Fe3C or Cementite:
Interstitial intermetallic compound of C & Fe with a carbon content of 6.67
wt.% and orthorhombic structure consisting of 12 iron atoms and 4 carbon
atoms in the unit cell. Stability of the phase ranges from low temperatures to
1227°C. This is a chemical compound of high hardness. In steel, it can be
associated with carbides of other elements, such as Mn.
Ledeburite :
Eutectic mixture of austenite and cementite is known as ledeburite.
Actually there is no difference in beta phase and alpha phase when we talk
about crystal structure of iron. Beta phase has the same structure as the
alpha phase. The only difference is the magnetic properties which are
absent in beta phase due to the expanded lattice parameter.
Why beta phase is not there in iron carbon phase
diagram?
Why is solubility of ‘C’ higher in FCC than in
BCC?
Austenite is having FCC (Face Centred Cubic) structure and Ferrite is
having BCC (Body Centred Cubic) structure.
There are 2 types of interstitial sites octahedral & tetrahedral. In
FCC, octahedral void is significantly larger than tetrahedral void. Whereas in
BCC these are nearly same.
The total open space is shared by more number of sites. Therefore
interstitial gap in BCC is much smaller than that of FCC. This is why carbon
which occupies interstitial site has higher solubility in austenite (FCC).
Peritectic reaction:
Liquid+Solid1↔Solid2
L (0.53wt%C) +δ (0.09wt%C) ↔γ (0.17wt%C) at 1495⁰C
Liquid(18.18wt%) +δ-ferrite (81.82 wt. %)→100 wt. % γ
Invariant reactions in Iron-Iron carbide phase diagram
Eutectic reaction:
Liquid↔Solid1+Solid2
Liquid (4.3wt%C) ↔ γ (2.11wt%C) + Fe3C (6.67 wt.%C) at 1147˚C
Liquid-100 wt.% →51.97wt% γ+Fe3C (48.11 wt.%)
The phase mixture of austenite and cementite formed at eutectic temperature
is called ledeburite.
Eutectoid reaction:
Solid1↔Solid2+Solid3
γ (0.77wt%C) ↔ α(0.0218 wt.%C) + Fe3C(6.67 wt.%C) at 727 ⁰ C
γ (100 wt.%) →α(89 wt.% ) +Fe3C(11 wt.%)
Typical density: α-ferrite=7.87 g/cm3
Fe3C=7.7 g/cm3
Volume ratio of α-ferrite: Fe3C=7.9:1
Sometimes the letters c, e, or r are included:
• Accm — In hypereutectoid steel, the temperature at which the solution of
cementite in austenite is completed during heating.
• Ac1 — The temperature at which austenite begins to form during heating, with
the c being derived from the French chauffant.
• Ac3 — The temperature at which transformation of ferrite to austenite is
completed during heating.
• Aecm, Ae1, Ae3 — The temperatures of phase changes at equilibrium.
• Arcm — In hypereutectoid steel, the temperature at which precipitation of
cementite starts during cooling, with the r being derived from the
French refroidissant.
• Ar1 — The temperature at which transformation of austenite to ferrite or to
ferrite plus cementite is completed during cooling.
• Ar3 — The temperature at which austenite begins to transform to ferrite during
cooling.
• Ar4 — The temperature at which delta-ferrite transforms to austenite during
cooling.
 A1 = Temperature at which austenite begins to form during heating
 A2 = Temperature at which alpha iron becomes non-magnetic
 A3 = Temperature at which transformation of alpha iron to austenite is completed
during heating
 A4 = Temperature at which austenite transforms to delta ferrite
 Am = Temperature at which solutionizing of cementite in austenite is
complete
Critical Temperatures
Phase transformations may be classified according to whether or not
there is any change in composition for the phases involved. Those for
which there are no compositional alterations are said to be congruent
transformations. Conversely, for incongruent
transformations, at least one of the phases will experience a change
in composition. Examples of congruent transformations include
allotropic transformations and melting of pure materials. Eutectic and
eutectoid reactions, as well as the melting of an alloy that belongs to an
isomorphous system, all represent incongruent transformations.
Congruent Phase Transformation
 The microstructure of crystalline materials is defined by the type, structure,
number, shape and topological arrangement of phases and/or lattice
defects .
 Elements of microstructure: Point defects, point-defect clusters,
dislocations, stacking faults, grain boundaries, interphase interfaces are
important elements of the microstructure of most materials.
Definition of Microstructure
 When Fe-alloy of 0.77% of C is cooled
slowly it transforms from single phase
of austenite to pearlite structure, a
lamellar or layered structure of two
phases: ferrite and cementite.
 In the micrograph, dark regions
are cementite and bright regions
are ferrite
Microstructure of Eutectoid steel
 Layered structures are formed
because of redistribution of C
atoms between ferrite (0.022 wt
%) and cementite (6.7 wt %) by
diffusion.
 Mechanical properties of
pearlite are in between that of
ferrite (soft) and cementite
(brittle)
Formation of layered structure !
Fig. Photomicrographs of (a) α ferrite and (b) austenite (325X)
(copyright 1971 by united states steel corporation)
Fig. Photomicrograph of a
eutectoid steel showing the
pearlite microstructure consisting
of alternating layers of α ferrite
(the light phase) and Fe3C (thin
layers most of which appear
dark). 500X. (Reproduced with
permission from metals
handbook, 9th edition, Vol.9,
Metallography and
Microstructures, American
Society for Metals, Materials
park, OH, 1985.)
Fig. Schematic representations of
the microstructures for an iron-
carbon alloy of hypoeutectoid
composition C0 (containing less
than 0.76 wt% C) as it is cooled
from within the austenite phase
region to below the eutectoid
temperature.
Fig. Photomicrograph of a 0.38 wt% C steel having a microstructure consisting
of pearlite and pro-eutectoid ferrite. 635X. (Photomicrograph courtesy of
Republic Steel Corporation
Fig. Schematic
representations of the
microstructures for an iron-
carbon alloy of hyper
eutectroid composition
C1(containing between 0.76
and 2.14 wt% C), as it is
cooled from within the
austenite phase region to
below the eutctoid
temperature
Fig. Photomicrograph of a
1.4 wt% C steel having a
microstructure consisting
of a white proeutectoid
cementite network
surrounding the pearlite
colonies. 1000X.
(Copyright 1971 by United
States Steel Corporation
Fig. Microstructure of DP steel
Temperature-Time Transformation diagram
Construction of TTT diagram
Representatives TTT diagrams
MARTENSITIC TRANSFORMATION
• Martensite: austenite quenched to roomtemperature.
• Austenite to martensite does not involve diffusion no activation: athermal
transformation.
• Each atom displaces small (sub-atomic) distance to transform FCC ƴ-Fe (austenite) to
martensite, a Body Centered Tetragonal (BCT) unit cell (like BCC, but one unit cell axis
longer than other two).
• Martensite is metastable - persists indefinitely at room T: transforms to equilibrium
phaseson at elevated temperature
• Sincemartensite is ametastable phase, it does not appear in Fe-Cphase
diagram. The amount of martensite formed is a function of the temperature to
which the sample is quenched and not of time.
• The shear changes the shape of the transforming region:
→ results in considerable amount of shear energy
→ plate-like shape of Martensite
The martensitic transformation involves the sudden reorientation of C and
Fe atoms from the FCC solid solution of γ-Fe (austenite) to a body
centered tetragonal (BCT) solid solution (martensite)
Austenite to Martensite
Fig. Microstructure of
martensite transformation
in Fe-31wt%Ni-0.02wt%C
transformed by cooling into
liquid nitrogen. Micrograph
obtained by J. R. C.
Guimarães.
Martensite is so brittle it needs to be modified for practical applications. Done by heating
to 250-650oC for some time.
Temperedmartensite,extremely fine-grained,well dispersed cementite grains in a
ferrite matrix.
Tempered martensite is more ductile.
Mechanical properties depend upon cementite particle size: fewer, larger
particles means less boundary area and softer, more ductile material - eventual
limit is spheroidite.
Particle size increases with higher tempering temperature and/or longer time
(more carbon diffusion)
Tempered Martensite
 Tempered martensite is less brittle than martensite; tempered at 594°C.
 Tempering reduces internal stresses caused by quenching.
 The small particles are cementite; the matrix is α-ferrite. US Steel Corp.
4340 steel
 Bainite is a Plate-like microstructure that forms in steels at temperatures
of 250–550 °C (depending on alloy content).
 First described by E. S. Davenport and Edgar Bain, it is one of the
products that may form when austenite (the face centered cubic crystal
structure of iron) is cooled past a critical temperature.
 This critical temperature is 1000 K (727 °C) in plain carbon steels.
 Davenport and Bain originally described the microstructure as being similar
in appearance to tempered martensite.
 A fine non-lamellar structure, bainite commonly consists of cementite
and dislocation-rich ferrite.
 The high concentration of dislocations in the ferrite present in bainite
makes this ferrite harder than it normally would be.
BAINITE
Formation of Bainite
Fig. Microstructure of Bainite
(a) Upper Bainite (b) Lower Bainite (c) Retained austenite
Thank you

More Related Content

What's hot

Lecture: Binary phase diagrams and Gibbs free energy curves
Lecture: Binary phase diagrams and Gibbs free energy curvesLecture: Binary phase diagrams and Gibbs free energy curves
Lecture: Binary phase diagrams and Gibbs free energy curves
Nikolai Priezjev
 
05 dislocation theory
05 dislocation theory05 dislocation theory
05 dislocation theory
Muhammad Feroze
 
TTT DIAGRAM
TTT DIAGRAMTTT DIAGRAM
Eutectic Solidification
Eutectic SolidificationEutectic Solidification
Eutectic Solidification
Krishna Hansdah
 
TTT diagram
TTT diagramTTT diagram
Phase Transformation: Lecture Review of Phase Diagrams
Phase Transformation: Lecture Review of Phase Diagrams Phase Transformation: Lecture Review of Phase Diagrams
Phase Transformation: Lecture Review of Phase Diagrams
NED University of Engineering and Technology
 
Iron Carbon diagram
Iron Carbon diagramIron Carbon diagram
Iron Carbon diagram
Naman Dave
 
TOOL STEELS & THEIR HEAT TREATMENT
TOOL STEELS & THEIR HEAT TREATMENTTOOL STEELS & THEIR HEAT TREATMENT
TOOL STEELS & THEIR HEAT TREATMENT
SWAPNIL NIGAM
 
High Temperature Materials
High Temperature MaterialsHigh Temperature Materials
High Temperature Materials
Shruti Chaudhari
 
Steel Making: Lecture deoxidation
Steel Making: Lecture deoxidationSteel Making: Lecture deoxidation
Steel Making: Lecture deoxidation
NED University of Engineering and Technology
 
03 magnesium and magnesium alloys
03 magnesium and magnesium alloys03 magnesium and magnesium alloys
03 magnesium and magnesium alloys
cha3068
 
titanium and titanium alloys
 titanium and titanium alloys titanium and titanium alloys
titanium and titanium alloys
Ali Zamel
 
Aluminium and it’s alloys
Aluminium and it’s alloysAluminium and it’s alloys
Aluminium and it’s alloys
Kunal Rathod
 
Recovery recrystallization and grain growth
Recovery recrystallization and grain growthRecovery recrystallization and grain growth
Recovery recrystallization and grain growth
Prem Kumar Soni
 
Diffusion bonding
Diffusion bondingDiffusion bonding
Diffusion bonding
Arun negemiya
 
Engineering ceramics
Engineering ceramicsEngineering ceramics
Engineering ceramics
Gopinath Guru
 
CCt Curve (continuos cooling transformation)
CCt Curve (continuos cooling transformation)CCt Curve (continuos cooling transformation)
CCt Curve (continuos cooling transformation)
Avinash Navin
 
Aluminium and its alloys
Aluminium and its alloysAluminium and its alloys
Aluminium and its alloys
Daniel Cuevas
 
Steel Making: Ingot casting
Steel Making: Ingot casting Steel Making: Ingot casting
Steel Making: Ingot casting
NED University of Engineering and Technology
 
Binary phase diagrams
Binary phase diagramsBinary phase diagrams
Binary phase diagrams
anandpratap
 

What's hot (20)

Lecture: Binary phase diagrams and Gibbs free energy curves
Lecture: Binary phase diagrams and Gibbs free energy curvesLecture: Binary phase diagrams and Gibbs free energy curves
Lecture: Binary phase diagrams and Gibbs free energy curves
 
05 dislocation theory
05 dislocation theory05 dislocation theory
05 dislocation theory
 
TTT DIAGRAM
TTT DIAGRAMTTT DIAGRAM
TTT DIAGRAM
 
Eutectic Solidification
Eutectic SolidificationEutectic Solidification
Eutectic Solidification
 
TTT diagram
TTT diagramTTT diagram
TTT diagram
 
Phase Transformation: Lecture Review of Phase Diagrams
Phase Transformation: Lecture Review of Phase Diagrams Phase Transformation: Lecture Review of Phase Diagrams
Phase Transformation: Lecture Review of Phase Diagrams
 
Iron Carbon diagram
Iron Carbon diagramIron Carbon diagram
Iron Carbon diagram
 
TOOL STEELS & THEIR HEAT TREATMENT
TOOL STEELS & THEIR HEAT TREATMENTTOOL STEELS & THEIR HEAT TREATMENT
TOOL STEELS & THEIR HEAT TREATMENT
 
High Temperature Materials
High Temperature MaterialsHigh Temperature Materials
High Temperature Materials
 
Steel Making: Lecture deoxidation
Steel Making: Lecture deoxidationSteel Making: Lecture deoxidation
Steel Making: Lecture deoxidation
 
03 magnesium and magnesium alloys
03 magnesium and magnesium alloys03 magnesium and magnesium alloys
03 magnesium and magnesium alloys
 
titanium and titanium alloys
 titanium and titanium alloys titanium and titanium alloys
titanium and titanium alloys
 
Aluminium and it’s alloys
Aluminium and it’s alloysAluminium and it’s alloys
Aluminium and it’s alloys
 
Recovery recrystallization and grain growth
Recovery recrystallization and grain growthRecovery recrystallization and grain growth
Recovery recrystallization and grain growth
 
Diffusion bonding
Diffusion bondingDiffusion bonding
Diffusion bonding
 
Engineering ceramics
Engineering ceramicsEngineering ceramics
Engineering ceramics
 
CCt Curve (continuos cooling transformation)
CCt Curve (continuos cooling transformation)CCt Curve (continuos cooling transformation)
CCt Curve (continuos cooling transformation)
 
Aluminium and its alloys
Aluminium and its alloysAluminium and its alloys
Aluminium and its alloys
 
Steel Making: Ingot casting
Steel Making: Ingot casting Steel Making: Ingot casting
Steel Making: Ingot casting
 
Binary phase diagrams
Binary phase diagramsBinary phase diagrams
Binary phase diagrams
 

Similar to Heat treatment, phases, microstructures and its properties

CONSTITUTION OF ALLOYS
CONSTITUTION OF ALLOYSCONSTITUTION OF ALLOYS
CONSTITUTION OF ALLOYS
Muthukumar V
 
DJJ3213 MATERIAL SCIENCE CHAPTER 4 NOTE.ppt
DJJ3213 MATERIAL SCIENCE CHAPTER 4 NOTE.pptDJJ3213 MATERIAL SCIENCE CHAPTER 4 NOTE.ppt
DJJ3213 MATERIAL SCIENCE CHAPTER 4 NOTE.ppt
fieyzaadn
 
Iron iron carbon diagram
Iron iron carbon diagramIron iron carbon diagram
Iron iron carbon diagram
Dharmendra Kumar Madhukar
 
UNIT - I.pptx
UNIT - I.pptxUNIT - I.pptx
UNIT - I.pptx
Muthukumar P
 
IRON CARBON DIAGRAM PPT.pptx
IRON CARBON DIAGRAM PPT.pptxIRON CARBON DIAGRAM PPT.pptx
IRON CARBON DIAGRAM PPT.pptx
glorialidwinbdacemec
 
Phase Diagram
Phase DiagramPhase Diagram
Phase Diagram
Akash Patel
 
diagram fasa fe-fe3c.pdf
diagram fasa fe-fe3c.pdfdiagram fasa fe-fe3c.pdf
diagram fasa fe-fe3c.pdf
FirgiawanF
 
Alloys and phase diagrams
Alloys and phase diagramsAlloys and phase diagrams
Alloys and phase diagrams
Ratnadeepsinh Jadeja
 
Lect-4 Iron Carbon Equilibrium Diagram
Lect-4 Iron Carbon Equilibrium DiagramLect-4 Iron Carbon Equilibrium Diagram
Lect-4 Iron Carbon Equilibrium Diagram
rambansal37
 
14691 a03e6 mse2
14691 a03e6 mse214691 a03e6 mse2
14691 a03e6 mse2
Seela Sainath
 
TTT curves and CCT curves relation with fatigue
TTT curves and CCT curves relation with fatigueTTT curves and CCT curves relation with fatigue
TTT curves and CCT curves relation with fatigue
Seela Sainath
 
14691 a03e6 mse2
14691 a03e6 mse214691 a03e6 mse2
14691 a03e6 mse2
Seela Sainath
 
Ch 27.5 iron carbon equilibrium diagram
Ch 27.5 iron carbon equilibrium diagramCh 27.5 iron carbon equilibrium diagram
Ch 27.5 iron carbon equilibrium diagram
Nandan Choudhary
 
Fe-C Binary Phase Diagram
Fe-C Binary Phase DiagramFe-C Binary Phase Diagram
Fe-C Binary Phase Diagram
Luís Rita
 
Phase diagrams
Phase diagramsPhase diagrams
Phase diagrams
NEERAJ PARMAR
 
Chap1,part2
Chap1,part2Chap1,part2
Chap1,part2
NEERAJ PARMAR
 
Ironcarbondia
IroncarbondiaIroncarbondia
Ironcarbondia
temkin abdlkader
 
Iron carbon diagram presentation
Iron carbon diagram presentationIron carbon diagram presentation
Iron carbon diagram presentation
SURESH M. PATEL
 
Iron Carbon Equilibrium Diagram
Iron Carbon Equilibrium DiagramIron Carbon Equilibrium Diagram
Iron Carbon Equilibrium Diagram
Aditi Rana
 
Iron carbon diagram
Iron  carbon diagramIron  carbon diagram
Iron carbon diagram
Rahul Sen
 

Similar to Heat treatment, phases, microstructures and its properties (20)

CONSTITUTION OF ALLOYS
CONSTITUTION OF ALLOYSCONSTITUTION OF ALLOYS
CONSTITUTION OF ALLOYS
 
DJJ3213 MATERIAL SCIENCE CHAPTER 4 NOTE.ppt
DJJ3213 MATERIAL SCIENCE CHAPTER 4 NOTE.pptDJJ3213 MATERIAL SCIENCE CHAPTER 4 NOTE.ppt
DJJ3213 MATERIAL SCIENCE CHAPTER 4 NOTE.ppt
 
Iron iron carbon diagram
Iron iron carbon diagramIron iron carbon diagram
Iron iron carbon diagram
 
UNIT - I.pptx
UNIT - I.pptxUNIT - I.pptx
UNIT - I.pptx
 
IRON CARBON DIAGRAM PPT.pptx
IRON CARBON DIAGRAM PPT.pptxIRON CARBON DIAGRAM PPT.pptx
IRON CARBON DIAGRAM PPT.pptx
 
Phase Diagram
Phase DiagramPhase Diagram
Phase Diagram
 
diagram fasa fe-fe3c.pdf
diagram fasa fe-fe3c.pdfdiagram fasa fe-fe3c.pdf
diagram fasa fe-fe3c.pdf
 
Alloys and phase diagrams
Alloys and phase diagramsAlloys and phase diagrams
Alloys and phase diagrams
 
Lect-4 Iron Carbon Equilibrium Diagram
Lect-4 Iron Carbon Equilibrium DiagramLect-4 Iron Carbon Equilibrium Diagram
Lect-4 Iron Carbon Equilibrium Diagram
 
14691 a03e6 mse2
14691 a03e6 mse214691 a03e6 mse2
14691 a03e6 mse2
 
TTT curves and CCT curves relation with fatigue
TTT curves and CCT curves relation with fatigueTTT curves and CCT curves relation with fatigue
TTT curves and CCT curves relation with fatigue
 
14691 a03e6 mse2
14691 a03e6 mse214691 a03e6 mse2
14691 a03e6 mse2
 
Ch 27.5 iron carbon equilibrium diagram
Ch 27.5 iron carbon equilibrium diagramCh 27.5 iron carbon equilibrium diagram
Ch 27.5 iron carbon equilibrium diagram
 
Fe-C Binary Phase Diagram
Fe-C Binary Phase DiagramFe-C Binary Phase Diagram
Fe-C Binary Phase Diagram
 
Phase diagrams
Phase diagramsPhase diagrams
Phase diagrams
 
Chap1,part2
Chap1,part2Chap1,part2
Chap1,part2
 
Ironcarbondia
IroncarbondiaIroncarbondia
Ironcarbondia
 
Iron carbon diagram presentation
Iron carbon diagram presentationIron carbon diagram presentation
Iron carbon diagram presentation
 
Iron Carbon Equilibrium Diagram
Iron Carbon Equilibrium DiagramIron Carbon Equilibrium Diagram
Iron Carbon Equilibrium Diagram
 
Iron carbon diagram
Iron  carbon diagramIron  carbon diagram
Iron carbon diagram
 

Recently uploaded

Redefining brain tumor segmentation: a cutting-edge convolutional neural netw...
Redefining brain tumor segmentation: a cutting-edge convolutional neural netw...Redefining brain tumor segmentation: a cutting-edge convolutional neural netw...
Redefining brain tumor segmentation: a cutting-edge convolutional neural netw...
IJECEIAES
 
UNLOCKING HEALTHCARE 4.0: NAVIGATING CRITICAL SUCCESS FACTORS FOR EFFECTIVE I...
UNLOCKING HEALTHCARE 4.0: NAVIGATING CRITICAL SUCCESS FACTORS FOR EFFECTIVE I...UNLOCKING HEALTHCARE 4.0: NAVIGATING CRITICAL SUCCESS FACTORS FOR EFFECTIVE I...
UNLOCKING HEALTHCARE 4.0: NAVIGATING CRITICAL SUCCESS FACTORS FOR EFFECTIVE I...
amsjournal
 
Advanced control scheme of doubly fed induction generator for wind turbine us...
Advanced control scheme of doubly fed induction generator for wind turbine us...Advanced control scheme of doubly fed induction generator for wind turbine us...
Advanced control scheme of doubly fed induction generator for wind turbine us...
IJECEIAES
 
LLM Fine Tuning with QLoRA Cassandra Lunch 4, presented by Anant
LLM Fine Tuning with QLoRA Cassandra Lunch 4, presented by AnantLLM Fine Tuning with QLoRA Cassandra Lunch 4, presented by Anant
LLM Fine Tuning with QLoRA Cassandra Lunch 4, presented by Anant
Anant Corporation
 
Casting-Defect-inSlab continuous casting.pdf
Casting-Defect-inSlab continuous casting.pdfCasting-Defect-inSlab continuous casting.pdf
Casting-Defect-inSlab continuous casting.pdf
zubairahmad848137
 
ML Based Model for NIDS MSc Updated Presentation.v2.pptx
ML Based Model for NIDS MSc Updated Presentation.v2.pptxML Based Model for NIDS MSc Updated Presentation.v2.pptx
ML Based Model for NIDS MSc Updated Presentation.v2.pptx
JamalHussainArman
 
ISPM 15 Heat Treated Wood Stamps and why your shipping must have one
ISPM 15 Heat Treated Wood Stamps and why your shipping must have oneISPM 15 Heat Treated Wood Stamps and why your shipping must have one
ISPM 15 Heat Treated Wood Stamps and why your shipping must have one
Las Vegas Warehouse
 
gray level transformation unit 3(image processing))
gray level transformation unit 3(image processing))gray level transformation unit 3(image processing))
gray level transformation unit 3(image processing))
shivani5543
 
Properties Railway Sleepers and Test.pptx
Properties Railway Sleepers and Test.pptxProperties Railway Sleepers and Test.pptx
Properties Railway Sleepers and Test.pptx
MDSABBIROJJAMANPAYEL
 
CompEx~Manual~1210 (2).pdf COMPEX GAS AND VAPOURS
CompEx~Manual~1210 (2).pdf COMPEX GAS AND VAPOURSCompEx~Manual~1210 (2).pdf COMPEX GAS AND VAPOURS
CompEx~Manual~1210 (2).pdf COMPEX GAS AND VAPOURS
RamonNovais6
 
Comparative analysis between traditional aquaponics and reconstructed aquapon...
Comparative analysis between traditional aquaponics and reconstructed aquapon...Comparative analysis between traditional aquaponics and reconstructed aquapon...
Comparative analysis between traditional aquaponics and reconstructed aquapon...
bijceesjournal
 
BRAIN TUMOR DETECTION for seminar ppt.pdf
BRAIN TUMOR DETECTION for seminar ppt.pdfBRAIN TUMOR DETECTION for seminar ppt.pdf
BRAIN TUMOR DETECTION for seminar ppt.pdf
LAXMAREDDY22
 
Harnessing WebAssembly for Real-time Stateless Streaming Pipelines
Harnessing WebAssembly for Real-time Stateless Streaming PipelinesHarnessing WebAssembly for Real-time Stateless Streaming Pipelines
Harnessing WebAssembly for Real-time Stateless Streaming Pipelines
Christina Lin
 
哪里办理(csu毕业证书)查尔斯特大学毕业证硕士学历原版一模一样
哪里办理(csu毕业证书)查尔斯特大学毕业证硕士学历原版一模一样哪里办理(csu毕业证书)查尔斯特大学毕业证硕士学历原版一模一样
哪里办理(csu毕业证书)查尔斯特大学毕业证硕士学历原版一模一样
insn4465
 
DEEP LEARNING FOR SMART GRID INTRUSION DETECTION: A HYBRID CNN-LSTM-BASED MODEL
DEEP LEARNING FOR SMART GRID INTRUSION DETECTION: A HYBRID CNN-LSTM-BASED MODELDEEP LEARNING FOR SMART GRID INTRUSION DETECTION: A HYBRID CNN-LSTM-BASED MODEL
DEEP LEARNING FOR SMART GRID INTRUSION DETECTION: A HYBRID CNN-LSTM-BASED MODEL
gerogepatton
 
Embedded machine learning-based road conditions and driving behavior monitoring
Embedded machine learning-based road conditions and driving behavior monitoringEmbedded machine learning-based road conditions and driving behavior monitoring
Embedded machine learning-based road conditions and driving behavior monitoring
IJECEIAES
 
Manufacturing Process of molasses based distillery ppt.pptx
Manufacturing Process of molasses based distillery ppt.pptxManufacturing Process of molasses based distillery ppt.pptx
Manufacturing Process of molasses based distillery ppt.pptx
Madan Karki
 
官方认证美国密歇根州立大学毕业证学位证书原版一模一样
官方认证美国密歇根州立大学毕业证学位证书原版一模一样官方认证美国密歇根州立大学毕业证学位证书原版一模一样
官方认证美国密歇根州立大学毕业证学位证书原版一模一样
171ticu
 
IEEE Aerospace and Electronic Systems Society as a Graduate Student Member
IEEE Aerospace and Electronic Systems Society as a Graduate Student MemberIEEE Aerospace and Electronic Systems Society as a Graduate Student Member
IEEE Aerospace and Electronic Systems Society as a Graduate Student Member
VICTOR MAESTRE RAMIREZ
 
Understanding Inductive Bias in Machine Learning
Understanding Inductive Bias in Machine LearningUnderstanding Inductive Bias in Machine Learning
Understanding Inductive Bias in Machine Learning
SUTEJAS
 

Recently uploaded (20)

Redefining brain tumor segmentation: a cutting-edge convolutional neural netw...
Redefining brain tumor segmentation: a cutting-edge convolutional neural netw...Redefining brain tumor segmentation: a cutting-edge convolutional neural netw...
Redefining brain tumor segmentation: a cutting-edge convolutional neural netw...
 
UNLOCKING HEALTHCARE 4.0: NAVIGATING CRITICAL SUCCESS FACTORS FOR EFFECTIVE I...
UNLOCKING HEALTHCARE 4.0: NAVIGATING CRITICAL SUCCESS FACTORS FOR EFFECTIVE I...UNLOCKING HEALTHCARE 4.0: NAVIGATING CRITICAL SUCCESS FACTORS FOR EFFECTIVE I...
UNLOCKING HEALTHCARE 4.0: NAVIGATING CRITICAL SUCCESS FACTORS FOR EFFECTIVE I...
 
Advanced control scheme of doubly fed induction generator for wind turbine us...
Advanced control scheme of doubly fed induction generator for wind turbine us...Advanced control scheme of doubly fed induction generator for wind turbine us...
Advanced control scheme of doubly fed induction generator for wind turbine us...
 
LLM Fine Tuning with QLoRA Cassandra Lunch 4, presented by Anant
LLM Fine Tuning with QLoRA Cassandra Lunch 4, presented by AnantLLM Fine Tuning with QLoRA Cassandra Lunch 4, presented by Anant
LLM Fine Tuning with QLoRA Cassandra Lunch 4, presented by Anant
 
Casting-Defect-inSlab continuous casting.pdf
Casting-Defect-inSlab continuous casting.pdfCasting-Defect-inSlab continuous casting.pdf
Casting-Defect-inSlab continuous casting.pdf
 
ML Based Model for NIDS MSc Updated Presentation.v2.pptx
ML Based Model for NIDS MSc Updated Presentation.v2.pptxML Based Model for NIDS MSc Updated Presentation.v2.pptx
ML Based Model for NIDS MSc Updated Presentation.v2.pptx
 
ISPM 15 Heat Treated Wood Stamps and why your shipping must have one
ISPM 15 Heat Treated Wood Stamps and why your shipping must have oneISPM 15 Heat Treated Wood Stamps and why your shipping must have one
ISPM 15 Heat Treated Wood Stamps and why your shipping must have one
 
gray level transformation unit 3(image processing))
gray level transformation unit 3(image processing))gray level transformation unit 3(image processing))
gray level transformation unit 3(image processing))
 
Properties Railway Sleepers and Test.pptx
Properties Railway Sleepers and Test.pptxProperties Railway Sleepers and Test.pptx
Properties Railway Sleepers and Test.pptx
 
CompEx~Manual~1210 (2).pdf COMPEX GAS AND VAPOURS
CompEx~Manual~1210 (2).pdf COMPEX GAS AND VAPOURSCompEx~Manual~1210 (2).pdf COMPEX GAS AND VAPOURS
CompEx~Manual~1210 (2).pdf COMPEX GAS AND VAPOURS
 
Comparative analysis between traditional aquaponics and reconstructed aquapon...
Comparative analysis between traditional aquaponics and reconstructed aquapon...Comparative analysis between traditional aquaponics and reconstructed aquapon...
Comparative analysis between traditional aquaponics and reconstructed aquapon...
 
BRAIN TUMOR DETECTION for seminar ppt.pdf
BRAIN TUMOR DETECTION for seminar ppt.pdfBRAIN TUMOR DETECTION for seminar ppt.pdf
BRAIN TUMOR DETECTION for seminar ppt.pdf
 
Harnessing WebAssembly for Real-time Stateless Streaming Pipelines
Harnessing WebAssembly for Real-time Stateless Streaming PipelinesHarnessing WebAssembly for Real-time Stateless Streaming Pipelines
Harnessing WebAssembly for Real-time Stateless Streaming Pipelines
 
哪里办理(csu毕业证书)查尔斯特大学毕业证硕士学历原版一模一样
哪里办理(csu毕业证书)查尔斯特大学毕业证硕士学历原版一模一样哪里办理(csu毕业证书)查尔斯特大学毕业证硕士学历原版一模一样
哪里办理(csu毕业证书)查尔斯特大学毕业证硕士学历原版一模一样
 
DEEP LEARNING FOR SMART GRID INTRUSION DETECTION: A HYBRID CNN-LSTM-BASED MODEL
DEEP LEARNING FOR SMART GRID INTRUSION DETECTION: A HYBRID CNN-LSTM-BASED MODELDEEP LEARNING FOR SMART GRID INTRUSION DETECTION: A HYBRID CNN-LSTM-BASED MODEL
DEEP LEARNING FOR SMART GRID INTRUSION DETECTION: A HYBRID CNN-LSTM-BASED MODEL
 
Embedded machine learning-based road conditions and driving behavior monitoring
Embedded machine learning-based road conditions and driving behavior monitoringEmbedded machine learning-based road conditions and driving behavior monitoring
Embedded machine learning-based road conditions and driving behavior monitoring
 
Manufacturing Process of molasses based distillery ppt.pptx
Manufacturing Process of molasses based distillery ppt.pptxManufacturing Process of molasses based distillery ppt.pptx
Manufacturing Process of molasses based distillery ppt.pptx
 
官方认证美国密歇根州立大学毕业证学位证书原版一模一样
官方认证美国密歇根州立大学毕业证学位证书原版一模一样官方认证美国密歇根州立大学毕业证学位证书原版一模一样
官方认证美国密歇根州立大学毕业证学位证书原版一模一样
 
IEEE Aerospace and Electronic Systems Society as a Graduate Student Member
IEEE Aerospace and Electronic Systems Society as a Graduate Student MemberIEEE Aerospace and Electronic Systems Society as a Graduate Student Member
IEEE Aerospace and Electronic Systems Society as a Graduate Student Member
 
Understanding Inductive Bias in Machine Learning
Understanding Inductive Bias in Machine LearningUnderstanding Inductive Bias in Machine Learning
Understanding Inductive Bias in Machine Learning
 

Heat treatment, phases, microstructures and its properties

  • 1. Malaviya National Institute of Technology Jaipur Submitted by Basitti Hitesh 2017PMT5094Submitted to Dr. V.K.Sharma Heat Treatment, Phases, Microstructures and its properties
  • 2. Phase A Phase in a material in terms of its microstructure is a region that differs in structure and/or composition from another region. Phase diagram Phase diagrams are graphical representations from which it is possible to know number and types of phases present in a material at various temperature, pressure and composition. The following important information can be obtained from phase diagrams:  Number and types of phases present at different compositions and temperatures under slow cooling (equilibrium) conditions. Equilibrium solid solubility of one element in another. Temperature at which an alloy starts solidifying undergoing slow cooling and also the temperature range within which solidification take place. Temperature at which different phases start melting and regions of stability of phases in terms of temperature and composition.
  • 3. Gibb’s phase rule: The Gibb’s phase rule states that P+F=C+2 where F is the degree of freedom, P is the number of phases and C is the number of components. Gibb’s phase rule gives an idea on degree of freedom that is permissible for a given number of components and phases in equilibrium. Application of Gibb’s phase rule Fig. Phase diagram of water system
  • 4. At triple point of water system, three phases are in equilibrium and water is a one component system. Now by applying Gibb’s phase rule F=C-P+2, we can write, for invariant points- F=1-3+2, i.e., F=0 Hence for this system at triple point, degree of freedom is zero which means none of the variables viz. temperature and pressure can be changed and still keeps three phases of coexistence. So triple point is called an invariant point. Since most binary phase diagrams mainly deals with temperature-composition at constant pressure at 1 atm, Gibb’s phase rule expressed as P+F=C+1.
  • 5. Concept of solid solution: An alloy is a mixture of two or more metals or a metal and nonmetal. Alloys may have simple as well as complex structure. Solid solution is a simple type of alloy. A solid solution is solid that consists of two or more elements atomically dispersed in a single phase structure. In other words, solid solution can be defined as an alloy of two or more metals, or a metal and a nonmetal which is a single phase atomic mixture. There are two types of solid solution – Substitutional Solid Solution Interstitial Solid Solution
  • 6. Substitutional solid solution: In this type, solute atoms of one element can substitute parent solvent atoms of another element. In Cu-Ni solid solution, Cu atoms can replace Ni atoms in crystal lattice. The crystal structure of parent solvent may remain unchanged, nut lattice may be distorted by the solute atoms. This happens when there is significant variation in atomic diameters of parent solvent atom and solute atoms.
  • 7. Hume- Rothery, an English Metallurgist studied various alloy systems including isomorphous Cu-Ni system and formulated the following conditions for two elements to have complete solid solubility: 1) The crystal structure of each element of the solid solution must be the same. 2) The size of the atoms of each of two elements must not differ by more than 15%. 3) There should not be appreciable difference in electronegativities of the two elements. 4) The elements should have the same valence.
  • 8. Interstitial Solid Solution: This type of solid solution is formed when solute atoms enter into the interstices of solvent atom lattice. Hydrogen, Carbon, Nitrogen and Oxygen atoms are common which form interstitial solid solutions.
  • 10.
  • 11.
  • 12. The phase composition depending on the temperature and the carbon content can be read off this dual diagram in which the stable system iron- graphite (dotted lines) and the meta-stable system iron-carbide (solid lines) are shown together. The closeness of the equilibrium lines which correspond to one another indicates that the difference in the stability of carbide and graphite in the alloys is not large. Therefore, the carbon may be dissolved in the iron after solidification or, however, may precipitate in the form of graphite. Furthermore, it can also occur in the structure in a bound form as iron carbide (Fe3C) and is dissolved in the α and γ solid solution in both systems. The eutectic temperature of the iron-graphite reaction is considerably higher than that of the iron-cementite reaction. In the case of slower cooling, mainly graphite forms, in the case of accelerated heat dissipation, on the other hand, mainly cementite. During annealing, graphite may form, reducing the cementite content. The tendency for graphite to form from cementite shows that iron or iron-rich solid solutions only form a stable equilibrium with free carbon (graphite). Nature of Duality in Fe-Fe3C phase diagram
  • 13. Purpose of the iron-carbon phase diagram? To know what will be the crystal structure and physical and chemical properties of iron at known carbon percentage and temperature. provided that slow and uniform cooling rate is there and no quenching.
  • 14. Different phases present in Iron-Iron carbide system ‘γ’ phase or Austenite: Interstitial solid solution of carbon in iron of FCC crystal structure having solubility limit of 2.11 wt.% at 1147⁰C with respect to cementite. The stability of the phase ranges between 727-1495⁰C and solubility ranges 0-0.77 wt.%C with respect to alpha ferrite and 0.77-2.11 wt.% C with respect to cementite, at 0 wt.%C the stability ranges from 910-1394⁰C. α - ferrite: Interstitial solid solution of carbon in iron of BCC crystal structure (α-iron) having solubility limit of 0.0218 wt % C at 727⁰C with respect to austenite. The stability of the phase ranges between low temperatures to 910⁰C, and solubility ranges 0.008 wt. % C at room temperature to 0.0218 wt%C at 727⁰C with respect to cementite. Pearlite: This phase is a product of eutectoid decomposition of austenite into mixture of ferrite and cementite (Fe3C).
  • 15. Delta ferrite: The high-temperature ferrite is labeled delta-iron, even though its crystal structure is identical to that of alpha-ferrite. The delta-ferrite remains stable until it melts at 1538 °C. Maximum solubility is 0.1 wt% C at 1495 °C. Fe3C or Cementite: Interstitial intermetallic compound of C & Fe with a carbon content of 6.67 wt.% and orthorhombic structure consisting of 12 iron atoms and 4 carbon atoms in the unit cell. Stability of the phase ranges from low temperatures to 1227°C. This is a chemical compound of high hardness. In steel, it can be associated with carbides of other elements, such as Mn. Ledeburite : Eutectic mixture of austenite and cementite is known as ledeburite.
  • 16. Actually there is no difference in beta phase and alpha phase when we talk about crystal structure of iron. Beta phase has the same structure as the alpha phase. The only difference is the magnetic properties which are absent in beta phase due to the expanded lattice parameter. Why beta phase is not there in iron carbon phase diagram?
  • 17. Why is solubility of ‘C’ higher in FCC than in BCC? Austenite is having FCC (Face Centred Cubic) structure and Ferrite is having BCC (Body Centred Cubic) structure. There are 2 types of interstitial sites octahedral & tetrahedral. In FCC, octahedral void is significantly larger than tetrahedral void. Whereas in BCC these are nearly same. The total open space is shared by more number of sites. Therefore interstitial gap in BCC is much smaller than that of FCC. This is why carbon which occupies interstitial site has higher solubility in austenite (FCC).
  • 18. Peritectic reaction: Liquid+Solid1↔Solid2 L (0.53wt%C) +δ (0.09wt%C) ↔γ (0.17wt%C) at 1495⁰C Liquid(18.18wt%) +δ-ferrite (81.82 wt. %)→100 wt. % γ Invariant reactions in Iron-Iron carbide phase diagram
  • 19. Eutectic reaction: Liquid↔Solid1+Solid2 Liquid (4.3wt%C) ↔ γ (2.11wt%C) + Fe3C (6.67 wt.%C) at 1147˚C Liquid-100 wt.% →51.97wt% γ+Fe3C (48.11 wt.%) The phase mixture of austenite and cementite formed at eutectic temperature is called ledeburite.
  • 20. Eutectoid reaction: Solid1↔Solid2+Solid3 γ (0.77wt%C) ↔ α(0.0218 wt.%C) + Fe3C(6.67 wt.%C) at 727 ⁰ C γ (100 wt.%) →α(89 wt.% ) +Fe3C(11 wt.%) Typical density: α-ferrite=7.87 g/cm3 Fe3C=7.7 g/cm3 Volume ratio of α-ferrite: Fe3C=7.9:1
  • 21. Sometimes the letters c, e, or r are included: • Accm — In hypereutectoid steel, the temperature at which the solution of cementite in austenite is completed during heating. • Ac1 — The temperature at which austenite begins to form during heating, with the c being derived from the French chauffant. • Ac3 — The temperature at which transformation of ferrite to austenite is completed during heating. • Aecm, Ae1, Ae3 — The temperatures of phase changes at equilibrium. • Arcm — In hypereutectoid steel, the temperature at which precipitation of cementite starts during cooling, with the r being derived from the French refroidissant. • Ar1 — The temperature at which transformation of austenite to ferrite or to ferrite plus cementite is completed during cooling. • Ar3 — The temperature at which austenite begins to transform to ferrite during cooling. • Ar4 — The temperature at which delta-ferrite transforms to austenite during cooling.
  • 22.  A1 = Temperature at which austenite begins to form during heating  A2 = Temperature at which alpha iron becomes non-magnetic  A3 = Temperature at which transformation of alpha iron to austenite is completed during heating  A4 = Temperature at which austenite transforms to delta ferrite  Am = Temperature at which solutionizing of cementite in austenite is complete Critical Temperatures
  • 23. Phase transformations may be classified according to whether or not there is any change in composition for the phases involved. Those for which there are no compositional alterations are said to be congruent transformations. Conversely, for incongruent transformations, at least one of the phases will experience a change in composition. Examples of congruent transformations include allotropic transformations and melting of pure materials. Eutectic and eutectoid reactions, as well as the melting of an alloy that belongs to an isomorphous system, all represent incongruent transformations. Congruent Phase Transformation
  • 24.  The microstructure of crystalline materials is defined by the type, structure, number, shape and topological arrangement of phases and/or lattice defects .  Elements of microstructure: Point defects, point-defect clusters, dislocations, stacking faults, grain boundaries, interphase interfaces are important elements of the microstructure of most materials. Definition of Microstructure
  • 25.  When Fe-alloy of 0.77% of C is cooled slowly it transforms from single phase of austenite to pearlite structure, a lamellar or layered structure of two phases: ferrite and cementite.  In the micrograph, dark regions are cementite and bright regions are ferrite Microstructure of Eutectoid steel
  • 26.  Layered structures are formed because of redistribution of C atoms between ferrite (0.022 wt %) and cementite (6.7 wt %) by diffusion.  Mechanical properties of pearlite are in between that of ferrite (soft) and cementite (brittle) Formation of layered structure !
  • 27. Fig. Photomicrographs of (a) α ferrite and (b) austenite (325X) (copyright 1971 by united states steel corporation)
  • 28. Fig. Photomicrograph of a eutectoid steel showing the pearlite microstructure consisting of alternating layers of α ferrite (the light phase) and Fe3C (thin layers most of which appear dark). 500X. (Reproduced with permission from metals handbook, 9th edition, Vol.9, Metallography and Microstructures, American Society for Metals, Materials park, OH, 1985.)
  • 29. Fig. Schematic representations of the microstructures for an iron- carbon alloy of hypoeutectoid composition C0 (containing less than 0.76 wt% C) as it is cooled from within the austenite phase region to below the eutectoid temperature.
  • 30. Fig. Photomicrograph of a 0.38 wt% C steel having a microstructure consisting of pearlite and pro-eutectoid ferrite. 635X. (Photomicrograph courtesy of Republic Steel Corporation
  • 31. Fig. Schematic representations of the microstructures for an iron- carbon alloy of hyper eutectroid composition C1(containing between 0.76 and 2.14 wt% C), as it is cooled from within the austenite phase region to below the eutctoid temperature
  • 32. Fig. Photomicrograph of a 1.4 wt% C steel having a microstructure consisting of a white proeutectoid cementite network surrounding the pearlite colonies. 1000X. (Copyright 1971 by United States Steel Corporation
  • 37. MARTENSITIC TRANSFORMATION • Martensite: austenite quenched to roomtemperature. • Austenite to martensite does not involve diffusion no activation: athermal transformation. • Each atom displaces small (sub-atomic) distance to transform FCC ƴ-Fe (austenite) to martensite, a Body Centered Tetragonal (BCT) unit cell (like BCC, but one unit cell axis longer than other two). • Martensite is metastable - persists indefinitely at room T: transforms to equilibrium phaseson at elevated temperature • Sincemartensite is ametastable phase, it does not appear in Fe-Cphase diagram. The amount of martensite formed is a function of the temperature to which the sample is quenched and not of time. • The shear changes the shape of the transforming region: → results in considerable amount of shear energy → plate-like shape of Martensite
  • 38. The martensitic transformation involves the sudden reorientation of C and Fe atoms from the FCC solid solution of γ-Fe (austenite) to a body centered tetragonal (BCT) solid solution (martensite) Austenite to Martensite
  • 39. Fig. Microstructure of martensite transformation in Fe-31wt%Ni-0.02wt%C transformed by cooling into liquid nitrogen. Micrograph obtained by J. R. C. Guimarães.
  • 40. Martensite is so brittle it needs to be modified for practical applications. Done by heating to 250-650oC for some time. Temperedmartensite,extremely fine-grained,well dispersed cementite grains in a ferrite matrix. Tempered martensite is more ductile. Mechanical properties depend upon cementite particle size: fewer, larger particles means less boundary area and softer, more ductile material - eventual limit is spheroidite. Particle size increases with higher tempering temperature and/or longer time (more carbon diffusion) Tempered Martensite
  • 41.  Tempered martensite is less brittle than martensite; tempered at 594°C.  Tempering reduces internal stresses caused by quenching.  The small particles are cementite; the matrix is α-ferrite. US Steel Corp. 4340 steel
  • 42.  Bainite is a Plate-like microstructure that forms in steels at temperatures of 250–550 °C (depending on alloy content).  First described by E. S. Davenport and Edgar Bain, it is one of the products that may form when austenite (the face centered cubic crystal structure of iron) is cooled past a critical temperature.  This critical temperature is 1000 K (727 °C) in plain carbon steels.  Davenport and Bain originally described the microstructure as being similar in appearance to tempered martensite.  A fine non-lamellar structure, bainite commonly consists of cementite and dislocation-rich ferrite.  The high concentration of dislocations in the ferrite present in bainite makes this ferrite harder than it normally would be. BAINITE
  • 44. Fig. Microstructure of Bainite (a) Upper Bainite (b) Lower Bainite (c) Retained austenite