Downloaded 6,495 times


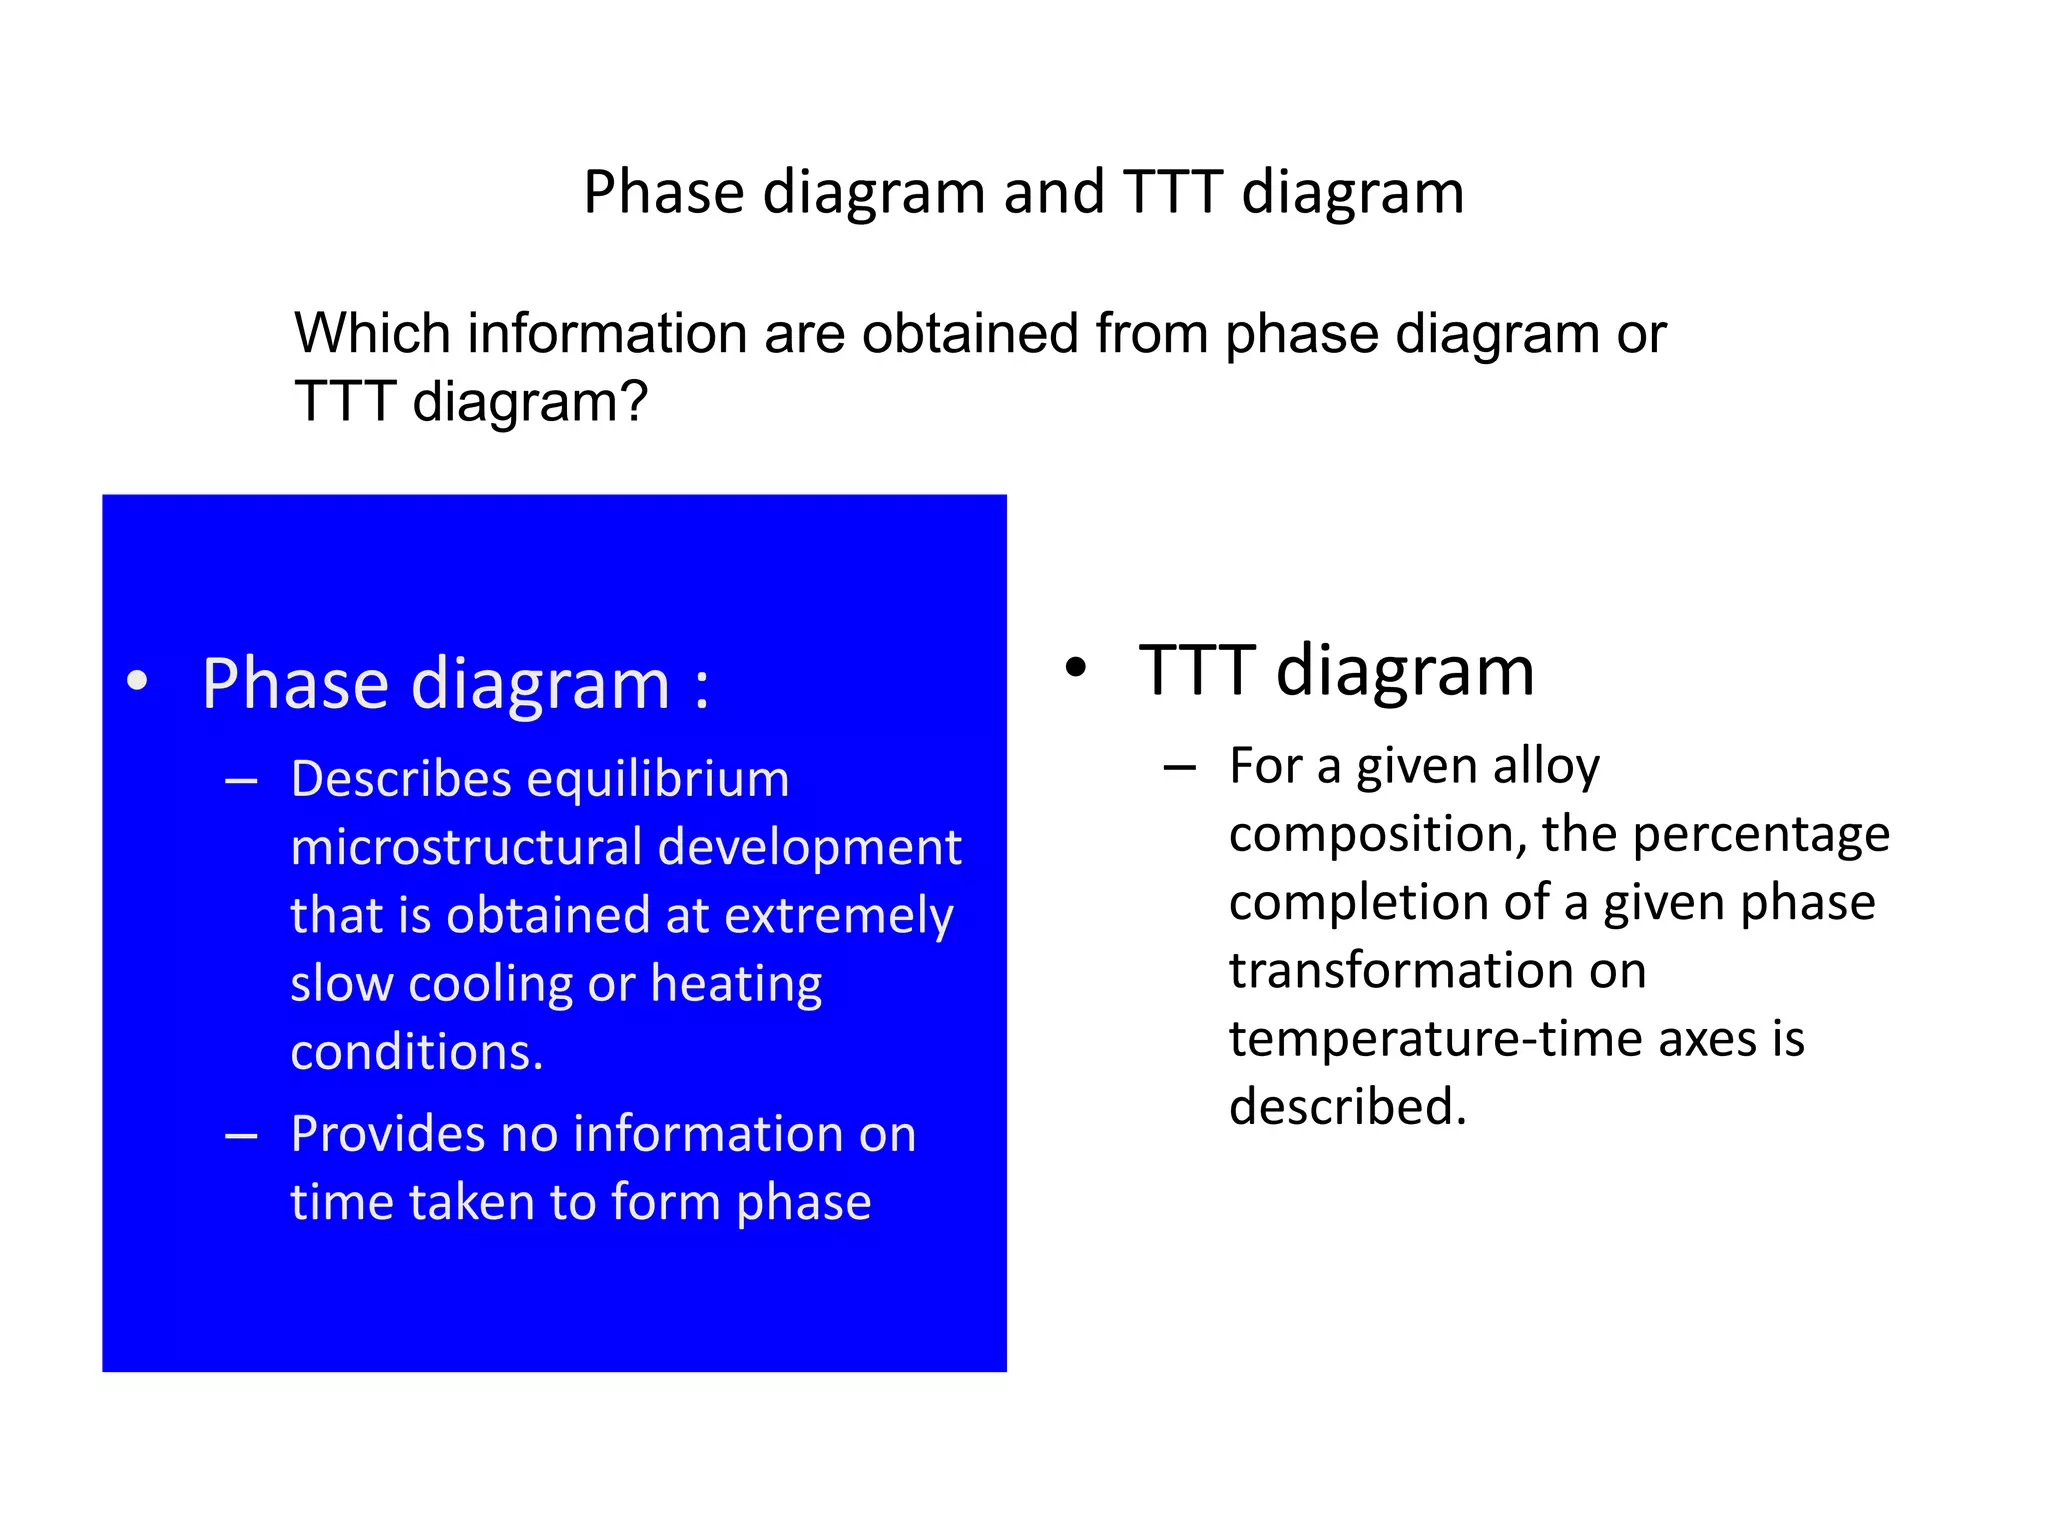

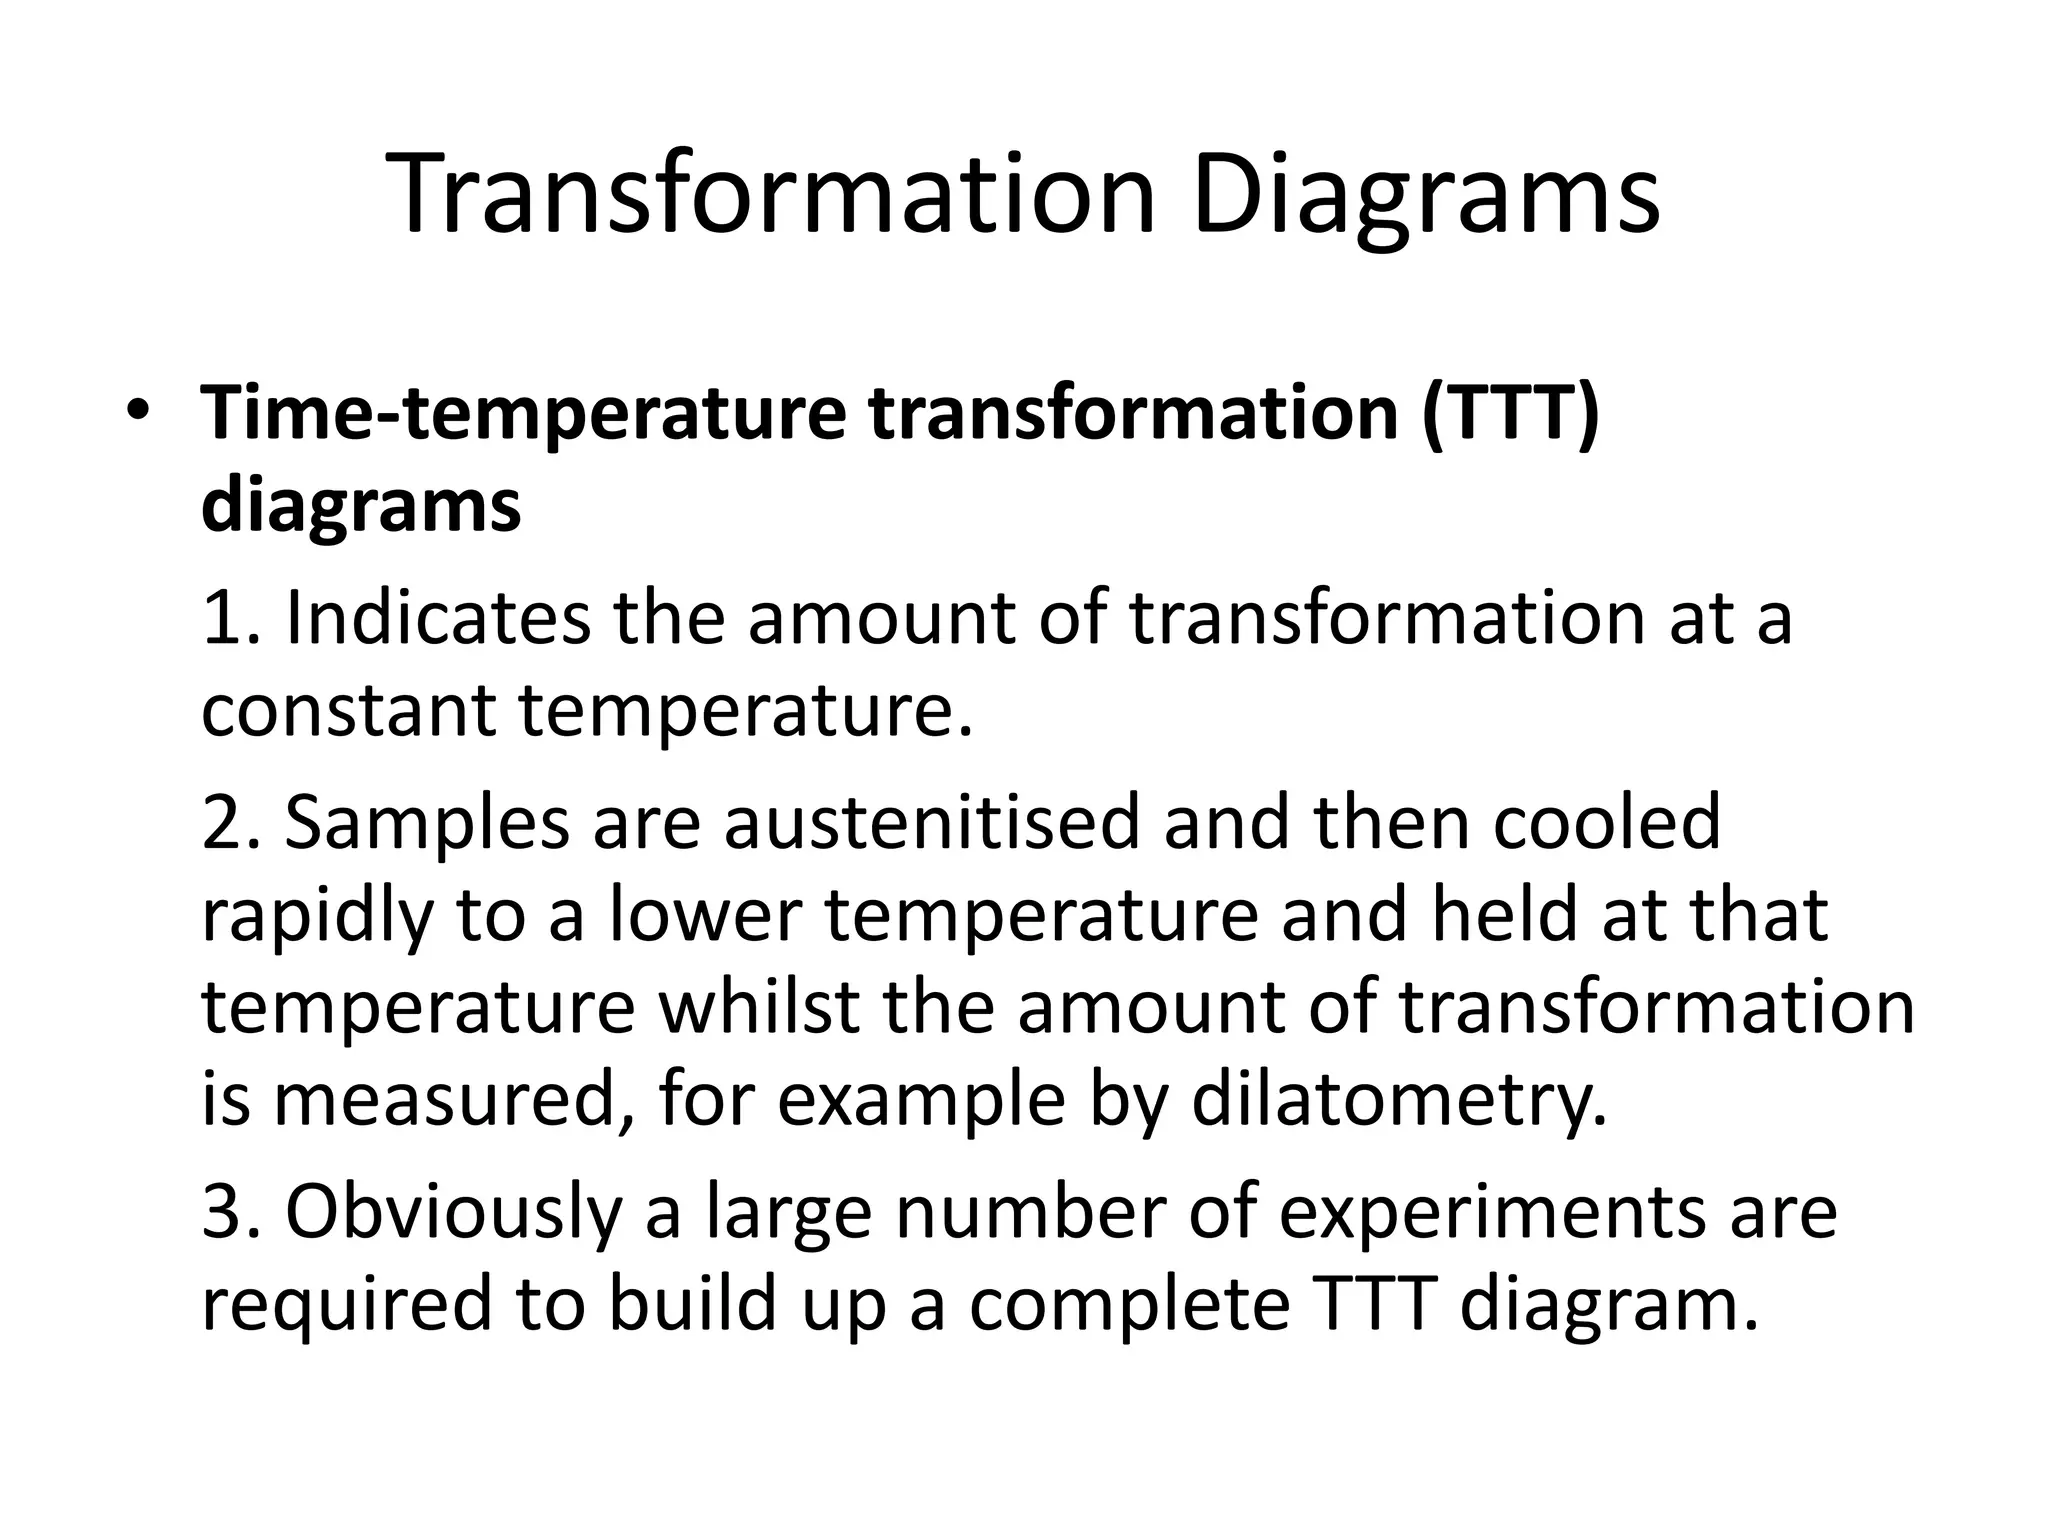


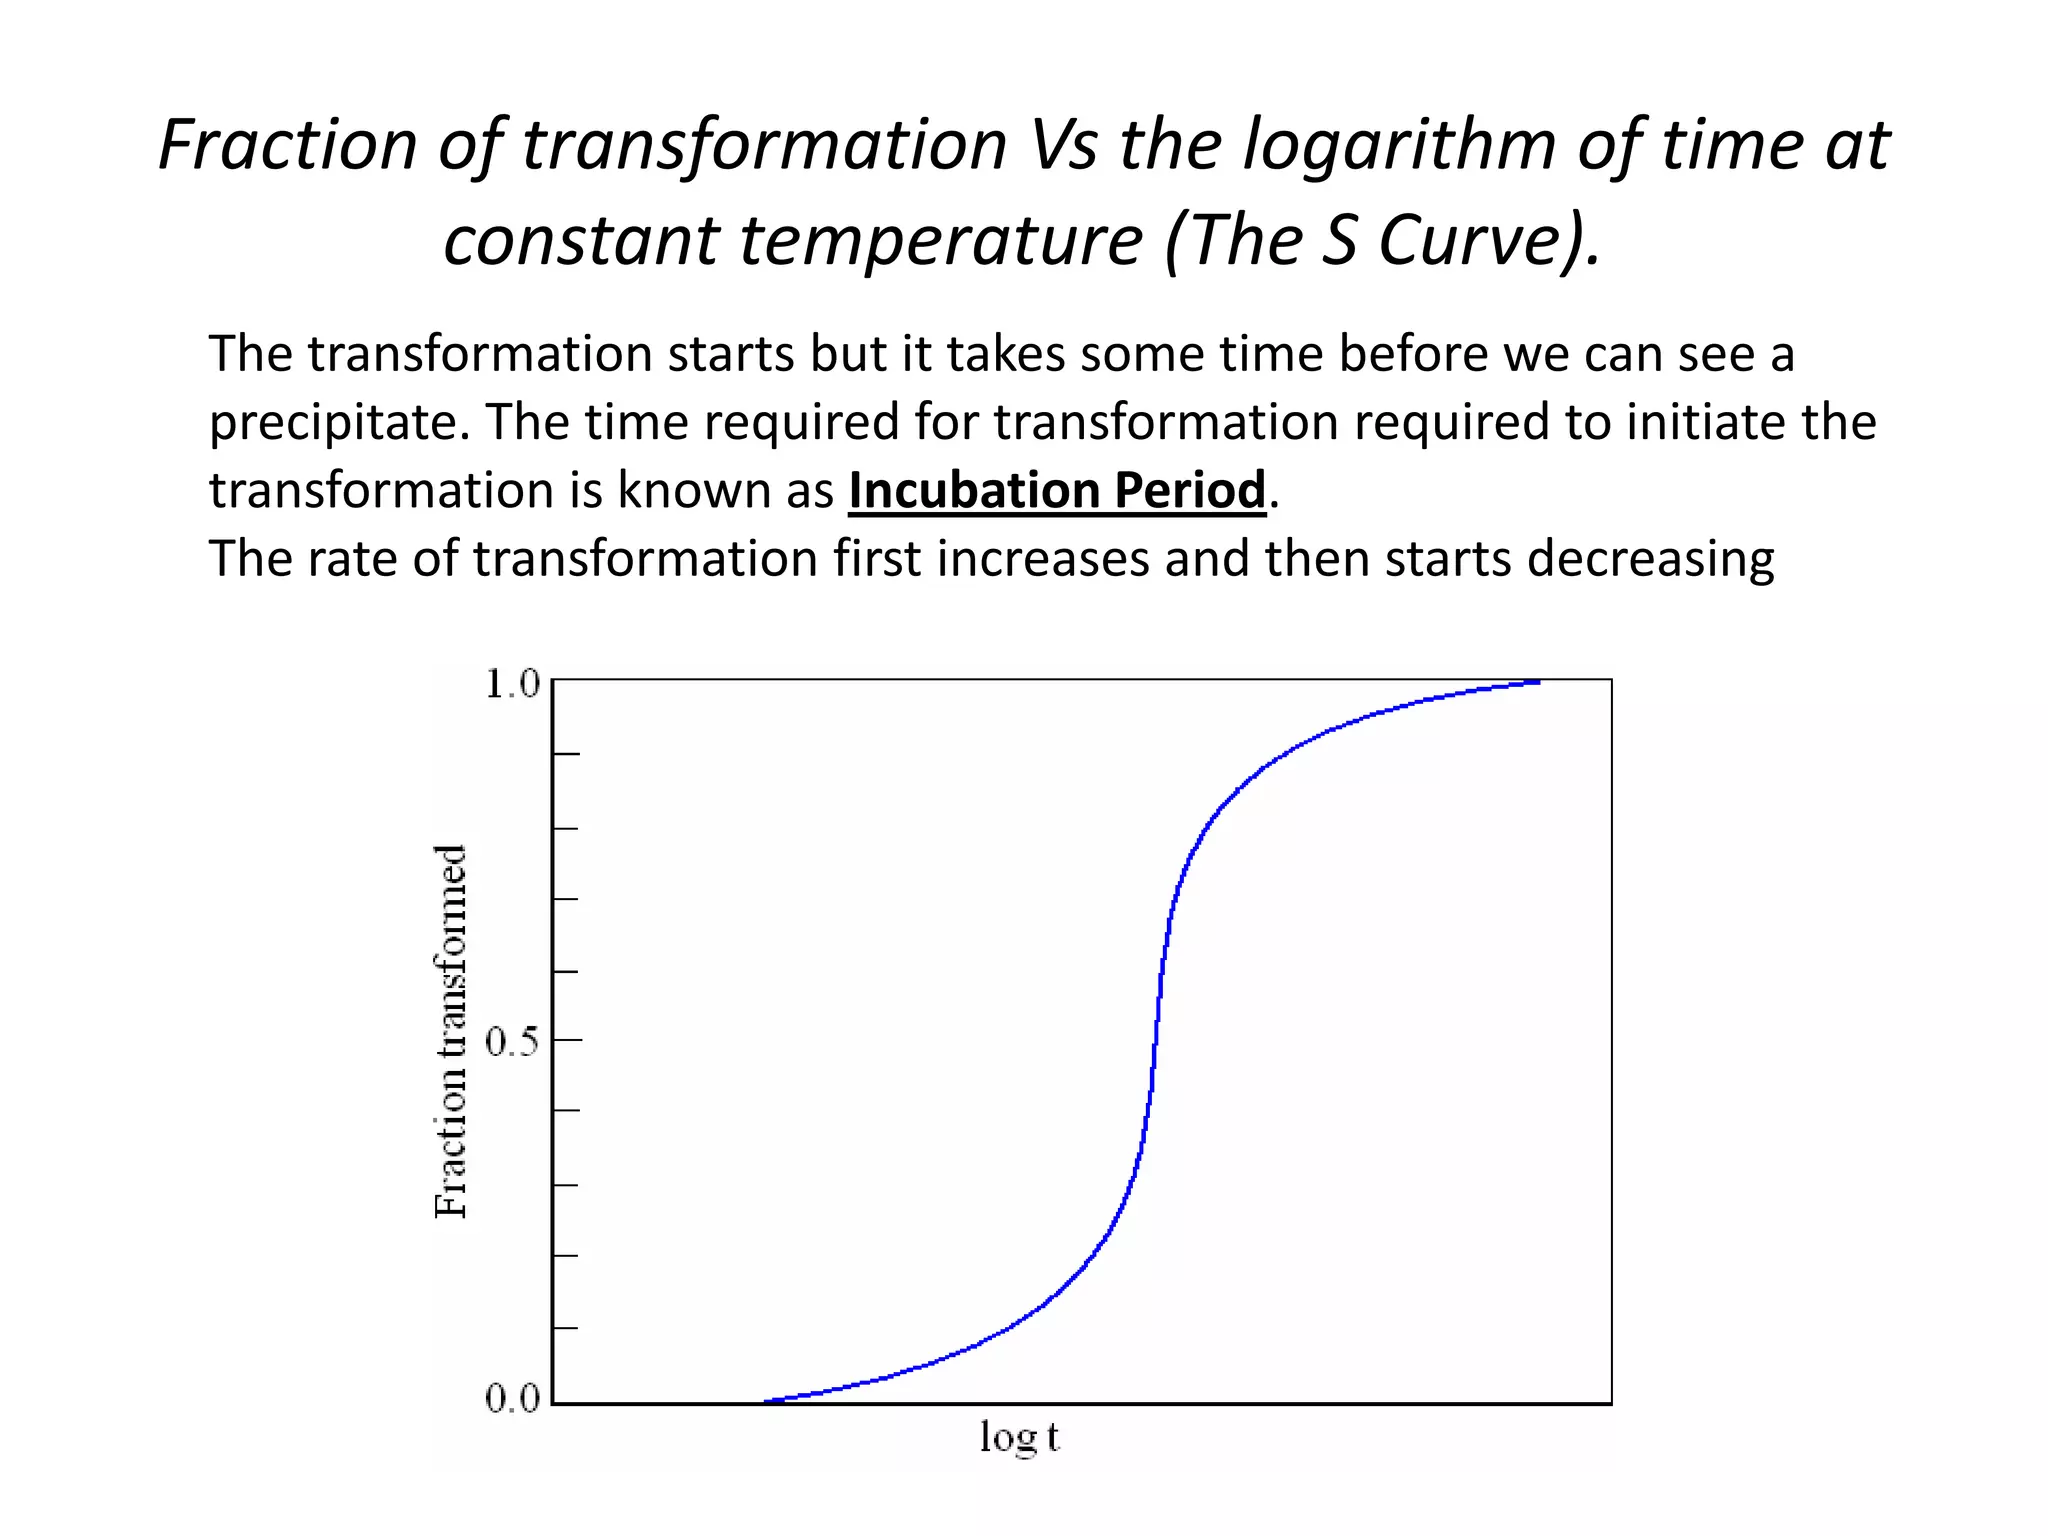
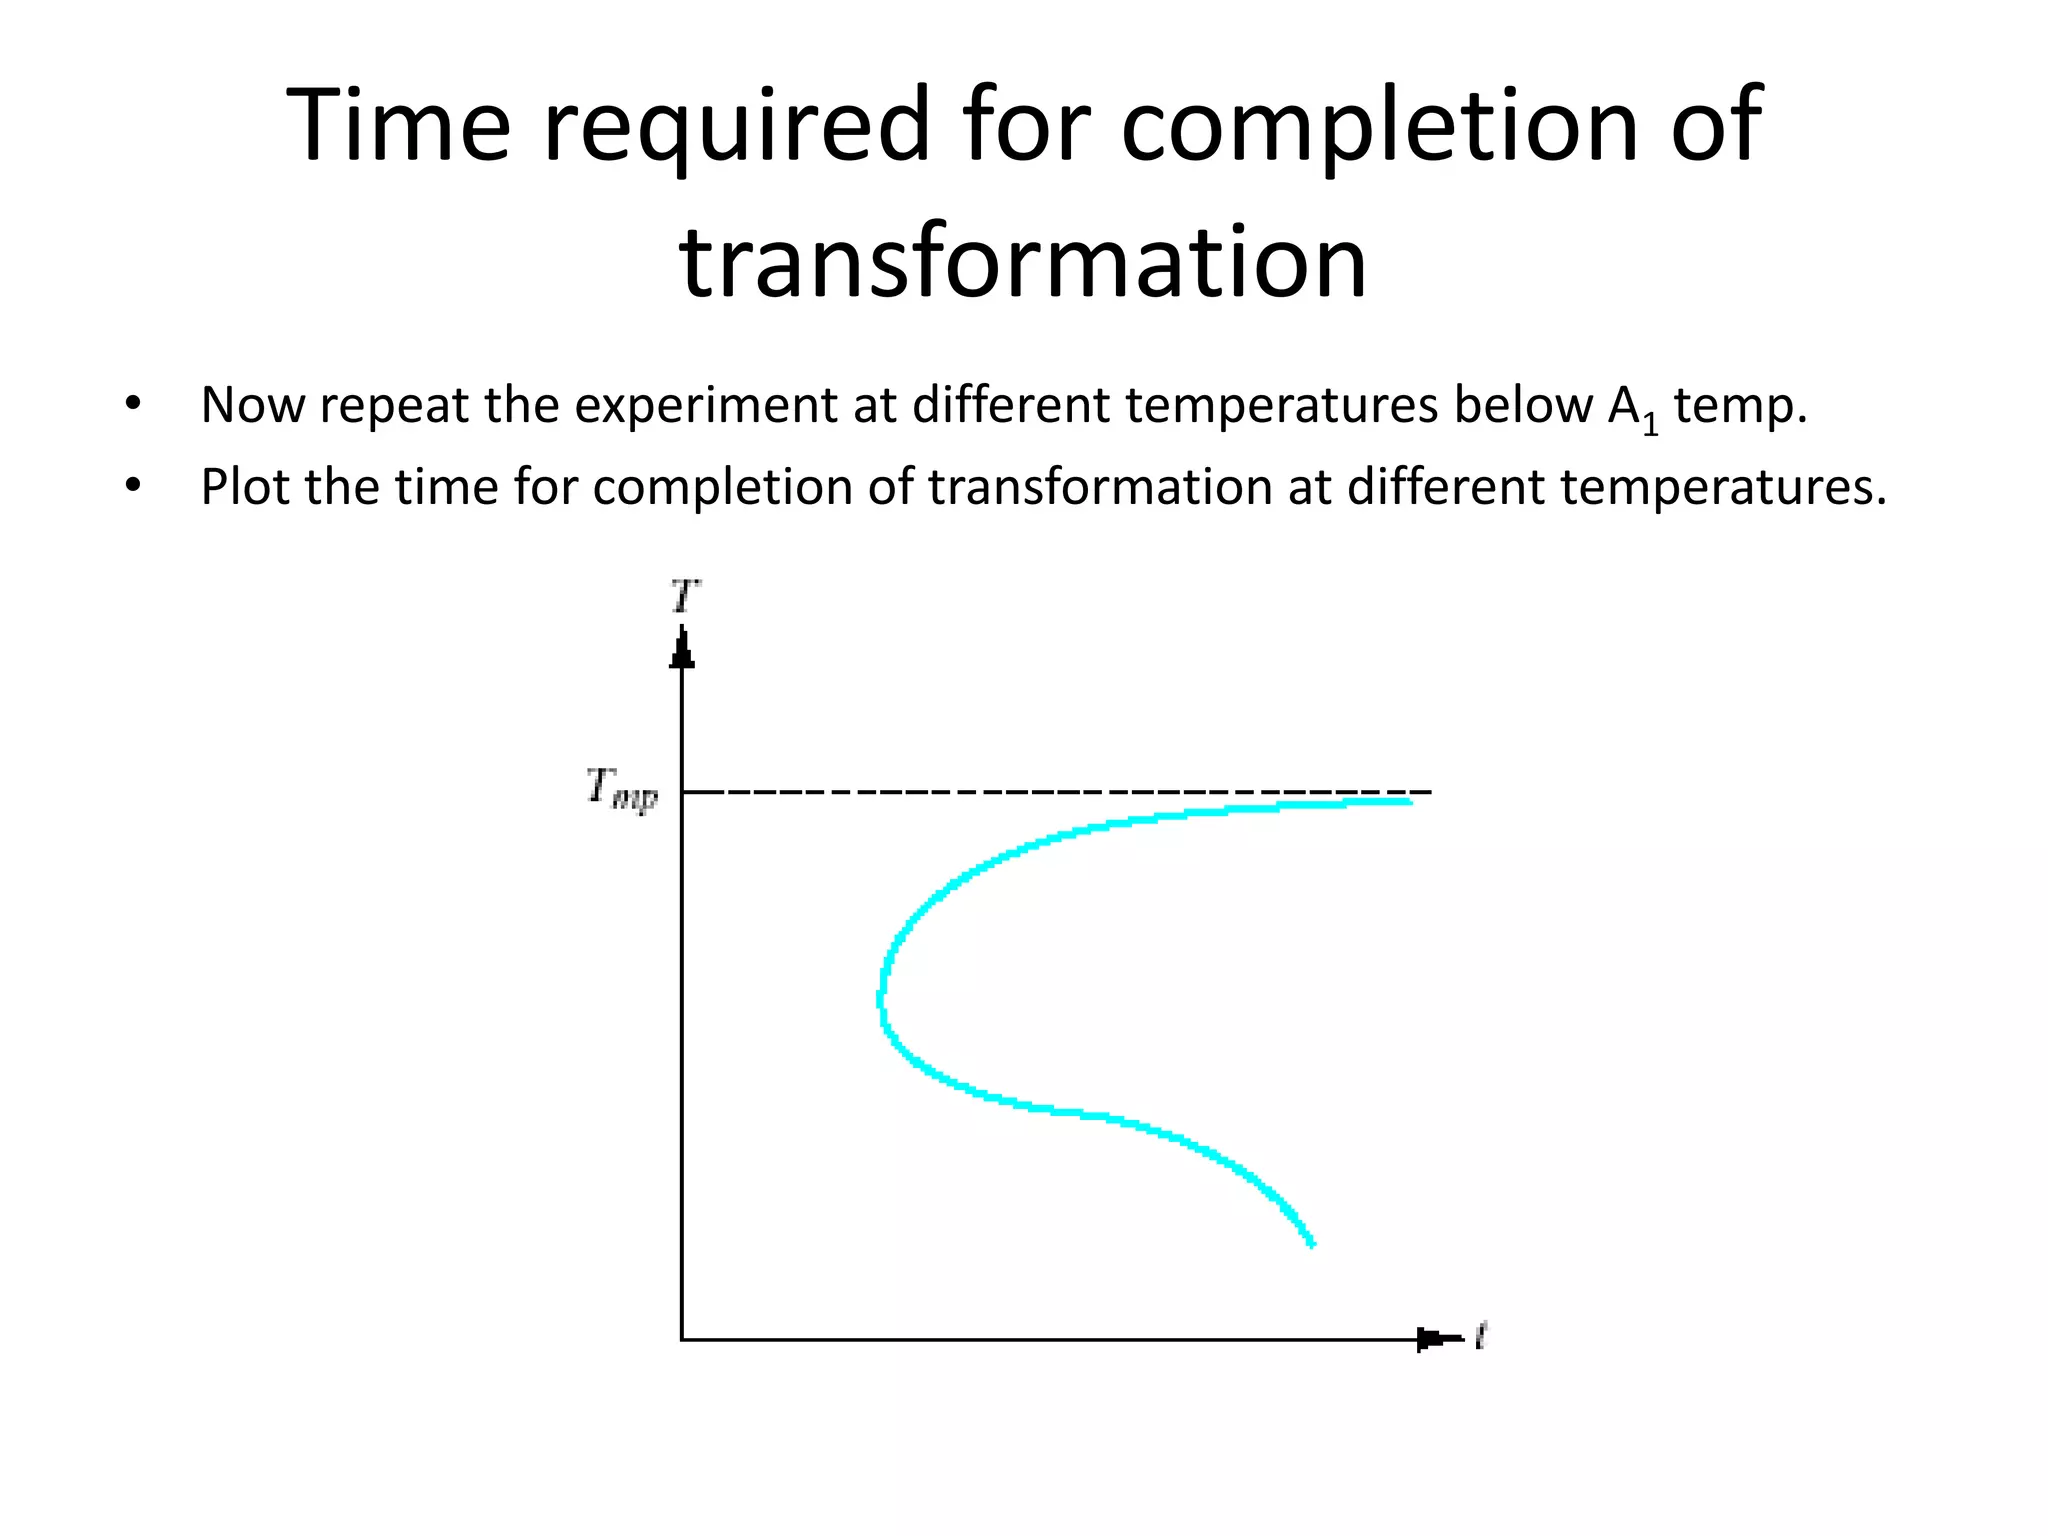
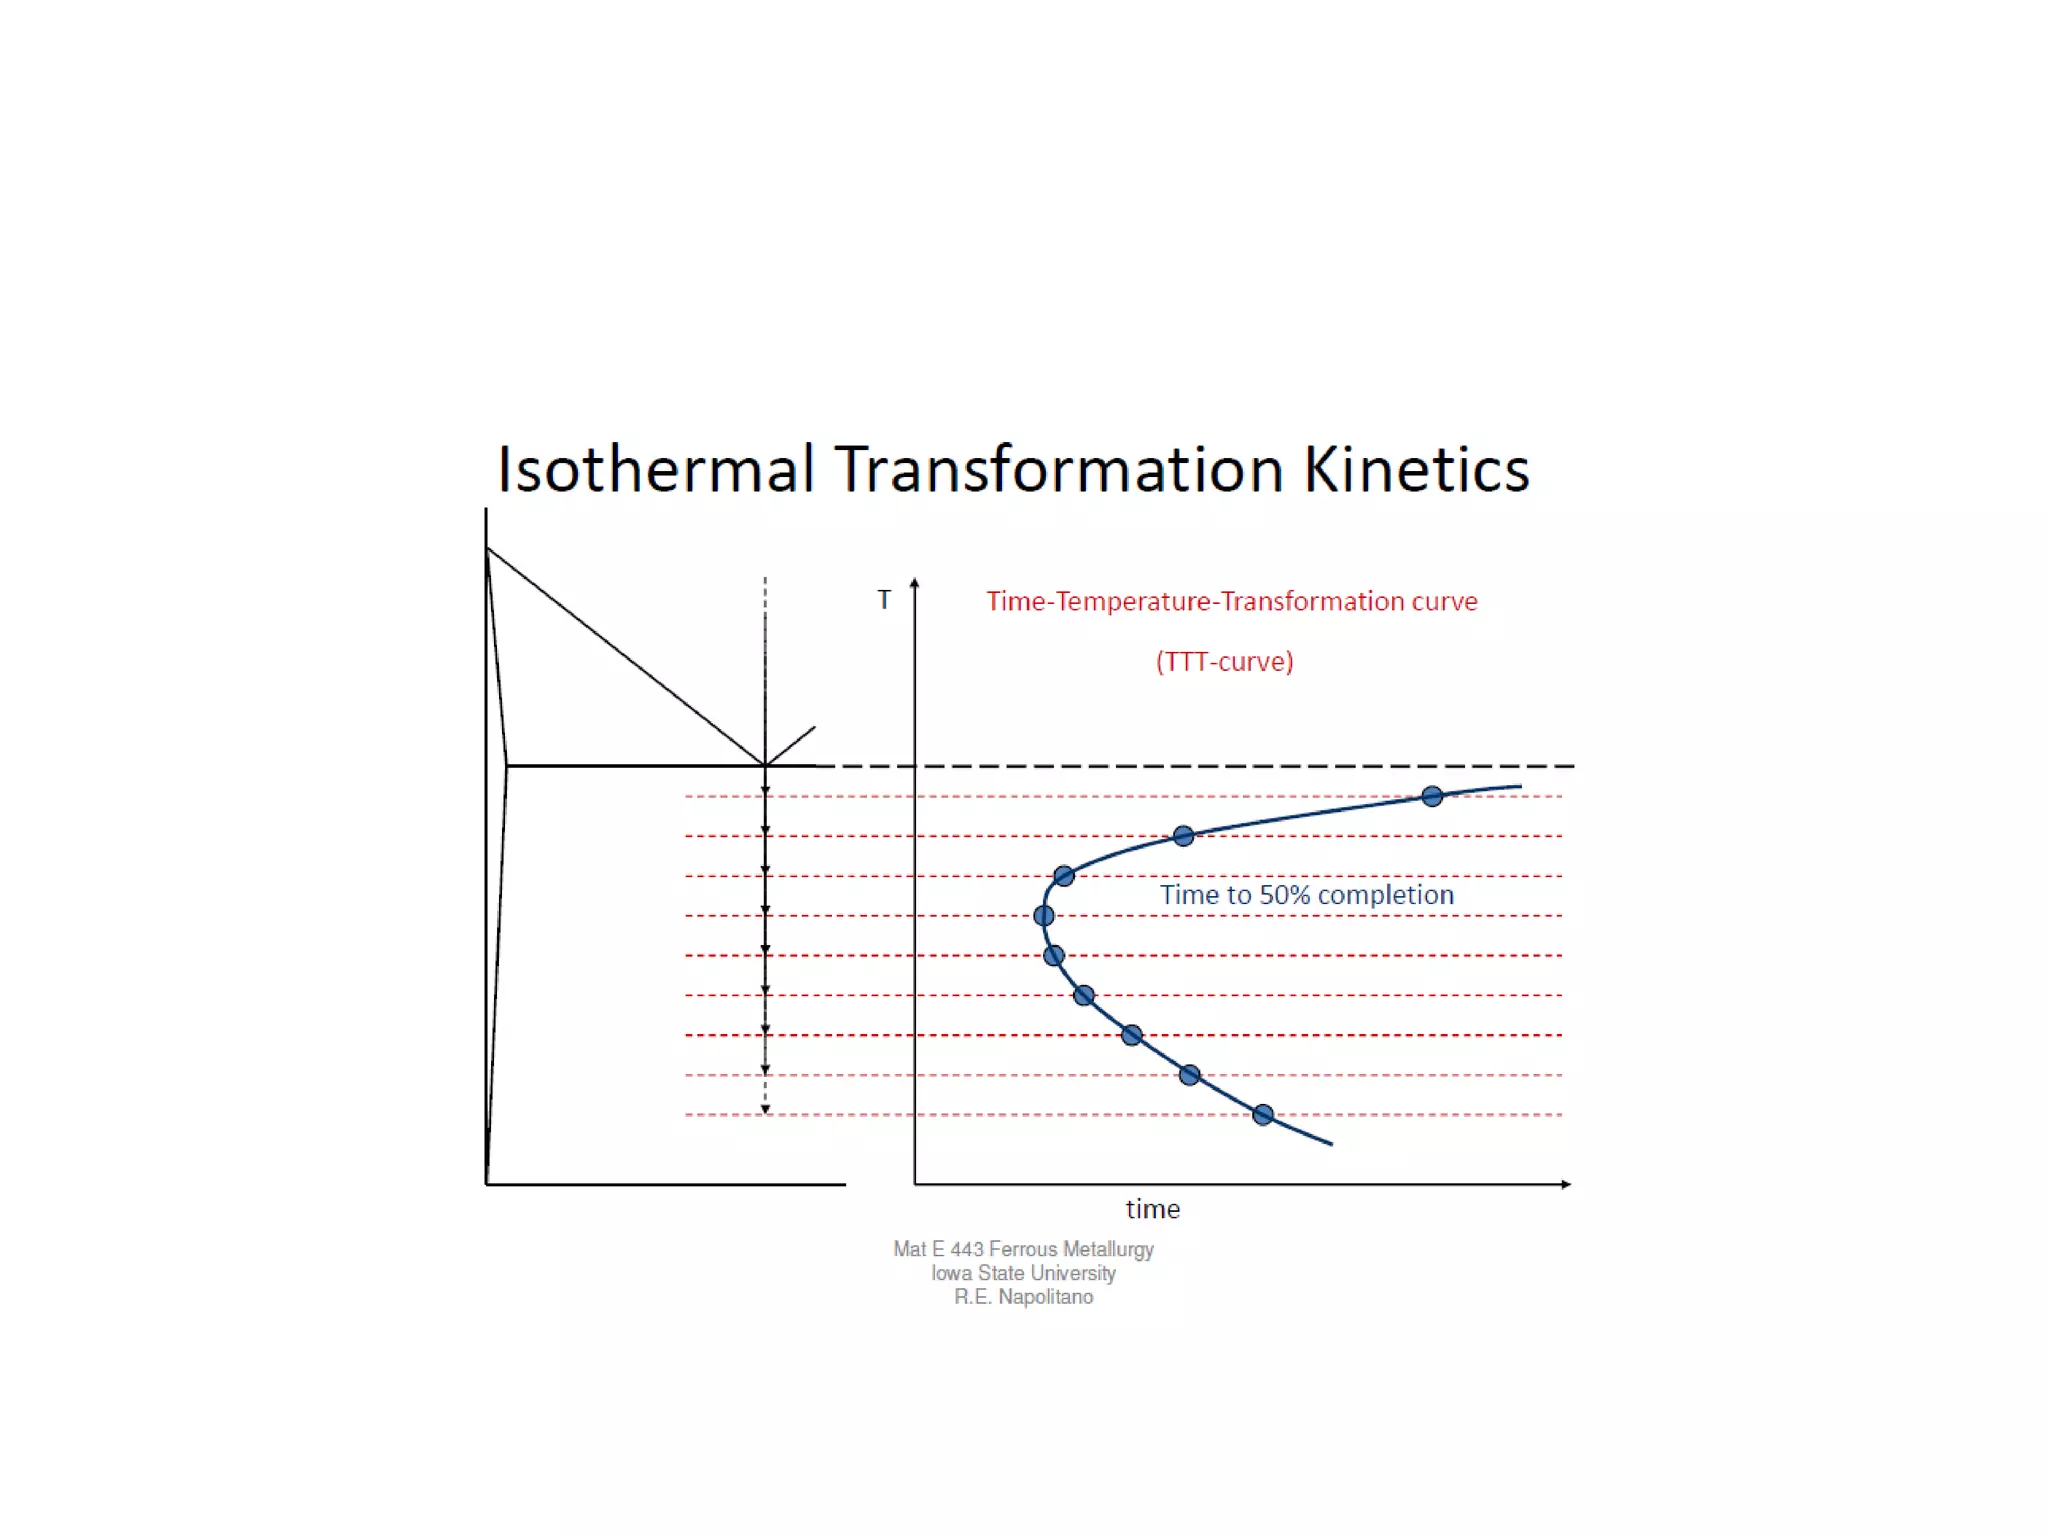

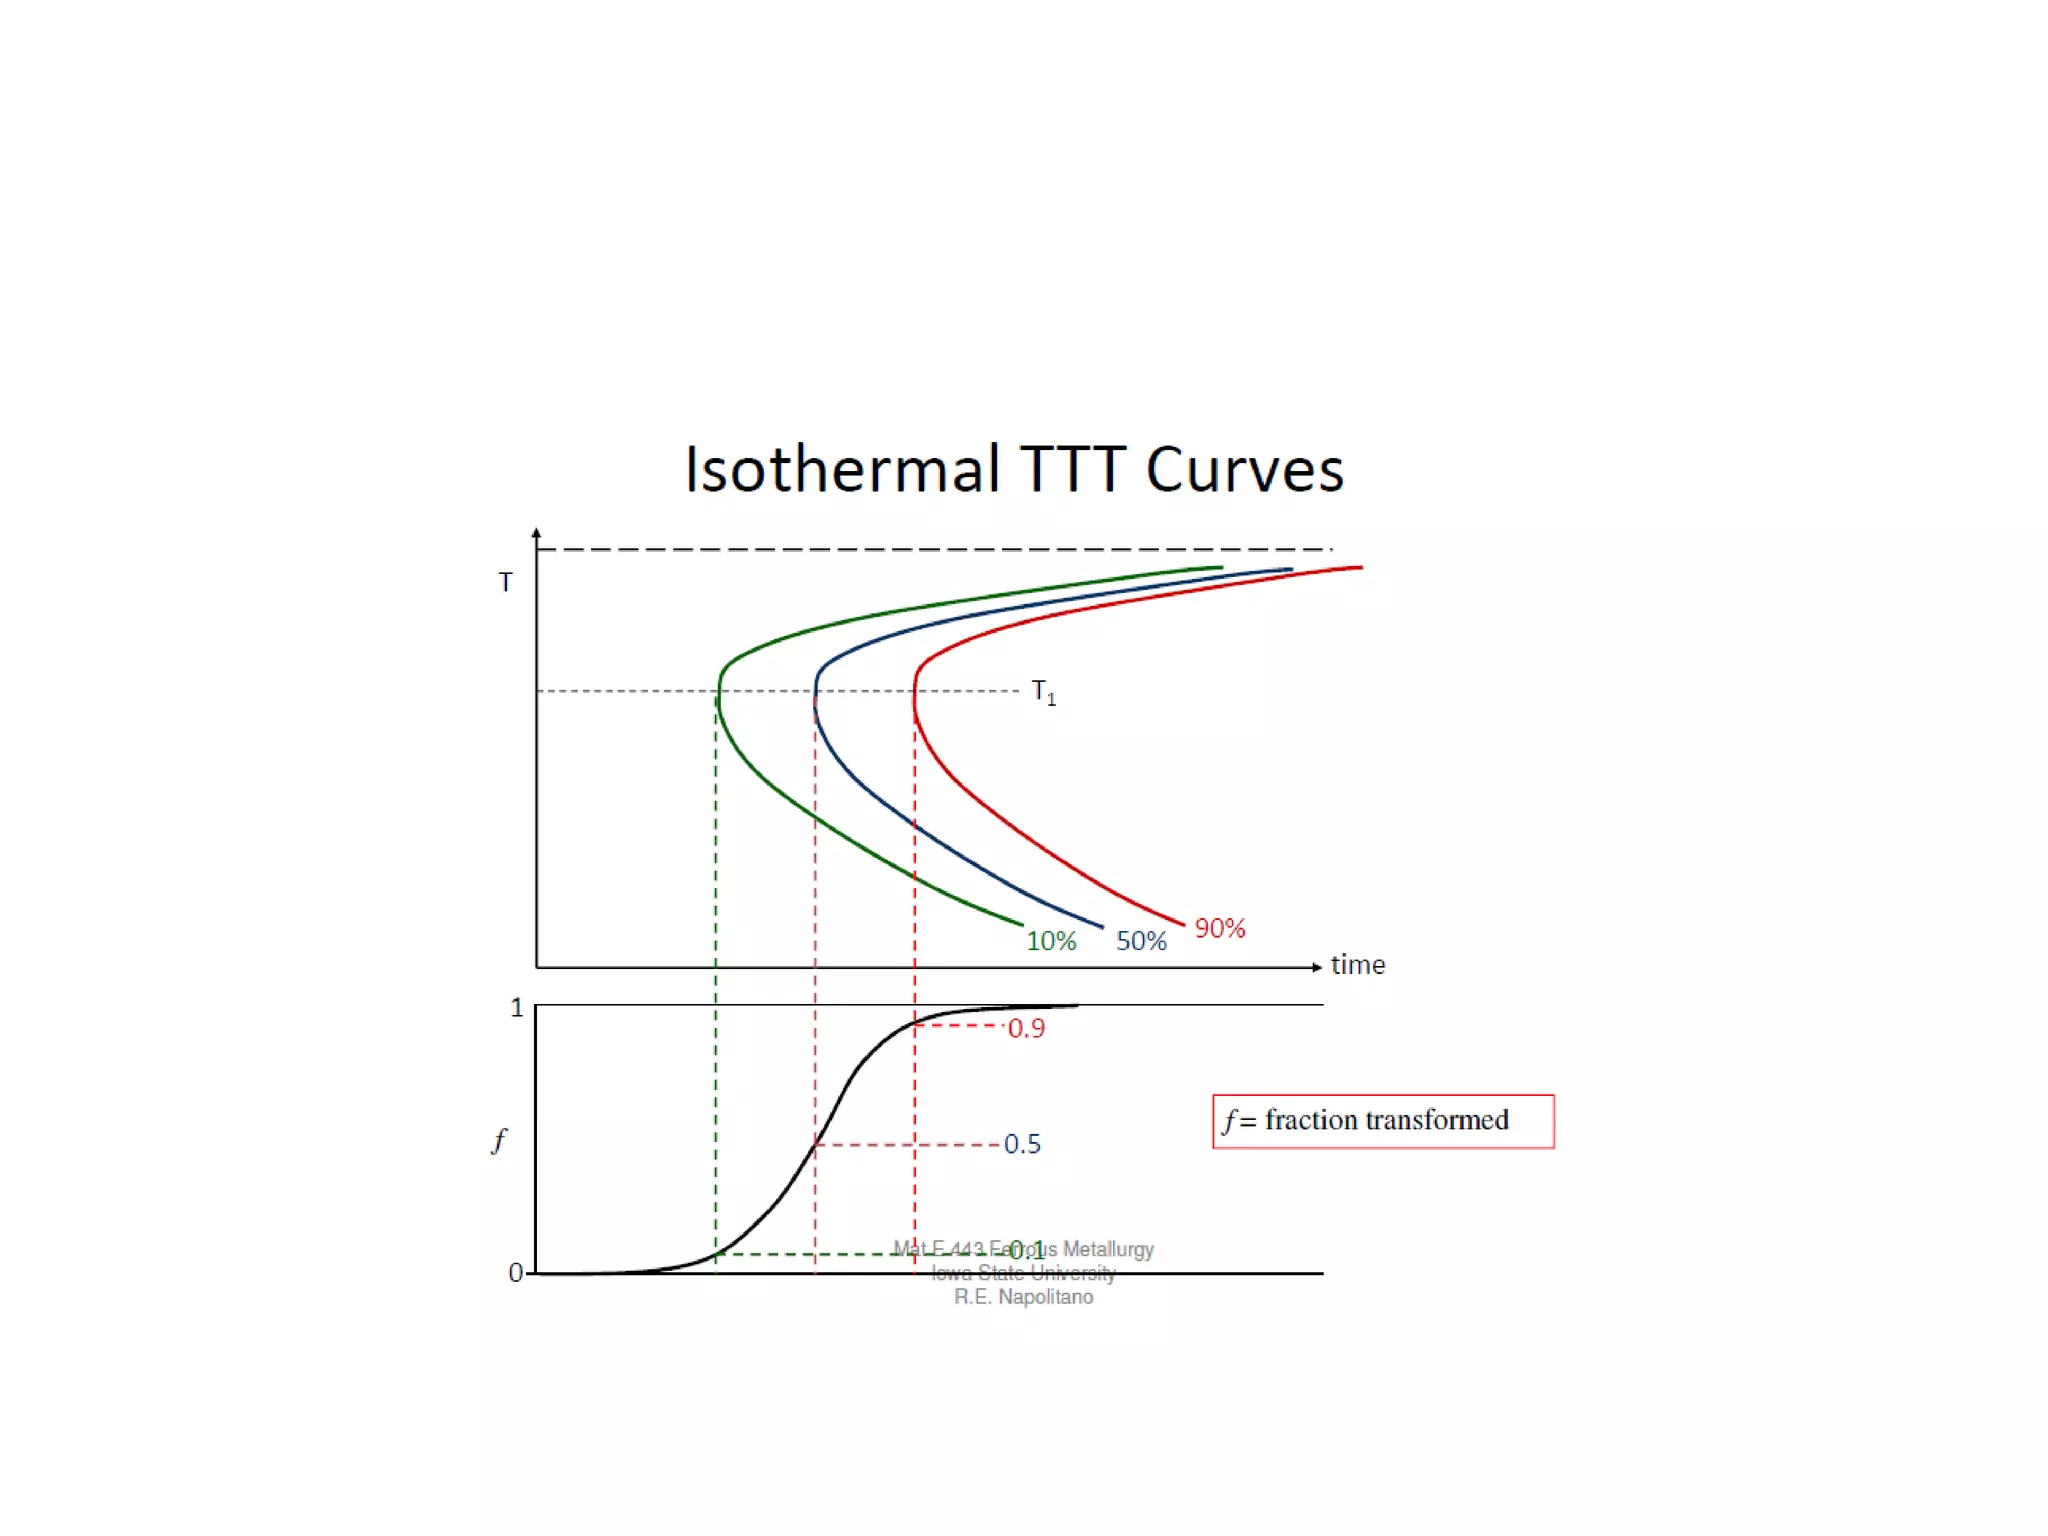
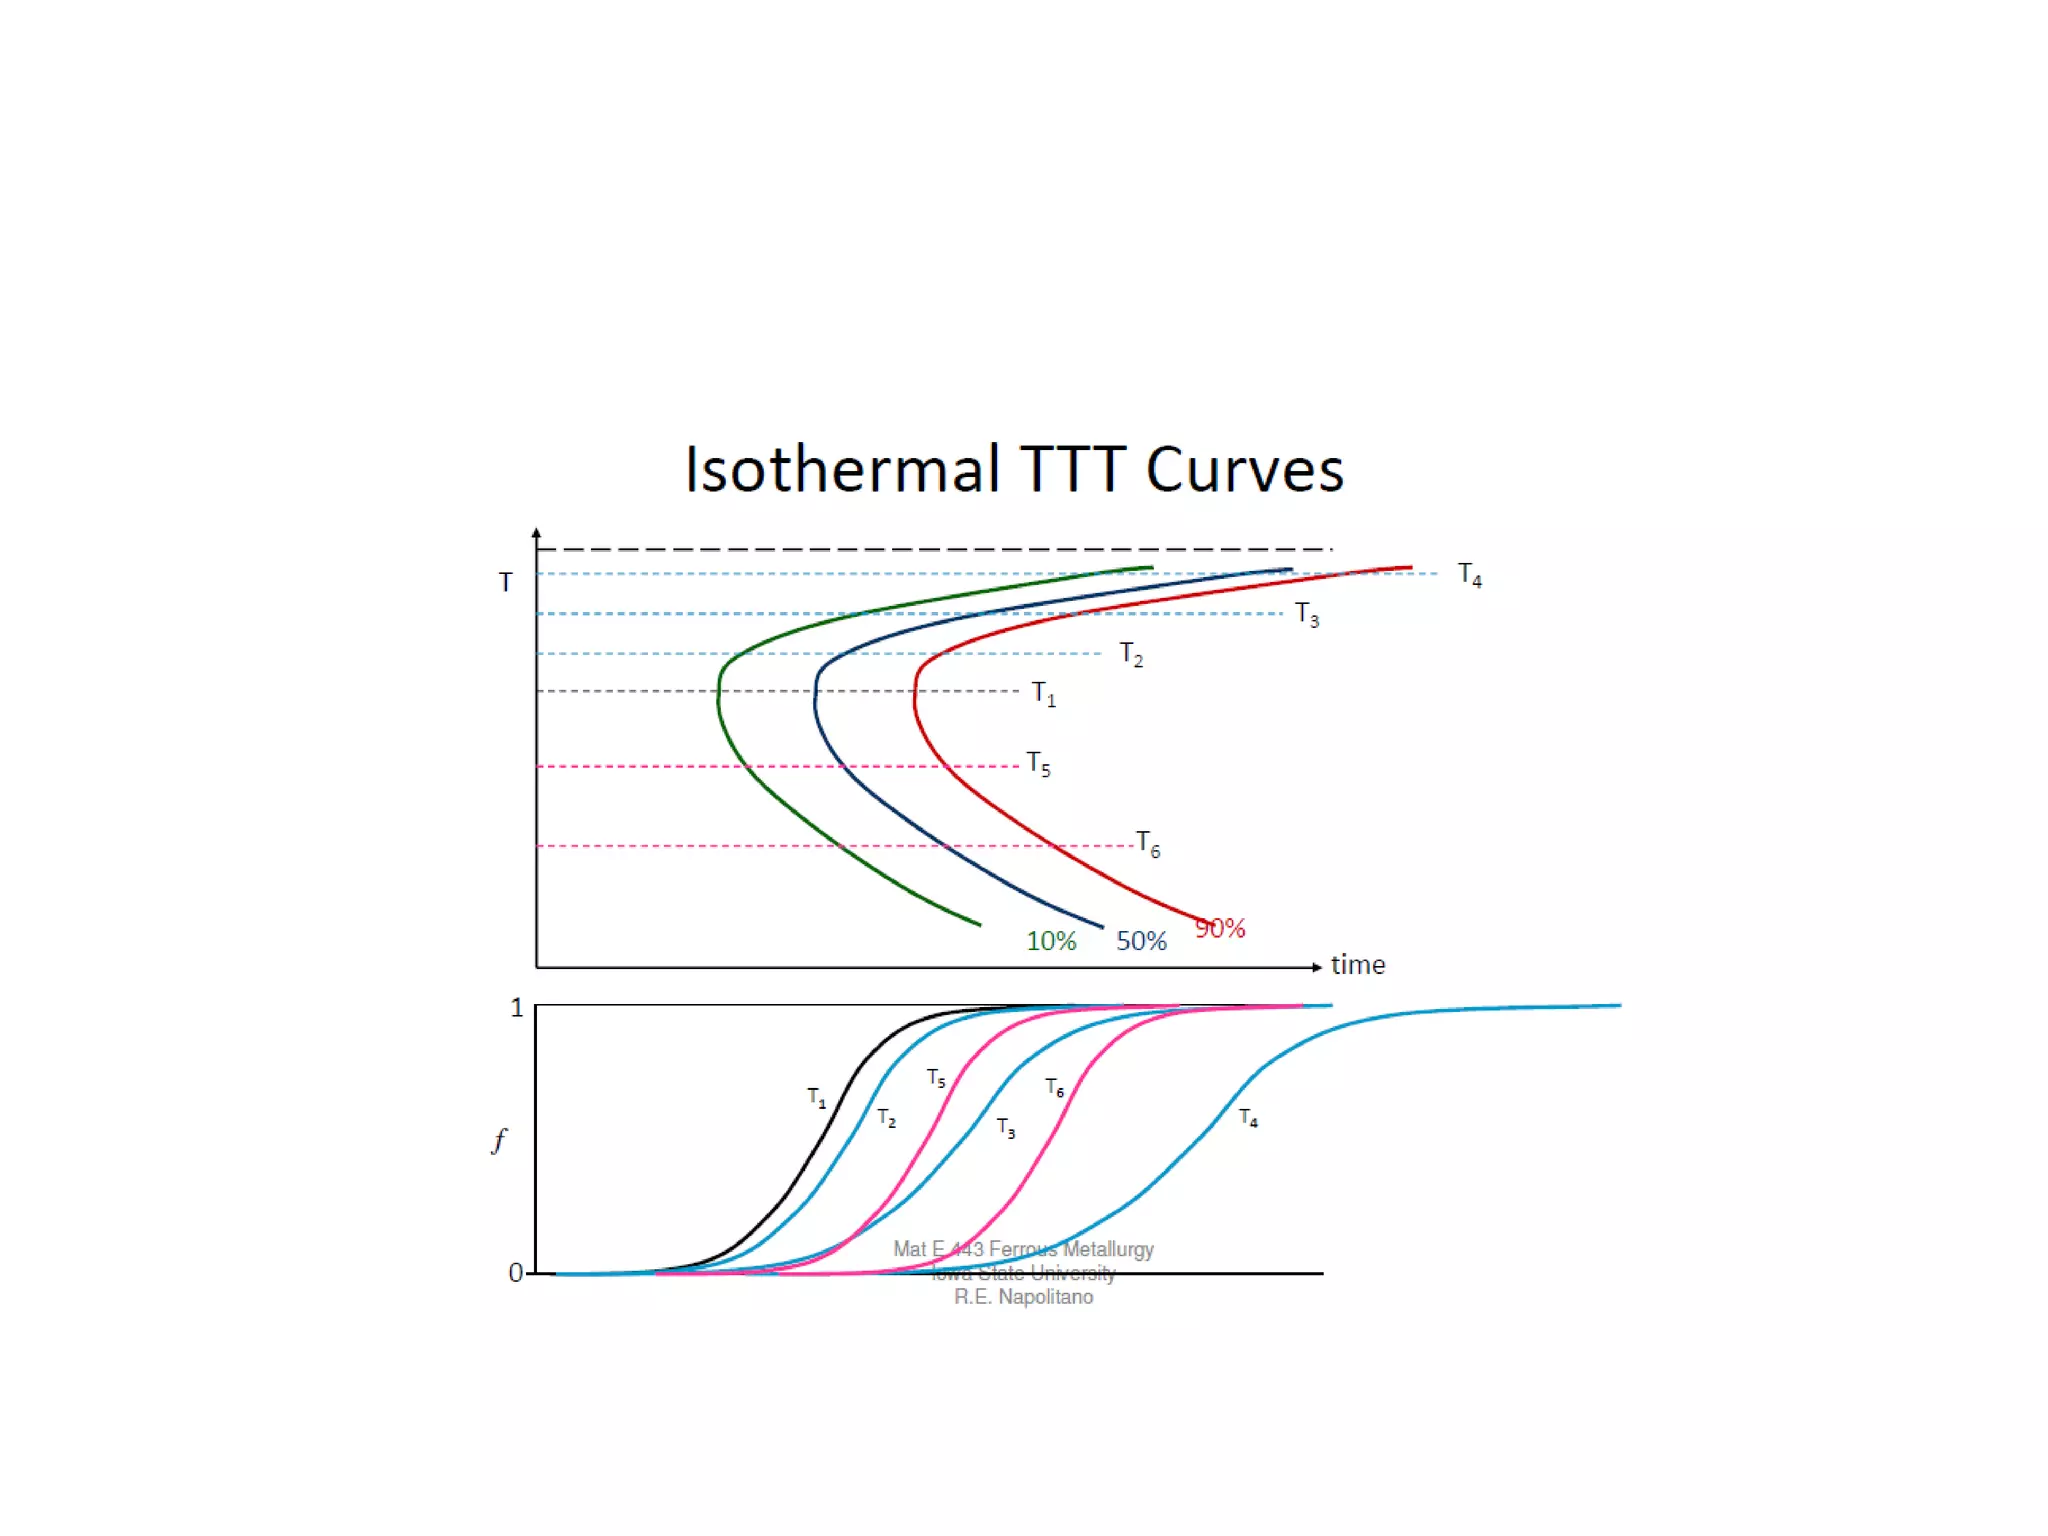


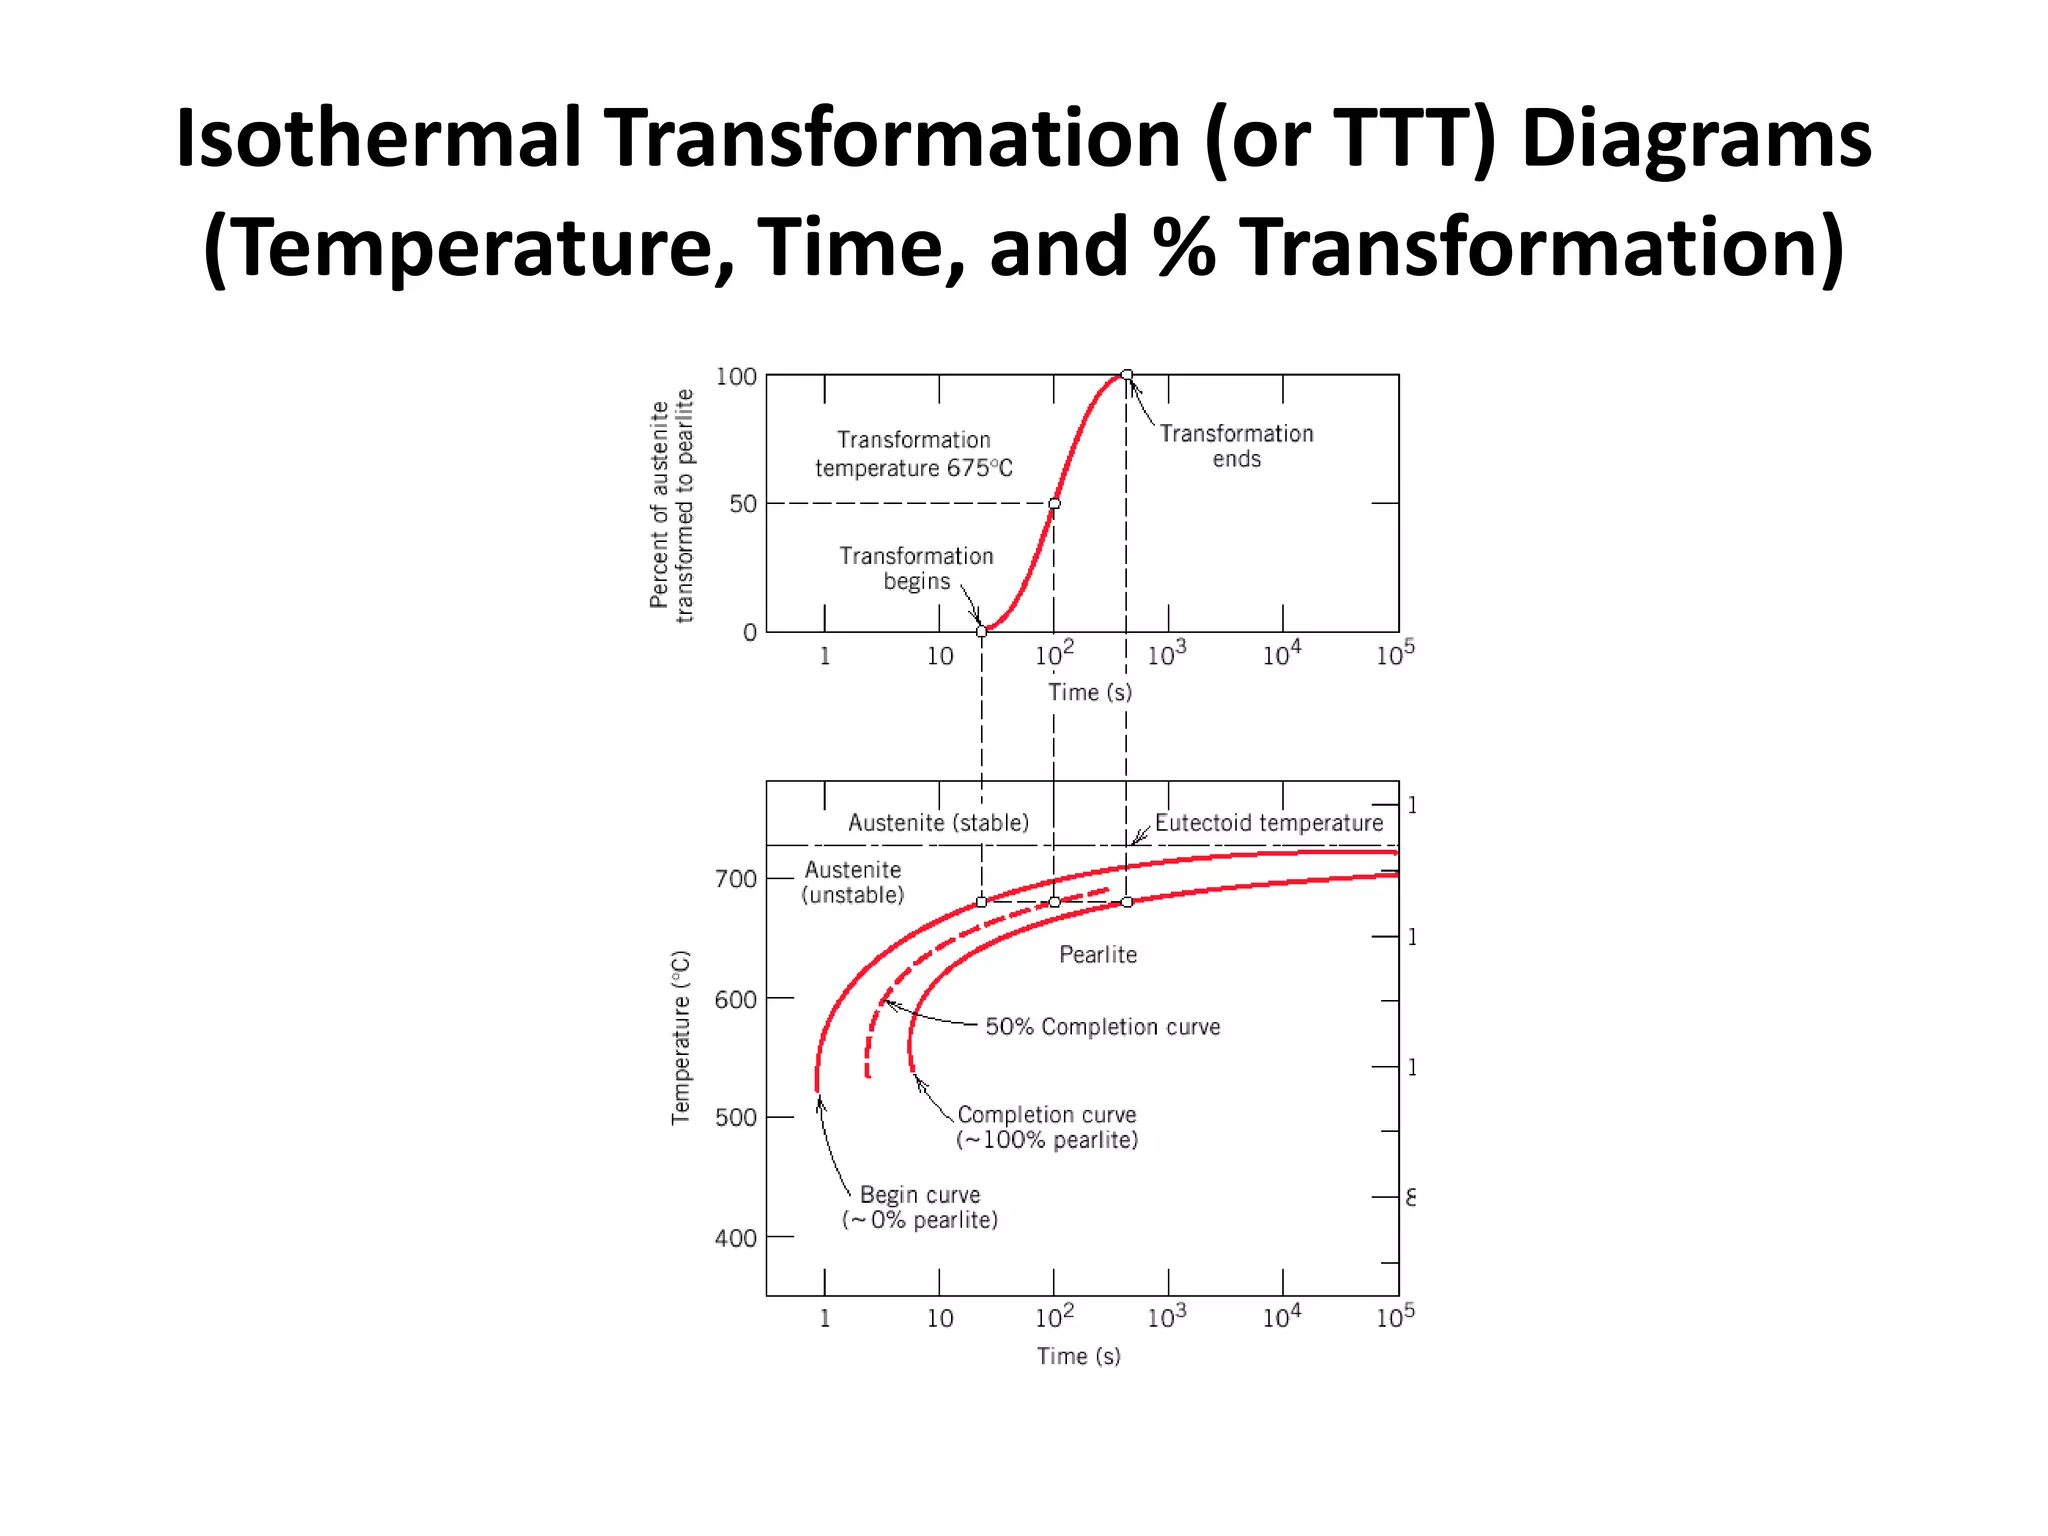
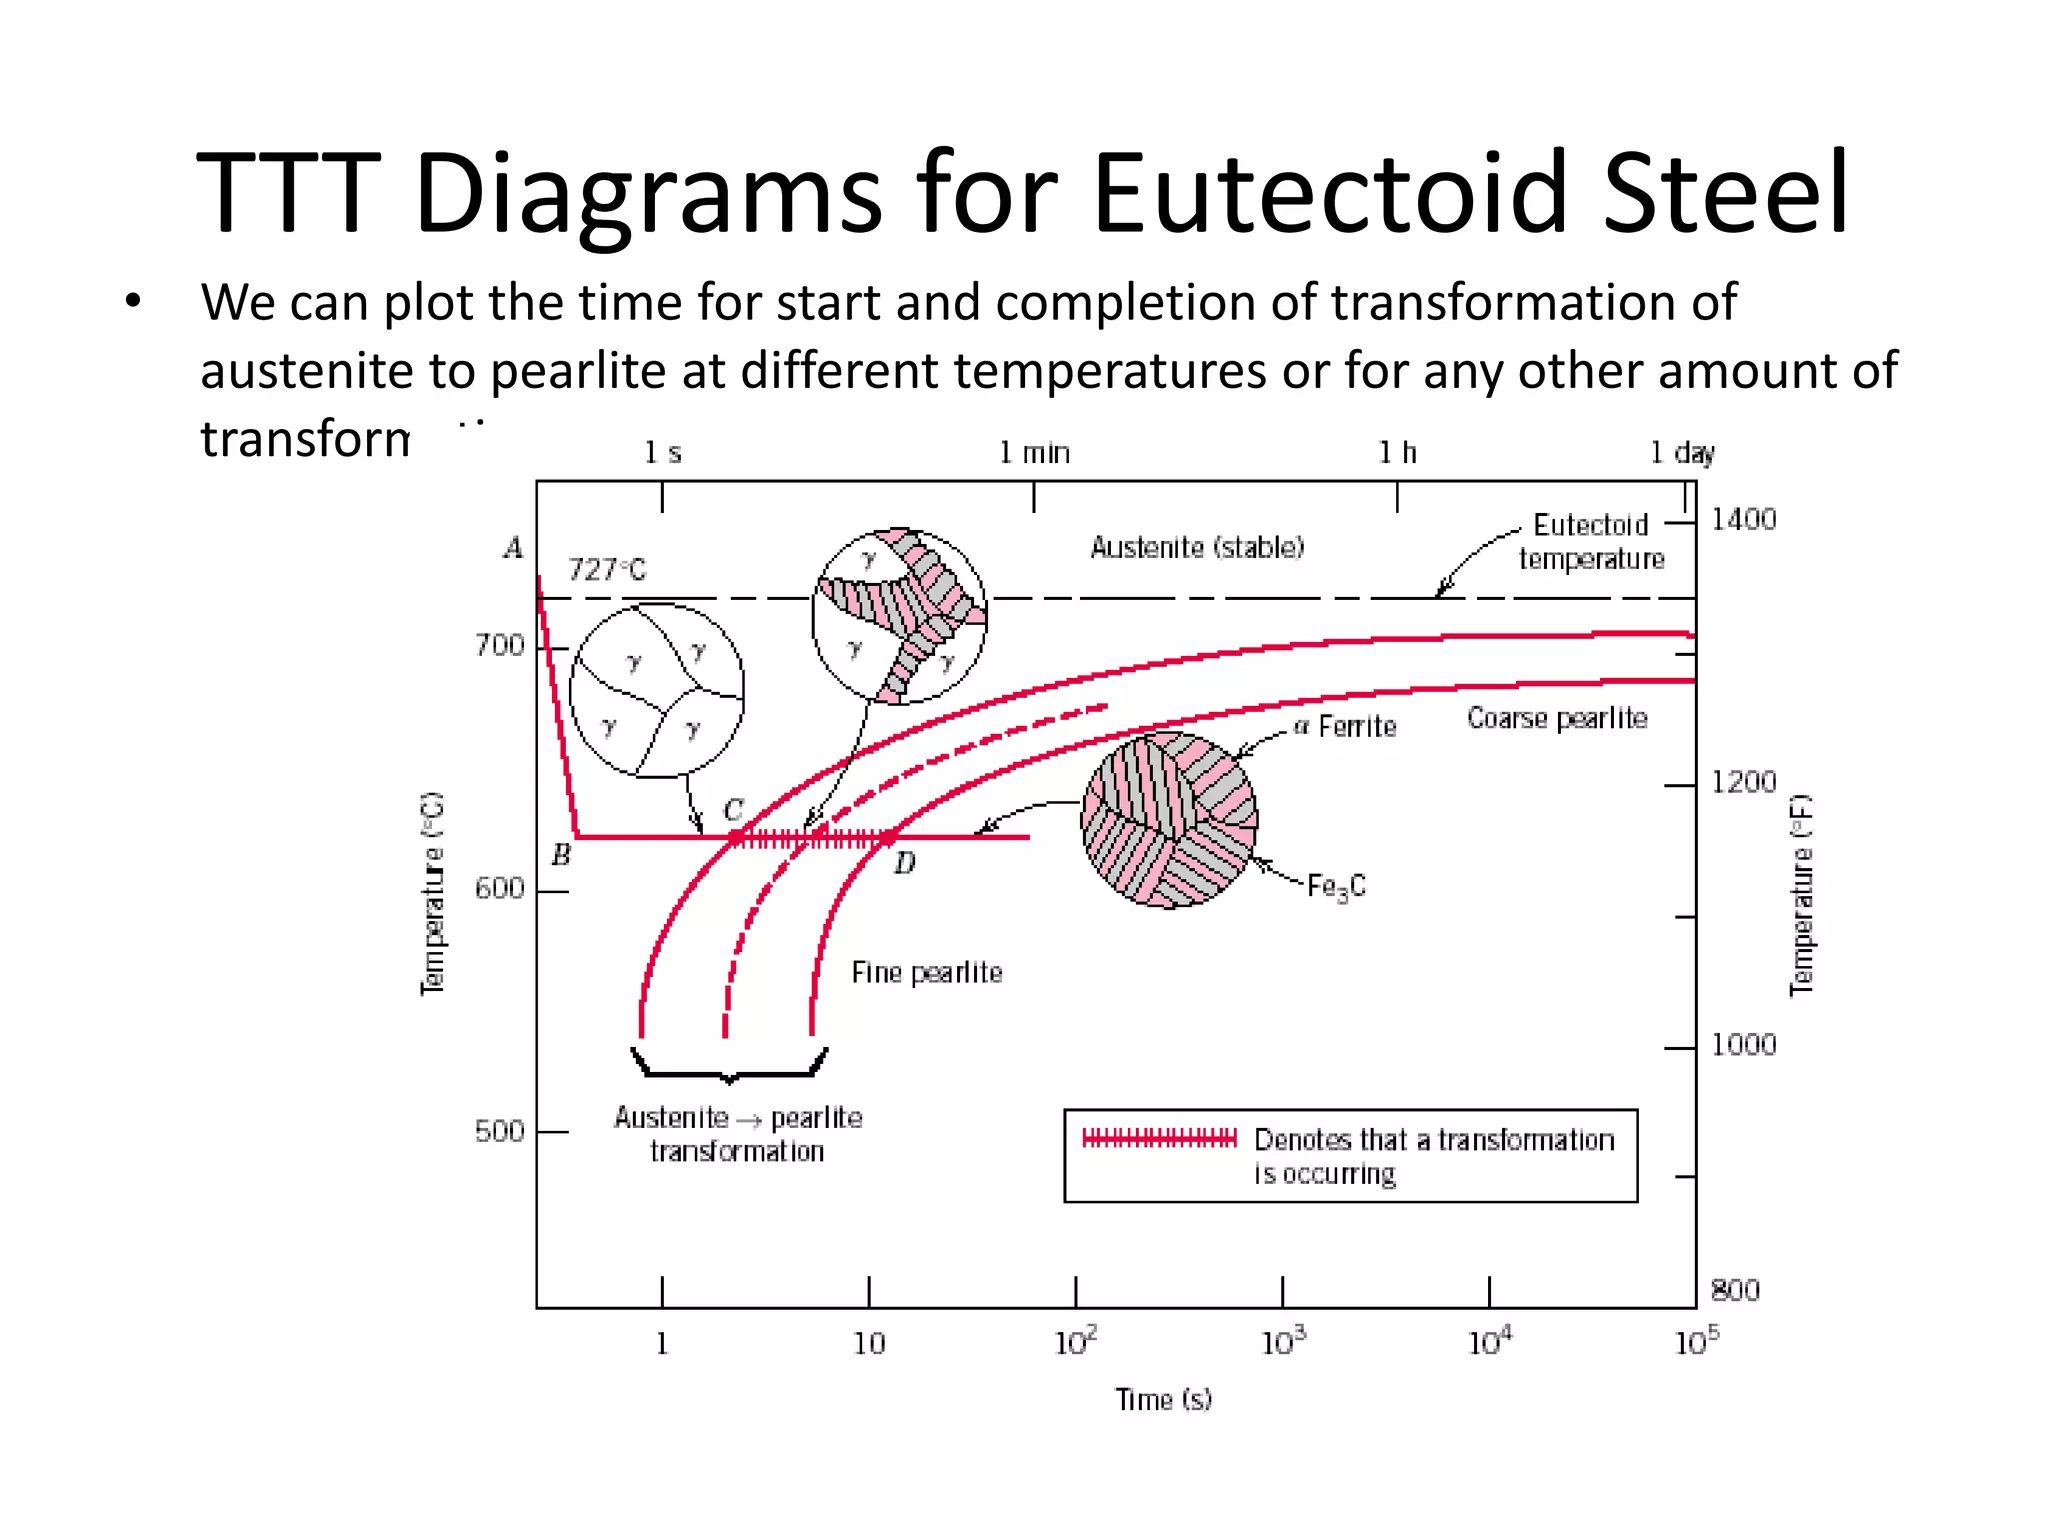


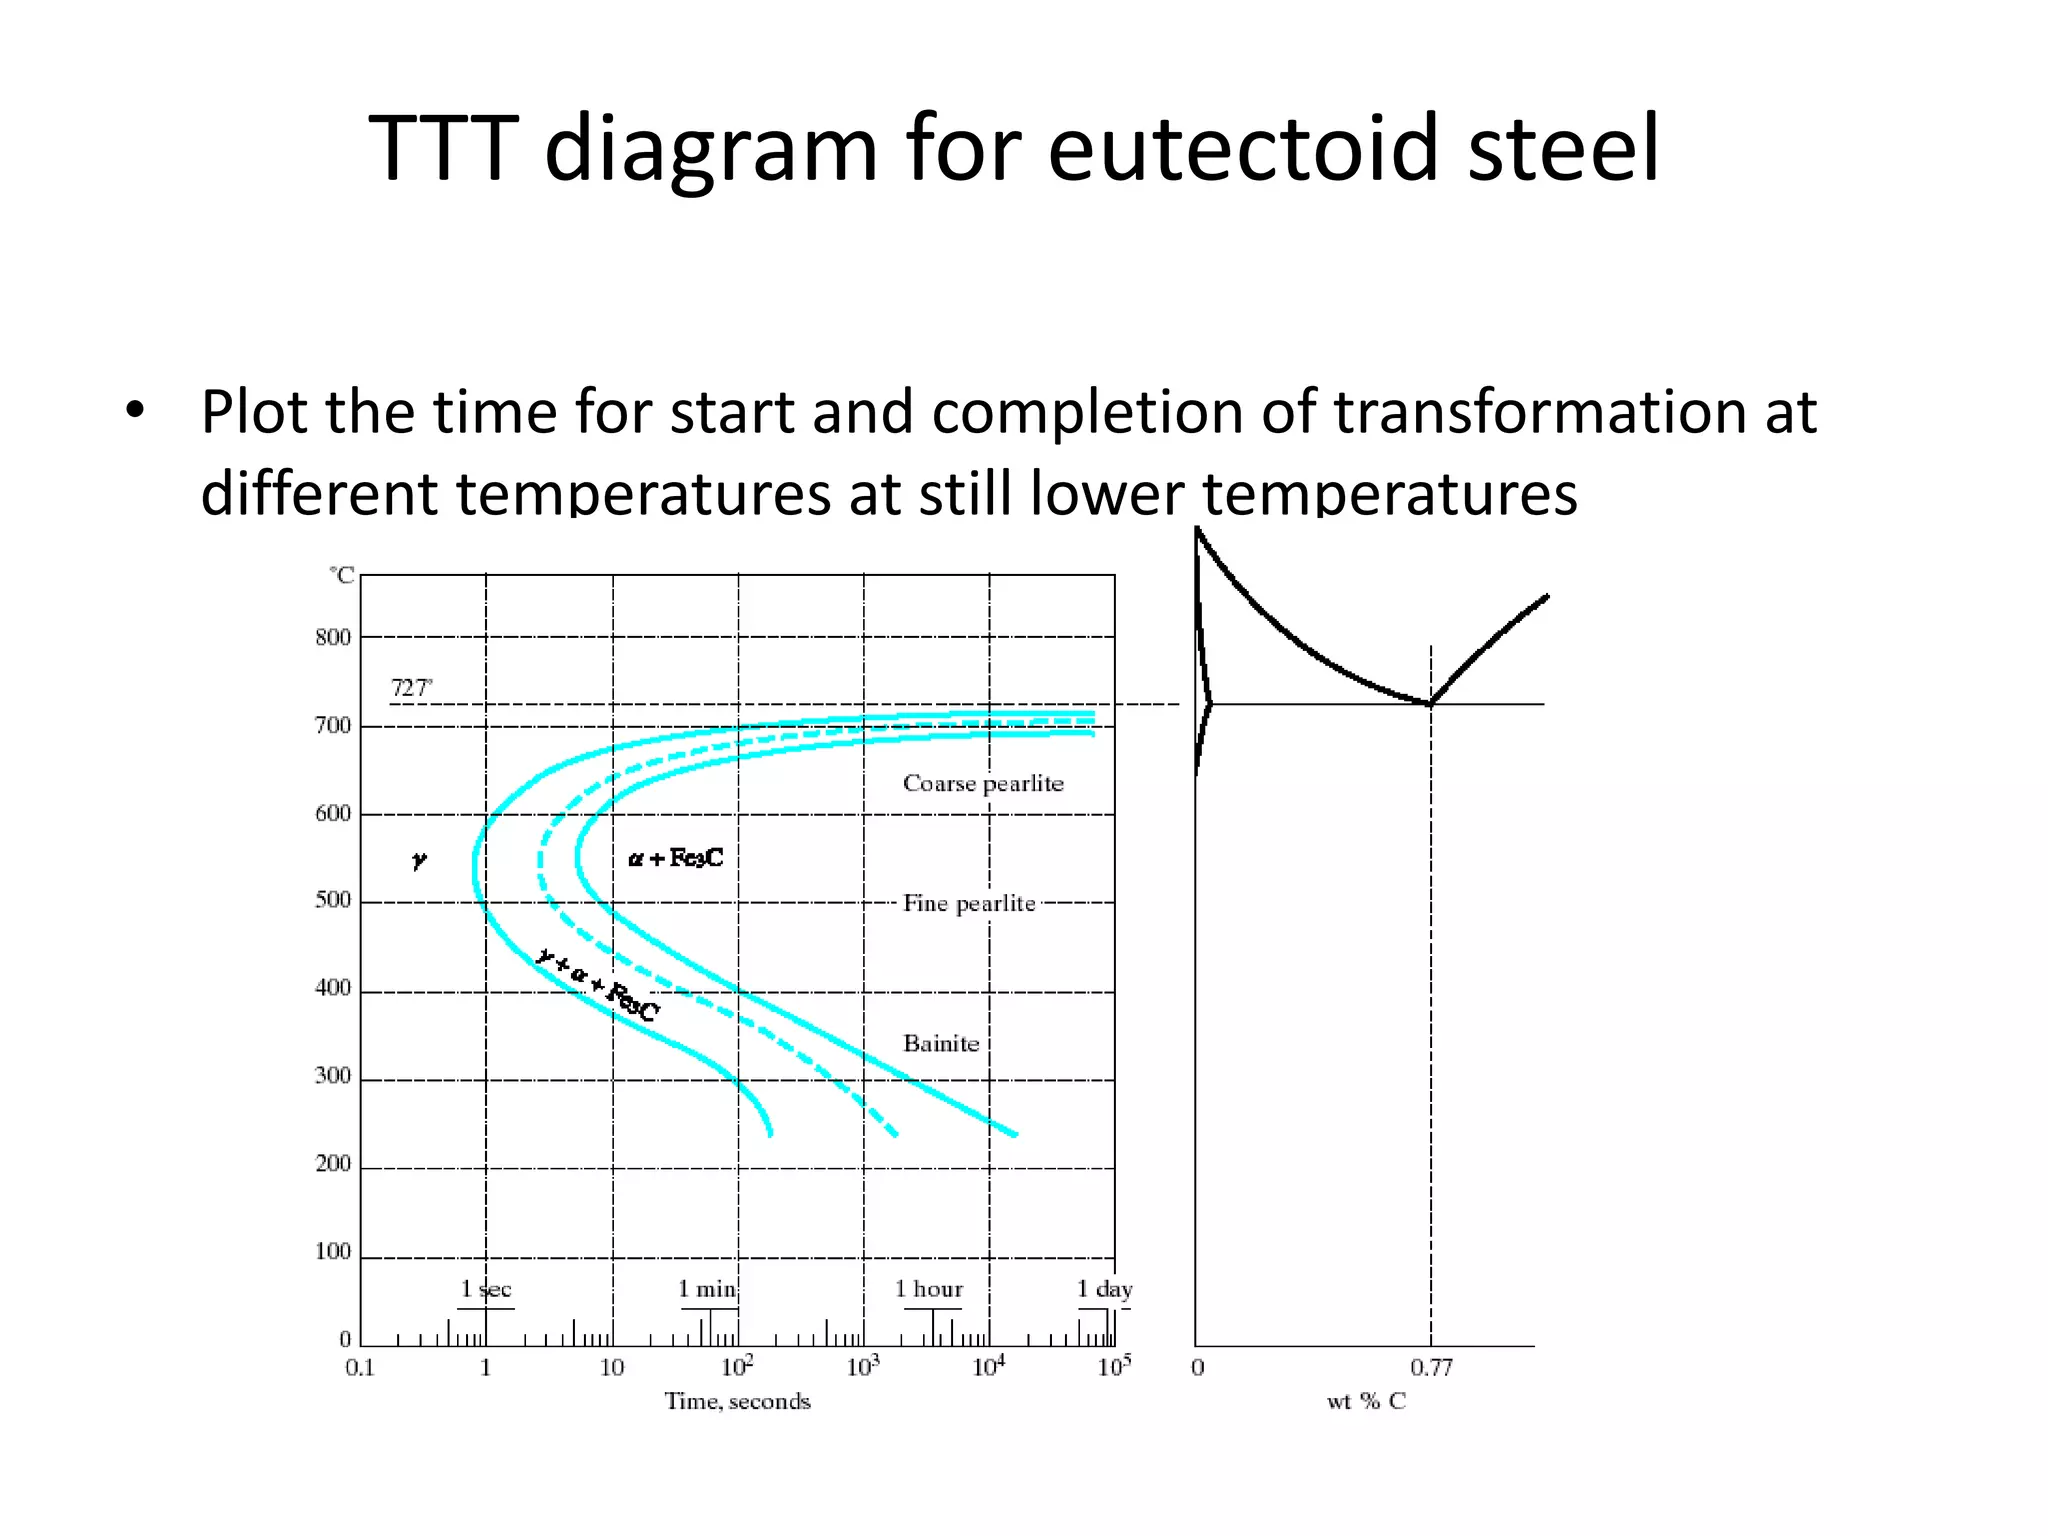

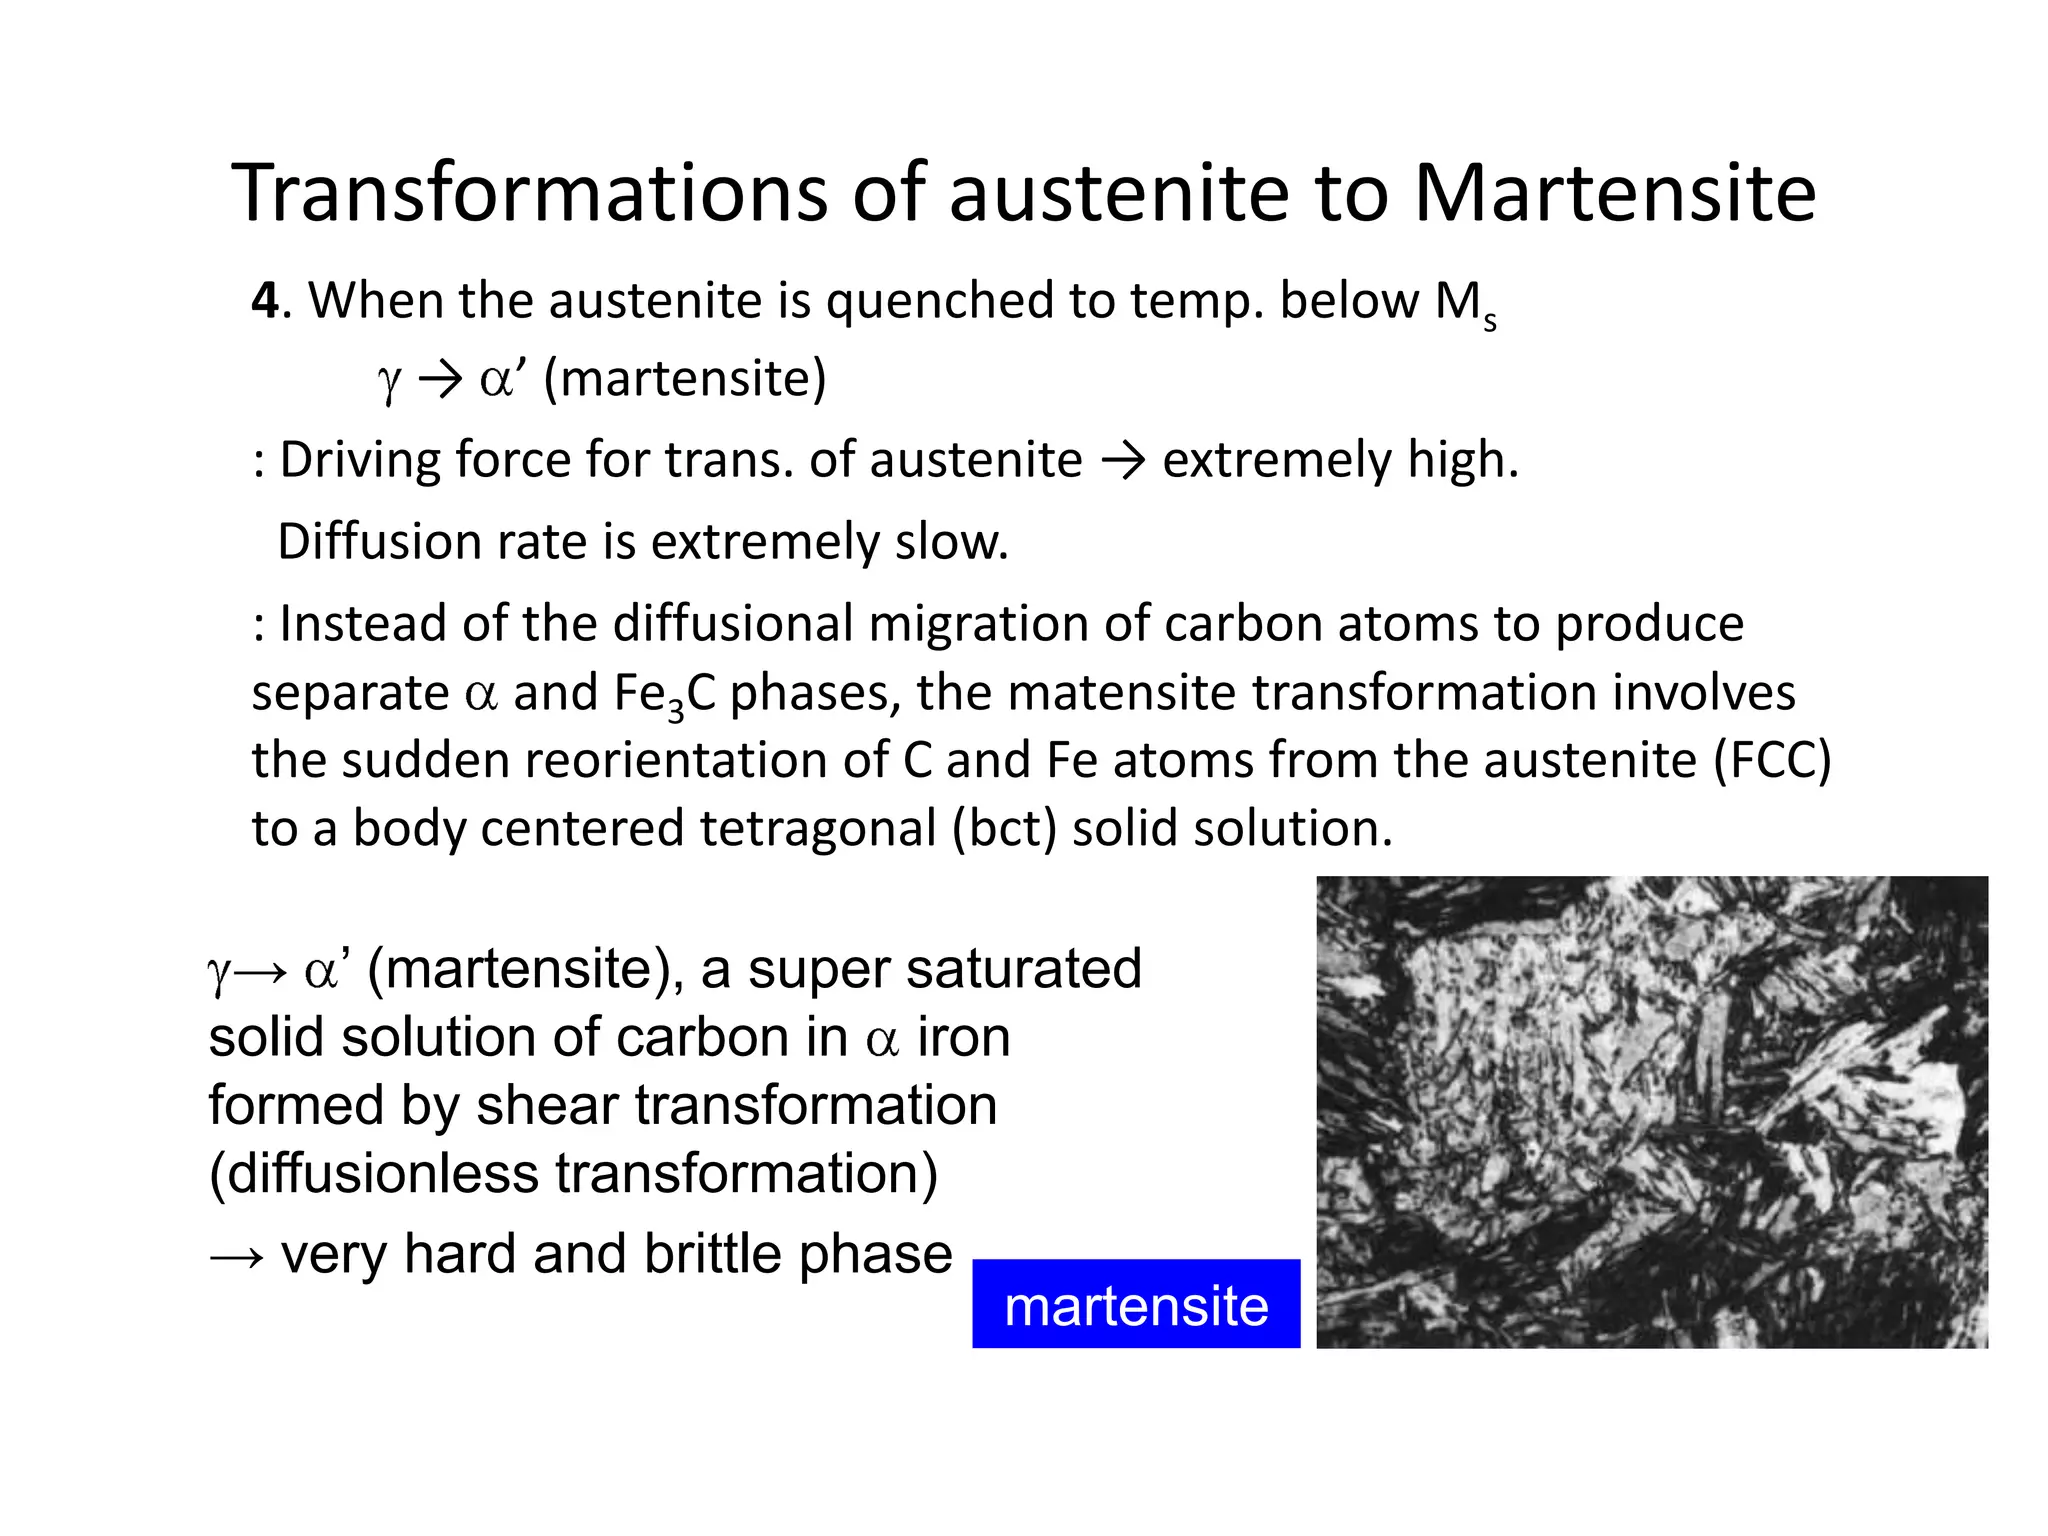

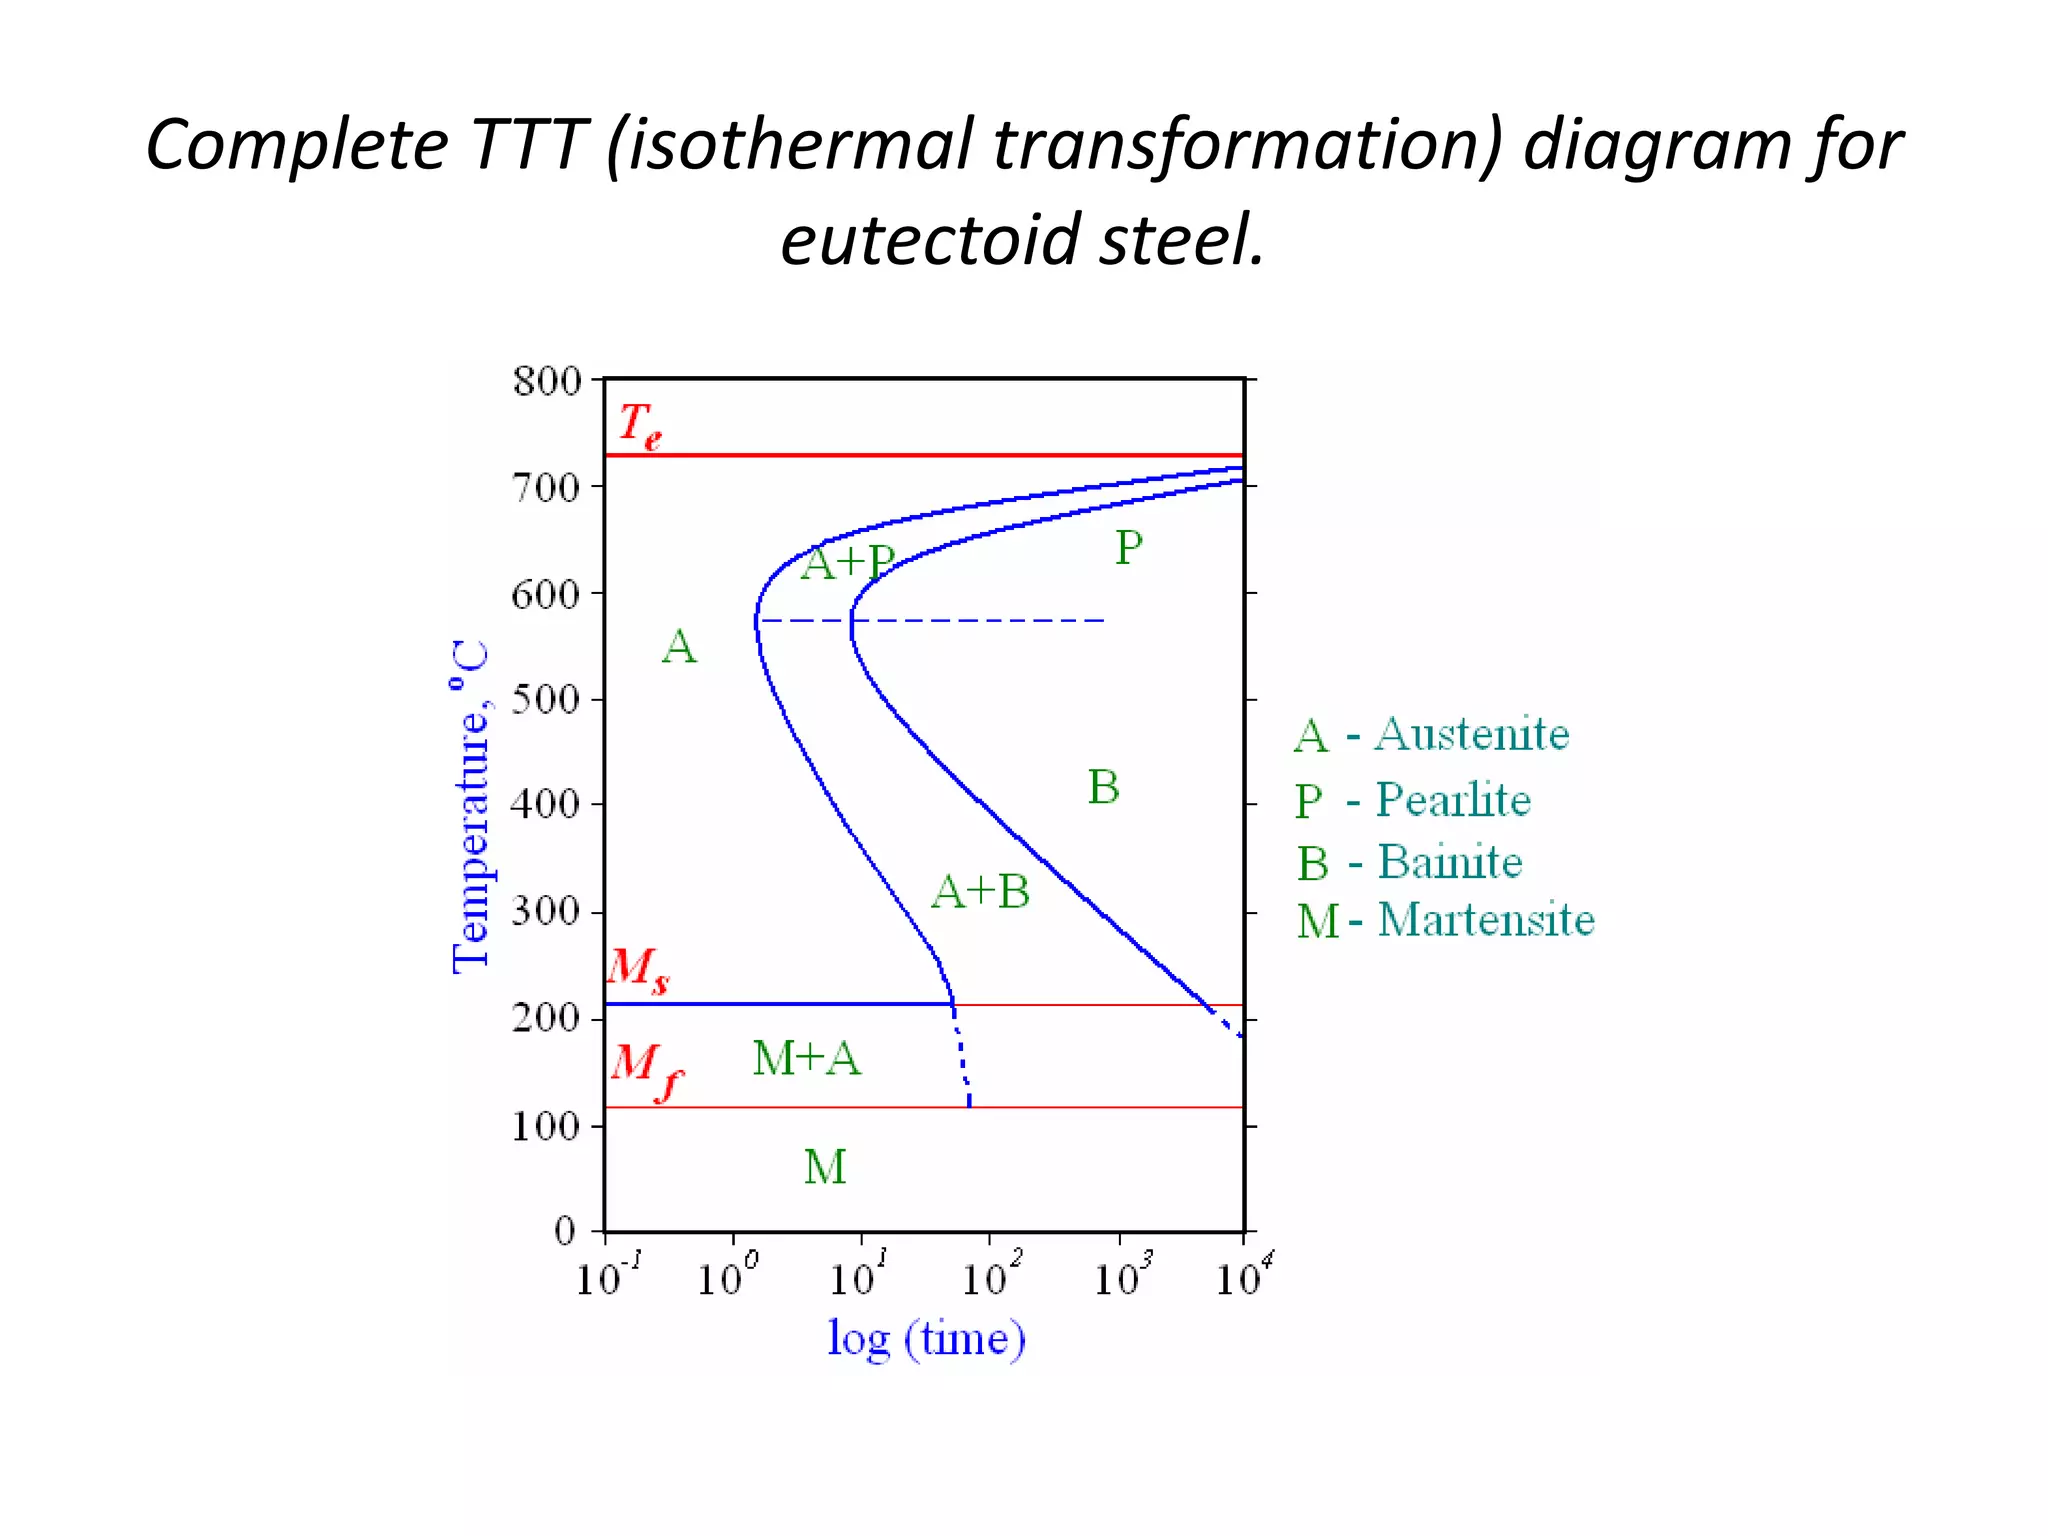


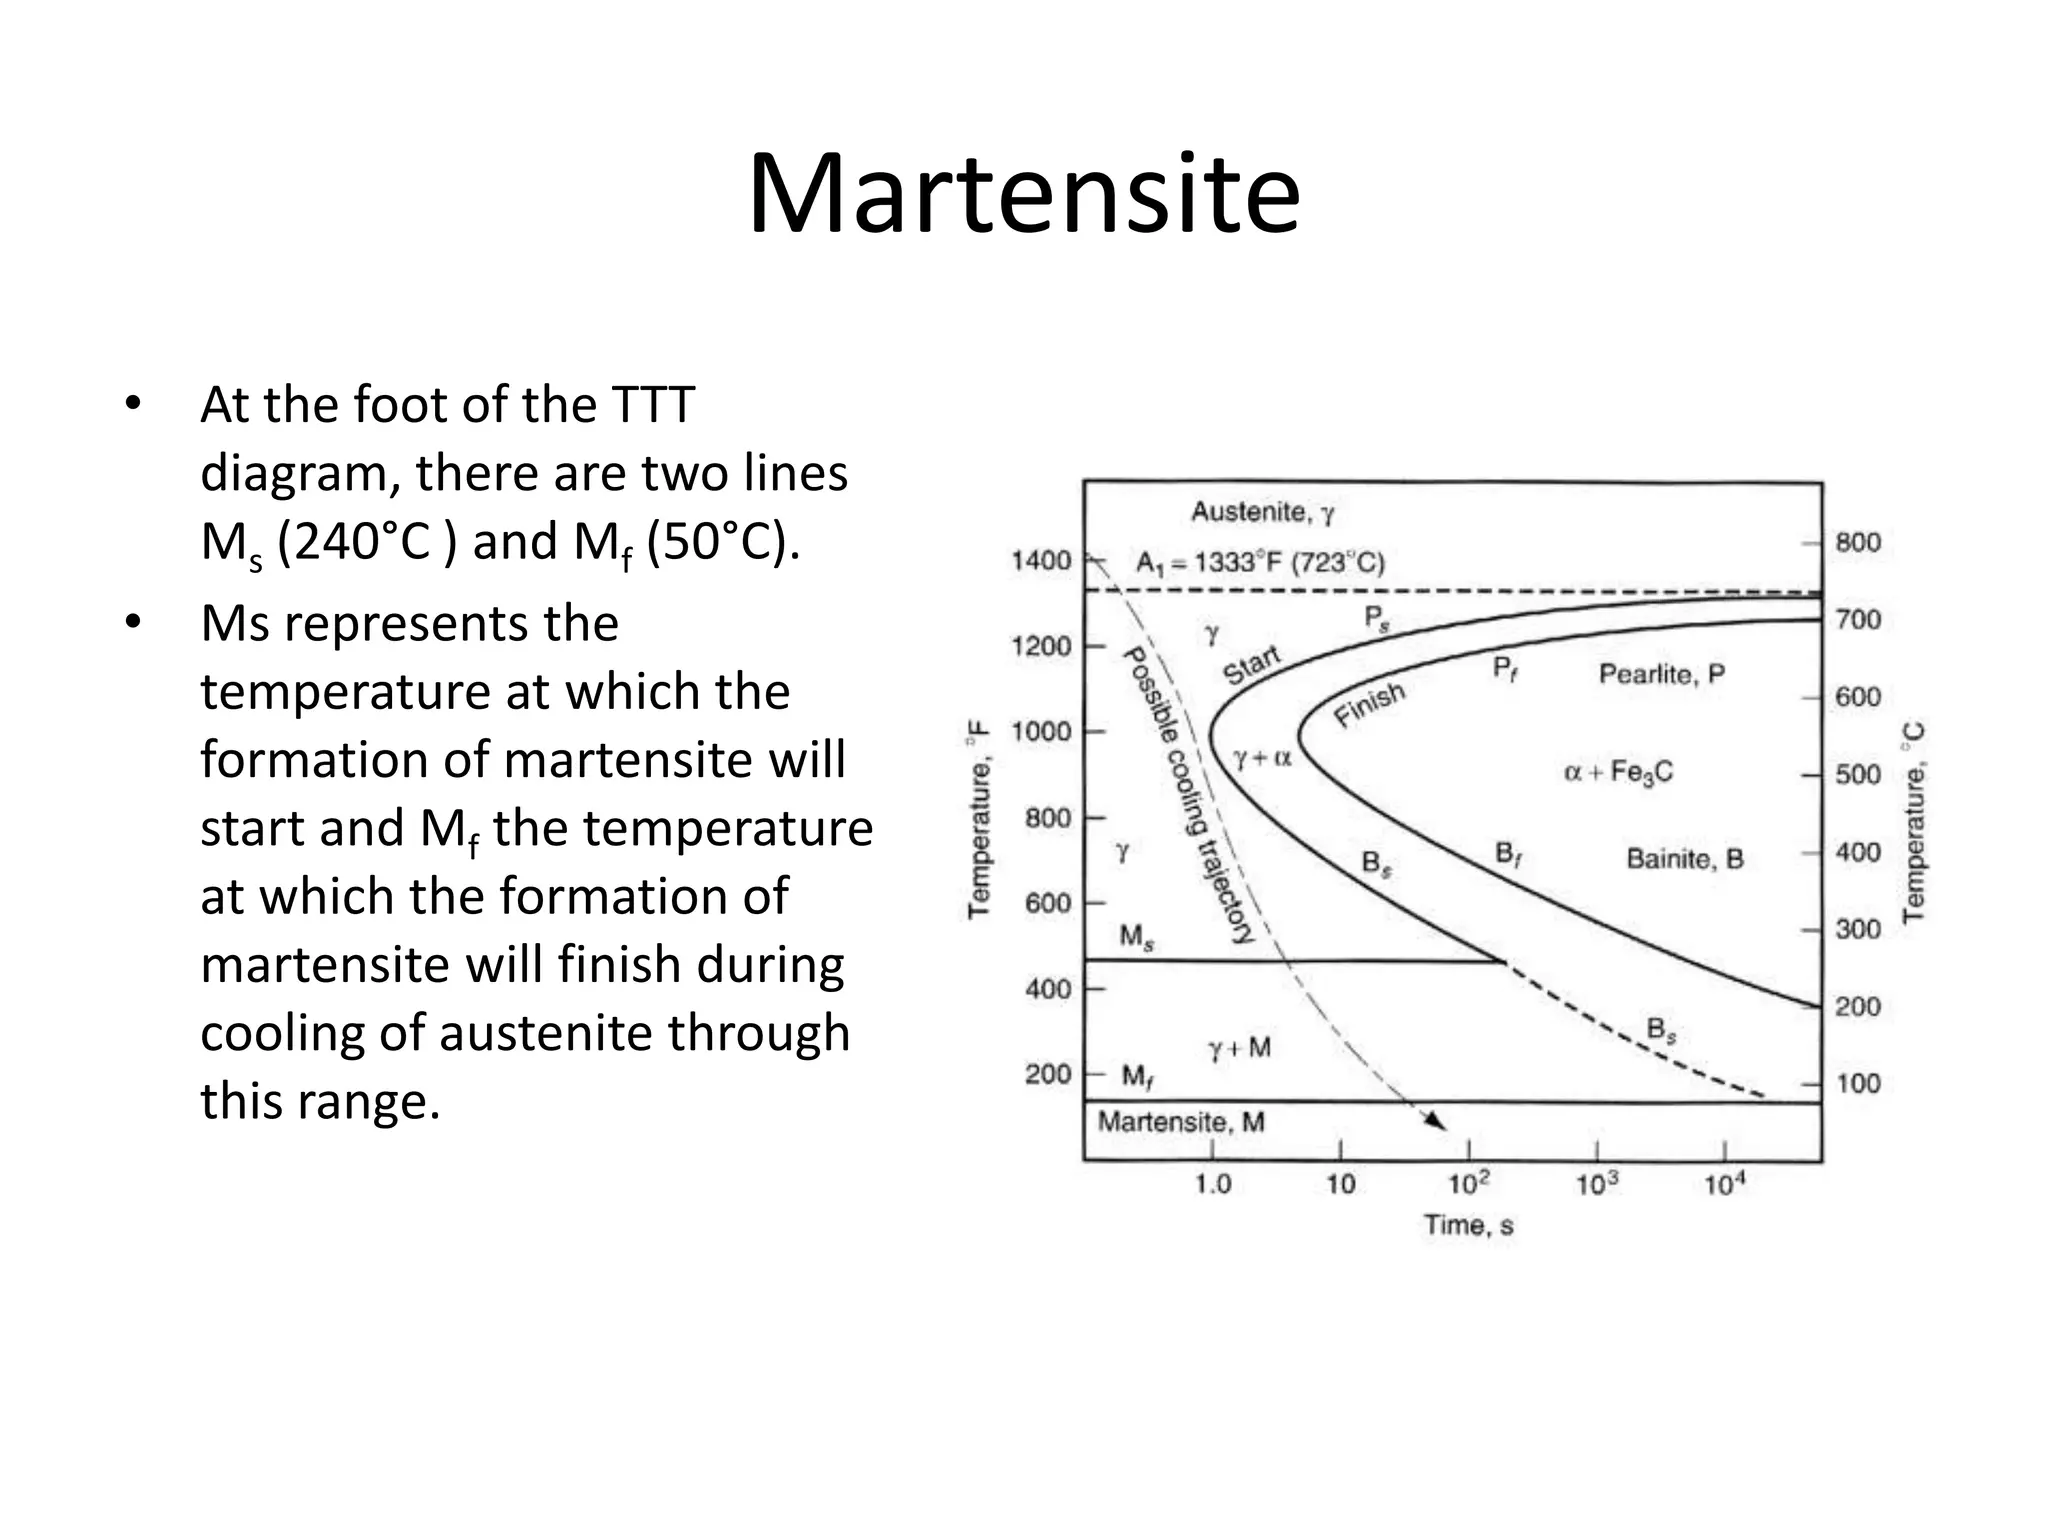


This document discusses time-temperature-transformation (TTT) diagrams and continuous cooling transformation (CCT) diagrams. TTT diagrams show the transformation of austenite at constant temperatures over time, indicating what microstructures form during different cooling rates. CCT diagrams track phase changes during continuous cooling at various cooling rates. Both diagrams are important for selecting processing conditions to achieve desired material properties in steels. The document provides detailed explanations of the various microstructures - pearlite, bainite, martensite - that form during austenite decomposition, and how TTT and CCT diagrams can be used to understand their formation.