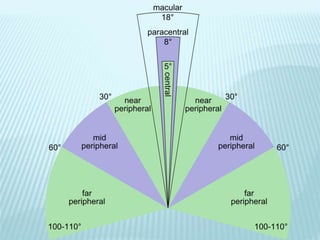
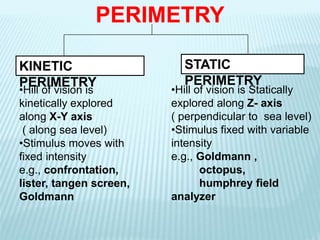
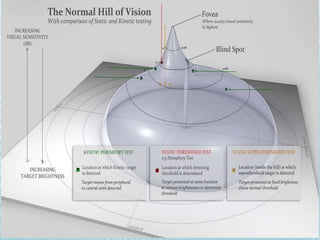
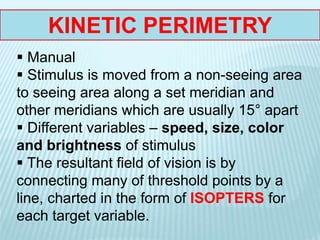
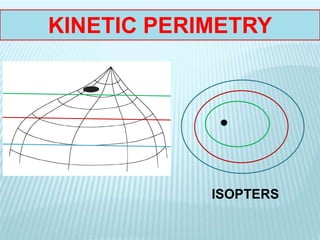
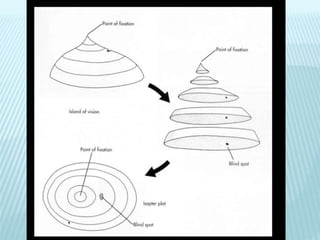
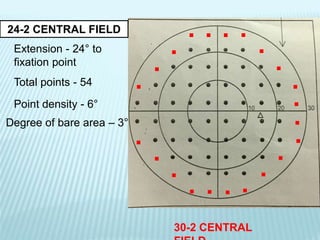
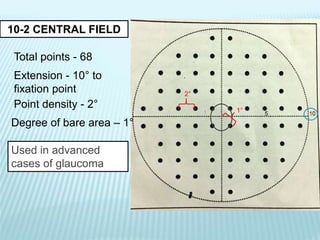
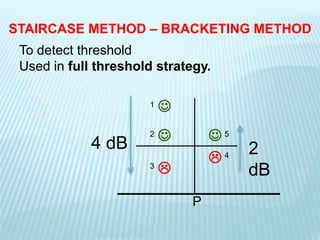
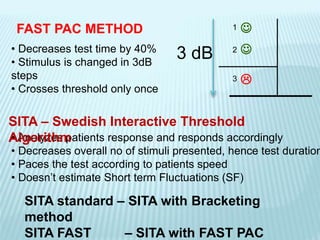
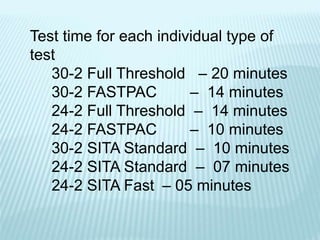
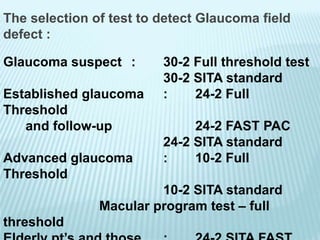
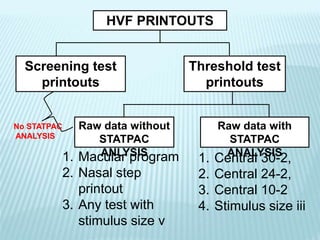
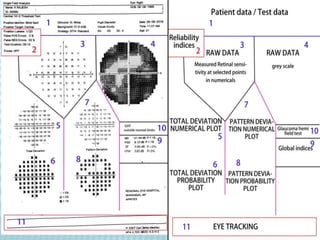
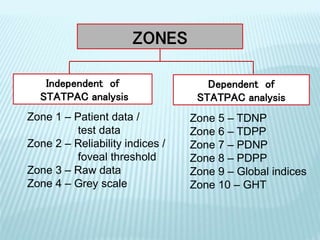
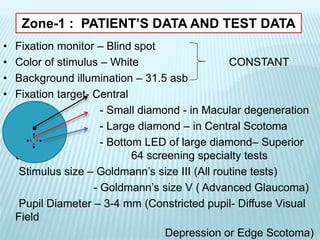
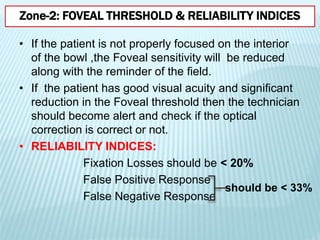
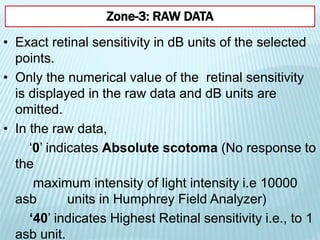
Visual field
Hill of vision
Perimetry
 kinetic perimetry
 static perimetry
variable used : units, threshold
HVF type of tests
point patterns
strategies of tests
time duration of tests
 HVF printouts
zones of printouts
 Andersons criteria
TITLE PAGE
VISUAL FIELD
Part of the environment that is visible to the
steadily fixed eye
X-axis
Y-axis
Z-axis
Functional boundaries of normal visual field:
Approximate a SPIRAL
Superior- 50° temporal- 90°
Inferior- 60° nasal- 60°
X-axis
Y-axis
Z-axis
Traquair described it as
40
-
30
-
20
-
10
-
dB
ISLAND OF VISION IN SEA OF DARKNESS
• It has a shape of a hill
• Peak representing fovea
• 2 slopes representing nasal and temporal field of
Vision
• Sea represents the areas of no light perception
• Under photopic condition, the shape of hill of
vision is closely related to the packing density of
the cones and receptive field size.
Perimetry is the measurement of visual
functions of the eye at topographically
defined loci in the visual field.
• Is a subjective examination method for
estimating the extent of visual fields.
• A decisive diagnostic technique for
recognizing disturbance of visual function /
functional loss of vision
PERIMETRY
1970 - Octopus perimeter was first introduced.
1982 – Humphrey field analyzer first displayed at
AAO.
1983 – Michael Patella showed first clinical trial
1984 – started production
HISTORY
PERIMETRY
KINETIC
PERIMETRY
STATIC
PERIMETRY
•Hill of vision is
kinetically explored
along X-Y axis
( along sea level)
•Stimulus moves with
fixed intensity
e.g., confrontation,
lister, tangen screen,
Goldmann
•Hill of vision is Statically
explored along Z- axis
( perpendicular to sea level)
•Stimulus fixed with variable
intensity
e.g., Goldmann ,
octopus,
humphrey field
analyzer
1.VFD detect earlier
with 20% defect
2. Area fixed but
stimulus varies in
intensity
3. Three dimensional
4. Threshold type
5. Less error
6. Both glaucoma and
neurological
1.Detect when 40%
damage
2. Intensity is fixed
stimulus moves from
but non-seeing to
seeing area
3. Two dimensional
4. Non threshold type
5. More error
6. Good for neurological
KINETIC
PERIMETRY
STATIC
PERIMETRY
KINETIC PERIMETRY
 Manual
 Stimulus is moved from a non-seeing area
to seeing area along a set meridian and
other meridians which are usually 15° apart
 Different variables – speed, size, color
and brightness of stimulus
 The resultant field of vision is by
connecting many of threshold points by a
line, charted in the form of ISOPTERS for
each target variable.
KINETIC PERIMETRY
ISOPTERS
LISTER’S PERIMETER
OCTOPUS
STATIC PERIMETRY
 Computerized
 Stimulus size is maintained constant
 Brightness varied at various predetermined
constant locations in order to find out the
threshold at these locations
 In other words contrast sensitivity is tested
throughout the extent of area perceived
 Final outcome is the threshold value determined
at predetermined locations ( numerical value)
•Calculates the
height of the
visual field at a
predetermined
loci.
•Gives the
information of
RETINAL
SENSITIVITY at
that loci
Units used to express light intensity and Retinal
Sensitivity:
APOSTILBS (asb) UNITS:
ABSOLUTE units of light intensity
i.e., 100 asb units of light intensity is same in any
instrument
DECIBEL (dB)
UNITS:RELATIVE units of light intensity
i.e., decibel value in an instrument depends on
the maximum intensity of light that can be
produced by that instrument
 Light intensity expressed in – asb (or) dB units
Retinal sensitivity expressed in – db units
Relation between asb units and dB
unit:1dB = 1/10 log unit of attenuation of maximum
available stimulus in an instrument
dB-asb scale of
Humphrey field analyzer
In humphrey system:
Maximum intensity of light is
10,000 asb = 0 dB
Minimum intensity of light is
1 asb = 40 dB
THRESHOLD OF LIGHT
STIMULUS:
Definition:
Minimum brightness which the pt can see at a given
location.
Threshold for a given point is defined as that intensity of
stimulus which has a 50 percent probability of being seen.
SUPRATHRESHOLD OF LIGHT STIMULUS:
intensity of stimulus which has a 90 percent
probability of being seen.
INFRATHRESHOLD OF LIGHT STIMULUS:
intensity of stimulus which has a 15 percent
probability of being seen.
SIZE OF STIMULUS:
Standard size : goldmann size III
For macular disorders : goldmann size
V
BACKGROUND
ILLUMINATION:Octopus 101 : 4 asb (1.27 cd/m2)
Octopus 1-2-3 : 31.4 asb (10 cd/m2)
Humphrey 700 : 31.5asb (10 cd/m2 )
STIMULUS INTENSITY:
OCTOPUS 1-2-3 : HUMPHREY :
MAX: 4,000 asb MAX: 10,000
asb
MIN: 0.4 ASB MIN: 1 asb
GOLDMANN STIMULUS
SIZES
STIMULUS DURATION:
200 milliseconds
Classification of Humphrey visual field tests
THRESHOLD TESTS SCREENING
TESTS
Depending on testing strategy
CENTRAL
TESTS
PERIPHERAL
TESTS
SPECIALITY
TESTS
• Central 30-2
• Central30-1
• Central 24-2
• Central24-1
• Central 10-2
• Central 10-1
• Macular program
• Peripheral 60-4
• Nasal step
• Temporal crescent
• Neurological 20
• Neurological 30
Depending on point pattern
POINT PATTERN
Where we test – which part of the retina
tested ?
factors should noted in a specific point pattern are:
1. Extension of visual field.
2. Number of test points.
3. Point density (the distance between two points
in degrees).
4. The degree of bare area around the fixation
point.
5. The relation of the points to the horizontal and
vertical axes.
30-2 CENTRAL FIELD
Extension - 30° to
fixation point
Total points - 76
Point density - 6°
Degree of bare area –
3°
3°
6°
. . . . . . . . .
..
........
. . .
24-2 CENTRAL FIELD
Extension - 24° to
fixation point
Total points - 54
Point density - 6°
Degree of bare area – 3°
30-2 CENTRAL
10-2 CENTRAL FIELD
Extension - 10° to
fixation point
Total points - 68
Point density - 2°
Degree of bare area – 1°
2°
1°
Used in advanced
cases of glaucoma
MACULAR PROGRAMME
Extension - 3° to
fixation point
Total points - 16
Point density - 2°
Degree of bare area – 1°
10-2 CENTRAL FIELD
WHY WE SELECT 30-2, 24-2, 10-2
OVER 30-1, 24-1,10-1
Total points – 76
Bare area around fixation – 3°
Total points – 71
Bare area around fixation – 6°
THRESHOLD TESTING STRATEGIES
How we test ?= strategy = method of presenting a
stimulus.
Screening (or)
suprathreshold
testing strategy
Threshold
testing strategy
OLD NEW
 Full threshold
strategy
 FAST PAC
 SITA standard
 SITA fast
SITA – Swedish Interactive Threshold Algorith
STAIRCASE METHOD – BRACKETING METHOD
To detect threshold
Used in full threshold strategy.


 

1
2
3
4
5
P
4 dB 2
dB
FAST PAC METHOD


1
2
3
3 dB• Decreases test time by 40%
• Stimulus is changed in 3dB
steps
• Crosses threshold only once

• Analyzes patients response and responds accordingly
• Decreases overall no of stimuli presented, hence test duration
• Paces the test according to patients speed
• Doesn’t estimate Short term Fluctuations (SF)
SITA – Swedish Interactive Threshold
Algorithm
SITA standard – SITA with Bracketing
method
SITA FAST – SITA with FAST PAC
Test time for each individual type of
test
30-2 Full Threshold – 20 minutes
30-2 FASTPAC – 14 minutes
24-2 Full Threshold – 14 minutes
24-2 FASTPAC – 10 minutes
30-2 SITA Standard – 10 minutes
24-2 SITA Standard – 07 minutes
24-2 SITA Fast – 05 minutes
The selection of test to detect Glaucoma field
defect :
Glaucoma suspect : 30-2 Full threshold test
30-2 SITA standard
Established glaucoma : 24-2 Full
Threshold
and follow-up 24-2 FAST PAC
24-2 SITA standard
Advanced glaucoma : 10-2 Full
Threshold
10-2 SITA standard
Macular program test – full
threshold
Statistical package of Humphrey field
analyzer.
Normative data of each age group that is
stored
HVF PRINTOUTS
Screening test
printouts
Threshold test
printouts
Raw data without
STATPAC
ANLYSIS
Raw data with
STATPAC
ANALYSIS1. Macular program
2. Nasal step
printout
3. Any test with
stimulus size v
1. Central 30-2,
2. Central 24-2,
3. Central 10-2
4. Stimulus size iii
No STATPAC
ANALYSIS
ZONES
Independent of
STATPAC analysis
Dependent of
STATPAC analysis
Zone 1 – Patient data /
test data
Zone 2 – Reliability indices /
foveal threshold
Zone 3 – Raw data
Zone 4 – Grey scale
Zone 5 – TDNP
Zone 6 – TDPP
Zone 7 – PDNP
Zone 8 – PDPP
Zone 9 – Global indices
Zone 10 – GHT
• Fixation monitor – Blind spot
• Color of stimulus – White CONSTANT
• Background illumination – 31.5 asb
• Fixation target- Central
- Small diamond - in Macular degeneration
- Large diamond – in Central Scotoma
- Bottom LED of large diamond– Superior
36 or 64 screening specialty tests
Stimulus size – Goldmann’s size III (All routine tests)
- Goldmann’s size V ( Advanced Glaucoma)
Pupil Diameter – 3-4 mm (Constricted pupil- Diffuse Visual
Field
Depression or Edge Scotoma)
Zone-1 : PATIENT’S DATA AND TEST DATA
..
..... ..
• If the patient is not properly focused on the interior
of the bowl ,the Foveal sensitivity will be reduced
along with the reminder of the field.
• If the patient has good visual acuity and significant
reduction in the Foveal threshold then the technician
should become alert and check if the optical
correction is correct or not.
• RELIABILITY INDICES:
Fixation Losses should be < 20%
False Positive Response
False Negative Response
Zone-2: FOVEAL THRESHOLD & RELIABILITY INDICES
should be < 33%
• Exact retinal sensitivity in dB units of the selected
points.
• Only the numerical value of the retinal sensitivity
is displayed in the raw data and dB units are
omitted.
• In the raw data,
‘0’ indicates Absolute scotoma (No response to
the
maximum intensity of light intensity i.e 10000
asb units in Humphrey Field Analyzer)
‘40’ indicates Highest Retinal sensitivity i.e., to 1
asb unit.
Zone-3: RAW DATA
Zone-4: RAW DATA – GREY SCALE
• Retinal sensitivity values (0-50dB) – grouped in 10 groups
• Each step corresponds to 5dB change,
• except first and 10th groups which have 10dB step
Do not make any diagnosis based on grey scale
The conversion of raw data to grey scale does not
include any statistical calculation
In high false positives, areas of white zones will be
appreciated.
In high false negatives, the Grey Scale gives a
Clover leaf appearance – areas of dark zones
KEYNOTE:
The depth of the field defect is better appreciated
in
Grey Scale than the probability plots. A thick
black
shade indicates absolute Scotoma but a black
square in the probability plot need not be an
absolute scotoma.
Zone – 5: TOTAL DEVIATION NUMERICAL
PLOT
(TDNP)
• The measured retinal sensitivity of each point in raw
data is now compared with the normative data of
same age group and the difference between the
measured sensitivity and the normative data at each
point is calculated and the deviation from the
normative data is plotted as TDNP.
• So, TDNP is raw data expressed in terms of
deviation values from normal values.
• Attention should be given to the decibel values
with – ve sign in front of them. For all practical
purposes , the TDNP can be considered as loss of
retinal sensitivity plot.
KEYNOTE:
The depth of the field defect can be better
appreciated from TDNP because it gives the
exact change of sensitivity at each point from
the normal value of the same age group.
If there is no significant field loss, TDNP
contains deviation values in the range of 0 to
-2 decibels
On uniform generalized field defect – TDNP
shows – ve symmetrical values
Zone – 6: TOTAL DEVIATION PROBABILITY
PLOT
(TDPP)
• Why probability plots?
To know the extent and the pattern of the field
defect.
• What is probability?
It is the measure of the likeliness that an event
will occur.
• The probability statements are based on the
distribution seen in the normal population.
The STATPAC calculates the ‘P’ value for the
points where there is loss of sensitivity and not for
those points where the sensitivity is better than
• Each numerical value in the TDNP depending on
its P value is assigned the corresponding symbol
of P value and is plotted as TDPP.
• TDPP never tells that the loss of retinal
sensitivity is abnormal or diseased. It only tells
that the loss of retinal sensitivity at that point is
seen in that much % of normal population of the
patient’s age group.
• Then how do we interpret the TDPP?
If we see a symbol for probability value which is
present in a very less % of population and
clinically we are suspecting abnormality at that
location, we presume that the point is Abnormal or
• KEYNOTE:
The main aim of creating the Probability plot
is to give the pattern and extent of field defect
in the form of a symbolic representation of P
value of loss of retinal sensitivity at each
point and NOT to estimate the DEPTH of
the field defect.
But once the field defect becomes
generalized, the pattern of the field defect is
not known in the TDPP.
Zone – 7 : PATTERN DEVIATION NUMERICAL
PLOT (PDNP)
• Why PDNP?
The basic concept behind the conversion of total
deviation plot to pattern deviation plot is to highlight
the pattern of the localized deep scotomas by
removing the generalized depression from the total
deviation plot.
• The key point for the conversion of the TDNP to PDNP
is the selection of the 7 th best sensitivity point of
the TDNP.
• The decibel value that converts the 7 th best
sensitivity point of the TDNP to ‘0’ deviation is added
to all points of TDNP to convert it to PDNP.
• In 30-2 only points
from 24-2 pattern are
selected
• Excluding 3 points
around blind spot
• Total points – 51
• In 10-2 pattern – all
points are considered
• Total points - 68
Selection of 7th best
sensitivity point
• It is the symbolic representation of ‘P’ value of each
deviation value after eliminating the generalized
depression of the decibel value that converts the
7th best point of TDNP to ‘0’ deviation.
• The PDPP tells whether the generalized field defect
in the TDPP is of uniform generalized type or
irregular generalized type.
• Uniform generalized field defect is seen in
conditions like cataract, media opacities, small pupil
and if the fields are done without giving a proper
refractive correction.
Zone – 8:PATTERN DEVIATION
PROBABILITY PLOT (PDPP)
TDNP
TDPP
PDNP
PDPP
Zone – 9: GLOBAL INDICES
Visual field loss
1. Diffuse / Generalized loss
2. Localized loss
3. Combination of both
• Clinically useful to determine which of these is changing
more rapidly
• Gives information regarding the amount of diffuse vs
localized loss of and relative rate of change of each in a
simple number
• Global indices are developed to express the height and
contour of hill of vision1. MEAN DEVIATION INDEX – MDI
2. PATTERN STANDARD DEVIATION –
PSD
3. SHORT TERM FLUCTUATION – SF
MEAN DEVIATION INDEX – MDI
To express the change in GENERALISED HEIGHT
of hill of vision
• Early defects – MD < - 6 decibels
• Moderate defects – MD < - 6 to -12 decibels
• Severe defects – MD < - 12 decibels
Role of MD index in the diagnosis of early
Glaucoma:
If we suspect Glaucoma on the basis of
asymmetry of IOP or disc cupping, the difference
of MD index between both eyes should be taken as
a very important clue in confirming the diagnosis.
PATTERN STANDARD DEVIATION –
PSD
• To express the loss of smooth contour of hill of
vision – LOCALIZED FIELD DEFECT
• index to pickup localized scotoma or scotomas
which is an early sign to diagnose Glaucoma.
• PSD is an index of irregular loss of retinal
sensitivity which is better appreciated by
1. Different deviation values in TDNP
2. Abnormal PDNP
FIELD
DEFECT
LOCALIZED FIELD
DEFECT
GENERALIZED FIELD
DEFECT
Height is
normal
contour
is
irregularLOW MDI HIGH PSD
UNIFORM
GENERALIZED FIELD
DEFECT
IRREGULAR
GENERALIZED FIELD
DEFECT
Height is
decrease
d
Height is
decrease
d
contour
is
smooth0 PSD
contour
is
irregularHIGH PSDHIGH MDI HIGH MDI
FIELD
DEFECT
LOCALIZED FIELD
DEFECT
GENERALIZED FIELD
DEFECT
LOW MDI HIGH PSD
UNIFORM
GENERALIZED FIELD
DEFECT
IRREGULAR
GENERALIZED FIELD
DEFECT
0 PSD HIGH PSDHIGH MDI HIGH MDI
SHORT TERM FLUCTUATION – SF
• It is an index of intra test variation.
• In this the sensitivity will be calculated twice at
ten pre-selected points.
• The result of the first series of the threshold
values at these points are compared with the
second series of threshold values at these
points and the difference between them is
calculated and expressed as Root Mean Square
of the Standard Deviations estimated at these
locations that underwent duplicate testing of
normal population
• Only full threshold and FASTPAC calculate
SF
• SITA strategies do not calculate SF
• SF value < 3dB usually 1-2.5 dB
HIGH
SF
Tested 10 points
shows field defect
Tested 10 points are
normal
Indicates
pathology
Indicates low
reliability
SF is used to correct CPSD
( CPSD = PSD – SF )
• It can be called as a refined PSD.
• It evaluates five zones in the upper field and
compares these zones to their mirror image
zones in the lower field.
• The zones are constructed in the
approximate patterns of retinal nerve fibers
and therefore GHT is directed primarily at
the diagnosis of Glaucomatous visual
field loss and not other diseases.
Zone-10: GLAUCOMA HEMIFIELD TEST
(GHT)
1
2
4 5
3
1) OUTSIDE NORMAL LIMITS:
One of the two conditions
• out of 5 sectors, at least one sector pairs
difference must exceed that found in 99% of
the normal population
• the individual scores of any pair of sectors
exceeds that found in 99.5% of the normal
population
2) BORDERLINE:
out of 5 sectors, at least one sector pairs
difference must exceed that found in 97% of
the normal population
GHT
3) GENERAL REDUCTION OF SENSITIVITY
Doesn't meet criteria of outside normal limits, but
the calculated general height shows the best part
of the field to be depressed to a degree that
occure in fewer than 0.5% of normal population
4) ABNORMALLY HIGH SENSITIVITY
Overall sensitivity at the best part of the visual
field to be higher than that found in 99.5% of
normal population
5) WITH IN NORMAL LIMITS
if none of the preceding four conditions is met
• 3 contiguous non-edge points on the Pattern
Deviation Plot within the Bjerrum’s area
two points P < 5%
one point P < 1%
• Pattern Standard Deviation has a probability of < 5%
• The Glaucoma Hemifield test is Outside Normal
Limits
ANDERSON’S CRITERIA FOR
DIAGNOSIS OF EARLY
GLAUCOMATOUS FIELD DEFECTS
Fall of retinal
threshold from
40dB
retinal
threshold
Stimulus
intensity
-0dB
-1dB
-2dB
-3dB
-4dB
-5dB
-10dB
-20dB
-30dB
-40dB
40dB
39dB
38dB
37dB
36dB
35dB
30dB
20dB
10dB
0dB
1 asb
1.3 asb
1.6 asb
2 asb
2.5 asb
3.2 asb
10 asb
100 asb
1000 asb
10000 asb
3dB decrease in measured
threshold value always
means that the eye has lost
approximately HALF of the
retinal sensitivity

perimetry

  • 2.
    Visual field Hill ofvision Perimetry  kinetic perimetry  static perimetry variable used : units, threshold HVF type of tests point patterns strategies of tests time duration of tests  HVF printouts zones of printouts  Andersons criteria TITLE PAGE
  • 3.
    VISUAL FIELD Part ofthe environment that is visible to the steadily fixed eye X-axis Y-axis Z-axis
  • 4.
    Functional boundaries ofnormal visual field: Approximate a SPIRAL Superior- 50° temporal- 90° Inferior- 60° nasal- 60°
  • 5.
    X-axis Y-axis Z-axis Traquair described itas 40 - 30 - 20 - 10 - dB ISLAND OF VISION IN SEA OF DARKNESS
  • 6.
    • It hasa shape of a hill • Peak representing fovea • 2 slopes representing nasal and temporal field of Vision • Sea represents the areas of no light perception • Under photopic condition, the shape of hill of vision is closely related to the packing density of the cones and receptive field size.
  • 8.
    Perimetry is themeasurement of visual functions of the eye at topographically defined loci in the visual field. • Is a subjective examination method for estimating the extent of visual fields. • A decisive diagnostic technique for recognizing disturbance of visual function / functional loss of vision PERIMETRY
  • 9.
    1970 - Octopusperimeter was first introduced. 1982 – Humphrey field analyzer first displayed at AAO. 1983 – Michael Patella showed first clinical trial 1984 – started production HISTORY
  • 10.
    PERIMETRY KINETIC PERIMETRY STATIC PERIMETRY •Hill of visionis kinetically explored along X-Y axis ( along sea level) •Stimulus moves with fixed intensity e.g., confrontation, lister, tangen screen, Goldmann •Hill of vision is Statically explored along Z- axis ( perpendicular to sea level) •Stimulus fixed with variable intensity e.g., Goldmann , octopus, humphrey field analyzer
  • 11.
    1.VFD detect earlier with20% defect 2. Area fixed but stimulus varies in intensity 3. Three dimensional 4. Threshold type 5. Less error 6. Both glaucoma and neurological 1.Detect when 40% damage 2. Intensity is fixed stimulus moves from but non-seeing to seeing area 3. Two dimensional 4. Non threshold type 5. More error 6. Good for neurological KINETIC PERIMETRY STATIC PERIMETRY
  • 13.
    KINETIC PERIMETRY  Manual Stimulus is moved from a non-seeing area to seeing area along a set meridian and other meridians which are usually 15° apart  Different variables – speed, size, color and brightness of stimulus  The resultant field of vision is by connecting many of threshold points by a line, charted in the form of ISOPTERS for each target variable.
  • 14.
  • 17.
  • 18.
    STATIC PERIMETRY  Computerized Stimulus size is maintained constant  Brightness varied at various predetermined constant locations in order to find out the threshold at these locations  In other words contrast sensitivity is tested throughout the extent of area perceived  Final outcome is the threshold value determined at predetermined locations ( numerical value)
  • 19.
    •Calculates the height ofthe visual field at a predetermined loci. •Gives the information of RETINAL SENSITIVITY at that loci
  • 20.
    Units used toexpress light intensity and Retinal Sensitivity: APOSTILBS (asb) UNITS: ABSOLUTE units of light intensity i.e., 100 asb units of light intensity is same in any instrument DECIBEL (dB) UNITS:RELATIVE units of light intensity i.e., decibel value in an instrument depends on the maximum intensity of light that can be produced by that instrument  Light intensity expressed in – asb (or) dB units Retinal sensitivity expressed in – db units
  • 21.
    Relation between asbunits and dB unit:1dB = 1/10 log unit of attenuation of maximum available stimulus in an instrument dB-asb scale of Humphrey field analyzer In humphrey system: Maximum intensity of light is 10,000 asb = 0 dB Minimum intensity of light is 1 asb = 40 dB
  • 22.
    THRESHOLD OF LIGHT STIMULUS: Definition: Minimumbrightness which the pt can see at a given location. Threshold for a given point is defined as that intensity of stimulus which has a 50 percent probability of being seen. SUPRATHRESHOLD OF LIGHT STIMULUS: intensity of stimulus which has a 90 percent probability of being seen. INFRATHRESHOLD OF LIGHT STIMULUS: intensity of stimulus which has a 15 percent probability of being seen.
  • 23.
    SIZE OF STIMULUS: Standardsize : goldmann size III For macular disorders : goldmann size V BACKGROUND ILLUMINATION:Octopus 101 : 4 asb (1.27 cd/m2) Octopus 1-2-3 : 31.4 asb (10 cd/m2) Humphrey 700 : 31.5asb (10 cd/m2 ) STIMULUS INTENSITY: OCTOPUS 1-2-3 : HUMPHREY : MAX: 4,000 asb MAX: 10,000 asb MIN: 0.4 ASB MIN: 1 asb GOLDMANN STIMULUS SIZES STIMULUS DURATION: 200 milliseconds
  • 24.
    Classification of Humphreyvisual field tests THRESHOLD TESTS SCREENING TESTS Depending on testing strategy CENTRAL TESTS PERIPHERAL TESTS SPECIALITY TESTS • Central 30-2 • Central30-1 • Central 24-2 • Central24-1 • Central 10-2 • Central 10-1 • Macular program • Peripheral 60-4 • Nasal step • Temporal crescent • Neurological 20 • Neurological 30 Depending on point pattern
  • 25.
    POINT PATTERN Where wetest – which part of the retina tested ? factors should noted in a specific point pattern are: 1. Extension of visual field. 2. Number of test points. 3. Point density (the distance between two points in degrees). 4. The degree of bare area around the fixation point. 5. The relation of the points to the horizontal and vertical axes.
  • 26.
    30-2 CENTRAL FIELD Extension- 30° to fixation point Total points - 76 Point density - 6° Degree of bare area – 3° 3° 6°
  • 27.
    . . .. . . . . . .. ........ . . . 24-2 CENTRAL FIELD Extension - 24° to fixation point Total points - 54 Point density - 6° Degree of bare area – 3° 30-2 CENTRAL
  • 28.
    10-2 CENTRAL FIELD Extension- 10° to fixation point Total points - 68 Point density - 2° Degree of bare area – 1° 2° 1° Used in advanced cases of glaucoma
  • 29.
    MACULAR PROGRAMME Extension -3° to fixation point Total points - 16 Point density - 2° Degree of bare area – 1° 10-2 CENTRAL FIELD
  • 30.
    WHY WE SELECT30-2, 24-2, 10-2 OVER 30-1, 24-1,10-1 Total points – 76 Bare area around fixation – 3° Total points – 71 Bare area around fixation – 6°
  • 31.
    THRESHOLD TESTING STRATEGIES Howwe test ?= strategy = method of presenting a stimulus. Screening (or) suprathreshold testing strategy Threshold testing strategy OLD NEW  Full threshold strategy  FAST PAC  SITA standard  SITA fast SITA – Swedish Interactive Threshold Algorith
  • 32.
    STAIRCASE METHOD –BRACKETING METHOD To detect threshold Used in full threshold strategy.      1 2 3 4 5 P 4 dB 2 dB
  • 33.
    FAST PAC METHOD   1 2 3 3dB• Decreases test time by 40% • Stimulus is changed in 3dB steps • Crosses threshold only once  • Analyzes patients response and responds accordingly • Decreases overall no of stimuli presented, hence test duration • Paces the test according to patients speed • Doesn’t estimate Short term Fluctuations (SF) SITA – Swedish Interactive Threshold Algorithm SITA standard – SITA with Bracketing method SITA FAST – SITA with FAST PAC
  • 34.
    Test time foreach individual type of test 30-2 Full Threshold – 20 minutes 30-2 FASTPAC – 14 minutes 24-2 Full Threshold – 14 minutes 24-2 FASTPAC – 10 minutes 30-2 SITA Standard – 10 minutes 24-2 SITA Standard – 07 minutes 24-2 SITA Fast – 05 minutes
  • 35.
    The selection oftest to detect Glaucoma field defect : Glaucoma suspect : 30-2 Full threshold test 30-2 SITA standard Established glaucoma : 24-2 Full Threshold and follow-up 24-2 FAST PAC 24-2 SITA standard Advanced glaucoma : 10-2 Full Threshold 10-2 SITA standard Macular program test – full threshold
  • 38.
    Statistical package ofHumphrey field analyzer. Normative data of each age group that is stored
  • 39.
    HVF PRINTOUTS Screening test printouts Thresholdtest printouts Raw data without STATPAC ANLYSIS Raw data with STATPAC ANALYSIS1. Macular program 2. Nasal step printout 3. Any test with stimulus size v 1. Central 30-2, 2. Central 24-2, 3. Central 10-2 4. Stimulus size iii No STATPAC ANALYSIS
  • 41.
    ZONES Independent of STATPAC analysis Dependentof STATPAC analysis Zone 1 – Patient data / test data Zone 2 – Reliability indices / foveal threshold Zone 3 – Raw data Zone 4 – Grey scale Zone 5 – TDNP Zone 6 – TDPP Zone 7 – PDNP Zone 8 – PDPP Zone 9 – Global indices Zone 10 – GHT
  • 42.
    • Fixation monitor– Blind spot • Color of stimulus – White CONSTANT • Background illumination – 31.5 asb • Fixation target- Central - Small diamond - in Macular degeneration - Large diamond – in Central Scotoma - Bottom LED of large diamond– Superior 36 or 64 screening specialty tests Stimulus size – Goldmann’s size III (All routine tests) - Goldmann’s size V ( Advanced Glaucoma) Pupil Diameter – 3-4 mm (Constricted pupil- Diffuse Visual Field Depression or Edge Scotoma) Zone-1 : PATIENT’S DATA AND TEST DATA .. ..... ..
  • 43.
    • If thepatient is not properly focused on the interior of the bowl ,the Foveal sensitivity will be reduced along with the reminder of the field. • If the patient has good visual acuity and significant reduction in the Foveal threshold then the technician should become alert and check if the optical correction is correct or not. • RELIABILITY INDICES: Fixation Losses should be < 20% False Positive Response False Negative Response Zone-2: FOVEAL THRESHOLD & RELIABILITY INDICES should be < 33%
  • 44.
    • Exact retinalsensitivity in dB units of the selected points. • Only the numerical value of the retinal sensitivity is displayed in the raw data and dB units are omitted. • In the raw data, ‘0’ indicates Absolute scotoma (No response to the maximum intensity of light intensity i.e 10000 asb units in Humphrey Field Analyzer) ‘40’ indicates Highest Retinal sensitivity i.e., to 1 asb unit. Zone-3: RAW DATA
  • 45.
    Zone-4: RAW DATA– GREY SCALE • Retinal sensitivity values (0-50dB) – grouped in 10 groups • Each step corresponds to 5dB change, • except first and 10th groups which have 10dB step
  • 46.
    Do not makeany diagnosis based on grey scale The conversion of raw data to grey scale does not include any statistical calculation In high false positives, areas of white zones will be appreciated. In high false negatives, the Grey Scale gives a Clover leaf appearance – areas of dark zones KEYNOTE: The depth of the field defect is better appreciated in Grey Scale than the probability plots. A thick black shade indicates absolute Scotoma but a black square in the probability plot need not be an absolute scotoma.
  • 47.
    Zone – 5:TOTAL DEVIATION NUMERICAL PLOT (TDNP) • The measured retinal sensitivity of each point in raw data is now compared with the normative data of same age group and the difference between the measured sensitivity and the normative data at each point is calculated and the deviation from the normative data is plotted as TDNP. • So, TDNP is raw data expressed in terms of deviation values from normal values. • Attention should be given to the decibel values with – ve sign in front of them. For all practical purposes , the TDNP can be considered as loss of retinal sensitivity plot.
  • 48.
    KEYNOTE: The depth ofthe field defect can be better appreciated from TDNP because it gives the exact change of sensitivity at each point from the normal value of the same age group. If there is no significant field loss, TDNP contains deviation values in the range of 0 to -2 decibels On uniform generalized field defect – TDNP shows – ve symmetrical values
  • 50.
    Zone – 6:TOTAL DEVIATION PROBABILITY PLOT (TDPP) • Why probability plots? To know the extent and the pattern of the field defect. • What is probability? It is the measure of the likeliness that an event will occur. • The probability statements are based on the distribution seen in the normal population. The STATPAC calculates the ‘P’ value for the points where there is loss of sensitivity and not for those points where the sensitivity is better than
  • 51.
    • Each numericalvalue in the TDNP depending on its P value is assigned the corresponding symbol of P value and is plotted as TDPP. • TDPP never tells that the loss of retinal sensitivity is abnormal or diseased. It only tells that the loss of retinal sensitivity at that point is seen in that much % of normal population of the patient’s age group. • Then how do we interpret the TDPP? If we see a symbol for probability value which is present in a very less % of population and clinically we are suspecting abnormality at that location, we presume that the point is Abnormal or
  • 53.
    • KEYNOTE: The mainaim of creating the Probability plot is to give the pattern and extent of field defect in the form of a symbolic representation of P value of loss of retinal sensitivity at each point and NOT to estimate the DEPTH of the field defect. But once the field defect becomes generalized, the pattern of the field defect is not known in the TDPP.
  • 54.
    Zone – 7: PATTERN DEVIATION NUMERICAL PLOT (PDNP) • Why PDNP? The basic concept behind the conversion of total deviation plot to pattern deviation plot is to highlight the pattern of the localized deep scotomas by removing the generalized depression from the total deviation plot. • The key point for the conversion of the TDNP to PDNP is the selection of the 7 th best sensitivity point of the TDNP. • The decibel value that converts the 7 th best sensitivity point of the TDNP to ‘0’ deviation is added to all points of TDNP to convert it to PDNP.
  • 55.
    • In 30-2only points from 24-2 pattern are selected • Excluding 3 points around blind spot • Total points – 51 • In 10-2 pattern – all points are considered • Total points - 68 Selection of 7th best sensitivity point
  • 56.
    • It isthe symbolic representation of ‘P’ value of each deviation value after eliminating the generalized depression of the decibel value that converts the 7th best point of TDNP to ‘0’ deviation. • The PDPP tells whether the generalized field defect in the TDPP is of uniform generalized type or irregular generalized type. • Uniform generalized field defect is seen in conditions like cataract, media opacities, small pupil and if the fields are done without giving a proper refractive correction. Zone – 8:PATTERN DEVIATION PROBABILITY PLOT (PDPP)
  • 57.
  • 58.
    Zone – 9:GLOBAL INDICES Visual field loss 1. Diffuse / Generalized loss 2. Localized loss 3. Combination of both • Clinically useful to determine which of these is changing more rapidly • Gives information regarding the amount of diffuse vs localized loss of and relative rate of change of each in a simple number • Global indices are developed to express the height and contour of hill of vision1. MEAN DEVIATION INDEX – MDI 2. PATTERN STANDARD DEVIATION – PSD 3. SHORT TERM FLUCTUATION – SF
  • 59.
    MEAN DEVIATION INDEX– MDI To express the change in GENERALISED HEIGHT of hill of vision • Early defects – MD < - 6 decibels • Moderate defects – MD < - 6 to -12 decibels • Severe defects – MD < - 12 decibels Role of MD index in the diagnosis of early Glaucoma: If we suspect Glaucoma on the basis of asymmetry of IOP or disc cupping, the difference of MD index between both eyes should be taken as a very important clue in confirming the diagnosis.
  • 60.
    PATTERN STANDARD DEVIATION– PSD • To express the loss of smooth contour of hill of vision – LOCALIZED FIELD DEFECT • index to pickup localized scotoma or scotomas which is an early sign to diagnose Glaucoma. • PSD is an index of irregular loss of retinal sensitivity which is better appreciated by 1. Different deviation values in TDNP 2. Abnormal PDNP
  • 61.
    FIELD DEFECT LOCALIZED FIELD DEFECT GENERALIZED FIELD DEFECT Heightis normal contour is irregularLOW MDI HIGH PSD UNIFORM GENERALIZED FIELD DEFECT IRREGULAR GENERALIZED FIELD DEFECT Height is decrease d Height is decrease d contour is smooth0 PSD contour is irregularHIGH PSDHIGH MDI HIGH MDI
  • 62.
    FIELD DEFECT LOCALIZED FIELD DEFECT GENERALIZED FIELD DEFECT LOWMDI HIGH PSD UNIFORM GENERALIZED FIELD DEFECT IRREGULAR GENERALIZED FIELD DEFECT 0 PSD HIGH PSDHIGH MDI HIGH MDI
  • 63.
    SHORT TERM FLUCTUATION– SF • It is an index of intra test variation. • In this the sensitivity will be calculated twice at ten pre-selected points. • The result of the first series of the threshold values at these points are compared with the second series of threshold values at these points and the difference between them is calculated and expressed as Root Mean Square of the Standard Deviations estimated at these locations that underwent duplicate testing of normal population
  • 64.
    • Only fullthreshold and FASTPAC calculate SF • SITA strategies do not calculate SF • SF value < 3dB usually 1-2.5 dB HIGH SF Tested 10 points shows field defect Tested 10 points are normal Indicates pathology Indicates low reliability SF is used to correct CPSD ( CPSD = PSD – SF )
  • 65.
    • It canbe called as a refined PSD. • It evaluates five zones in the upper field and compares these zones to their mirror image zones in the lower field. • The zones are constructed in the approximate patterns of retinal nerve fibers and therefore GHT is directed primarily at the diagnosis of Glaucomatous visual field loss and not other diseases. Zone-10: GLAUCOMA HEMIFIELD TEST (GHT)
  • 66.
  • 67.
    1) OUTSIDE NORMALLIMITS: One of the two conditions • out of 5 sectors, at least one sector pairs difference must exceed that found in 99% of the normal population • the individual scores of any pair of sectors exceeds that found in 99.5% of the normal population 2) BORDERLINE: out of 5 sectors, at least one sector pairs difference must exceed that found in 97% of the normal population GHT
  • 68.
    3) GENERAL REDUCTIONOF SENSITIVITY Doesn't meet criteria of outside normal limits, but the calculated general height shows the best part of the field to be depressed to a degree that occure in fewer than 0.5% of normal population 4) ABNORMALLY HIGH SENSITIVITY Overall sensitivity at the best part of the visual field to be higher than that found in 99.5% of normal population 5) WITH IN NORMAL LIMITS if none of the preceding four conditions is met
  • 69.
    • 3 contiguousnon-edge points on the Pattern Deviation Plot within the Bjerrum’s area two points P < 5% one point P < 1% • Pattern Standard Deviation has a probability of < 5% • The Glaucoma Hemifield test is Outside Normal Limits ANDERSON’S CRITERIA FOR DIAGNOSIS OF EARLY GLAUCOMATOUS FIELD DEFECTS
  • 72.
    Fall of retinal thresholdfrom 40dB retinal threshold Stimulus intensity -0dB -1dB -2dB -3dB -4dB -5dB -10dB -20dB -30dB -40dB 40dB 39dB 38dB 37dB 36dB 35dB 30dB 20dB 10dB 0dB 1 asb 1.3 asb 1.6 asb 2 asb 2.5 asb 3.2 asb 10 asb 100 asb 1000 asb 10000 asb 3dB decrease in measured threshold value always means that the eye has lost approximately HALF of the retinal sensitivity