Download to read offline


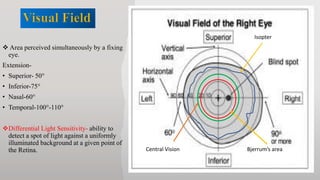
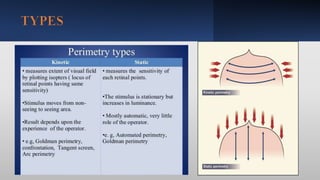
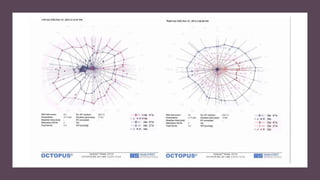
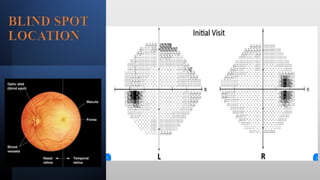
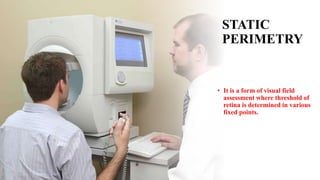
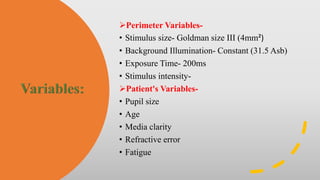
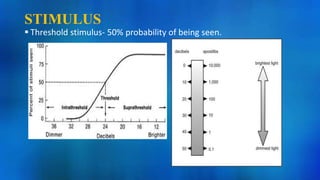
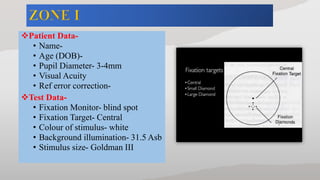
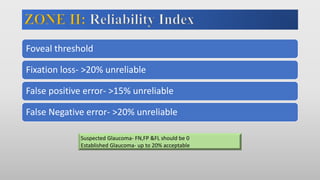
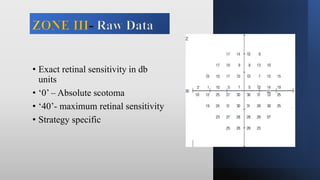
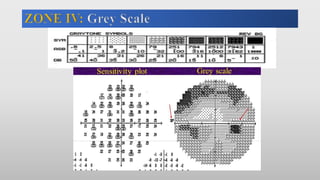
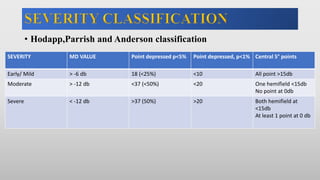
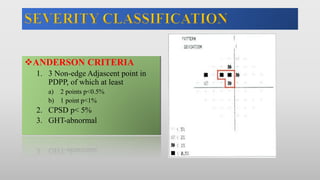
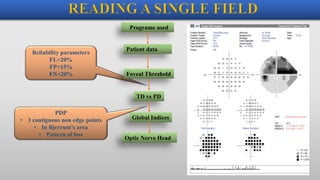
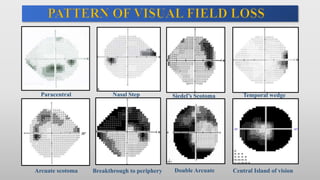


This document discusses static automated perimetry, which determines the threshold of the retina at fixed points to assess the visual field. It describes the retinal area that can be perceived, variables that affect perimetry tests, different test patterns used, classification of Humphrey field tests, strategies for presenting stimuli, analyzing results, and classifying visual field defects seen in glaucoma. Key points are that static perimetry determines the differential light sensitivity across the retina and compares results to age-normalized databases to detect losses.


