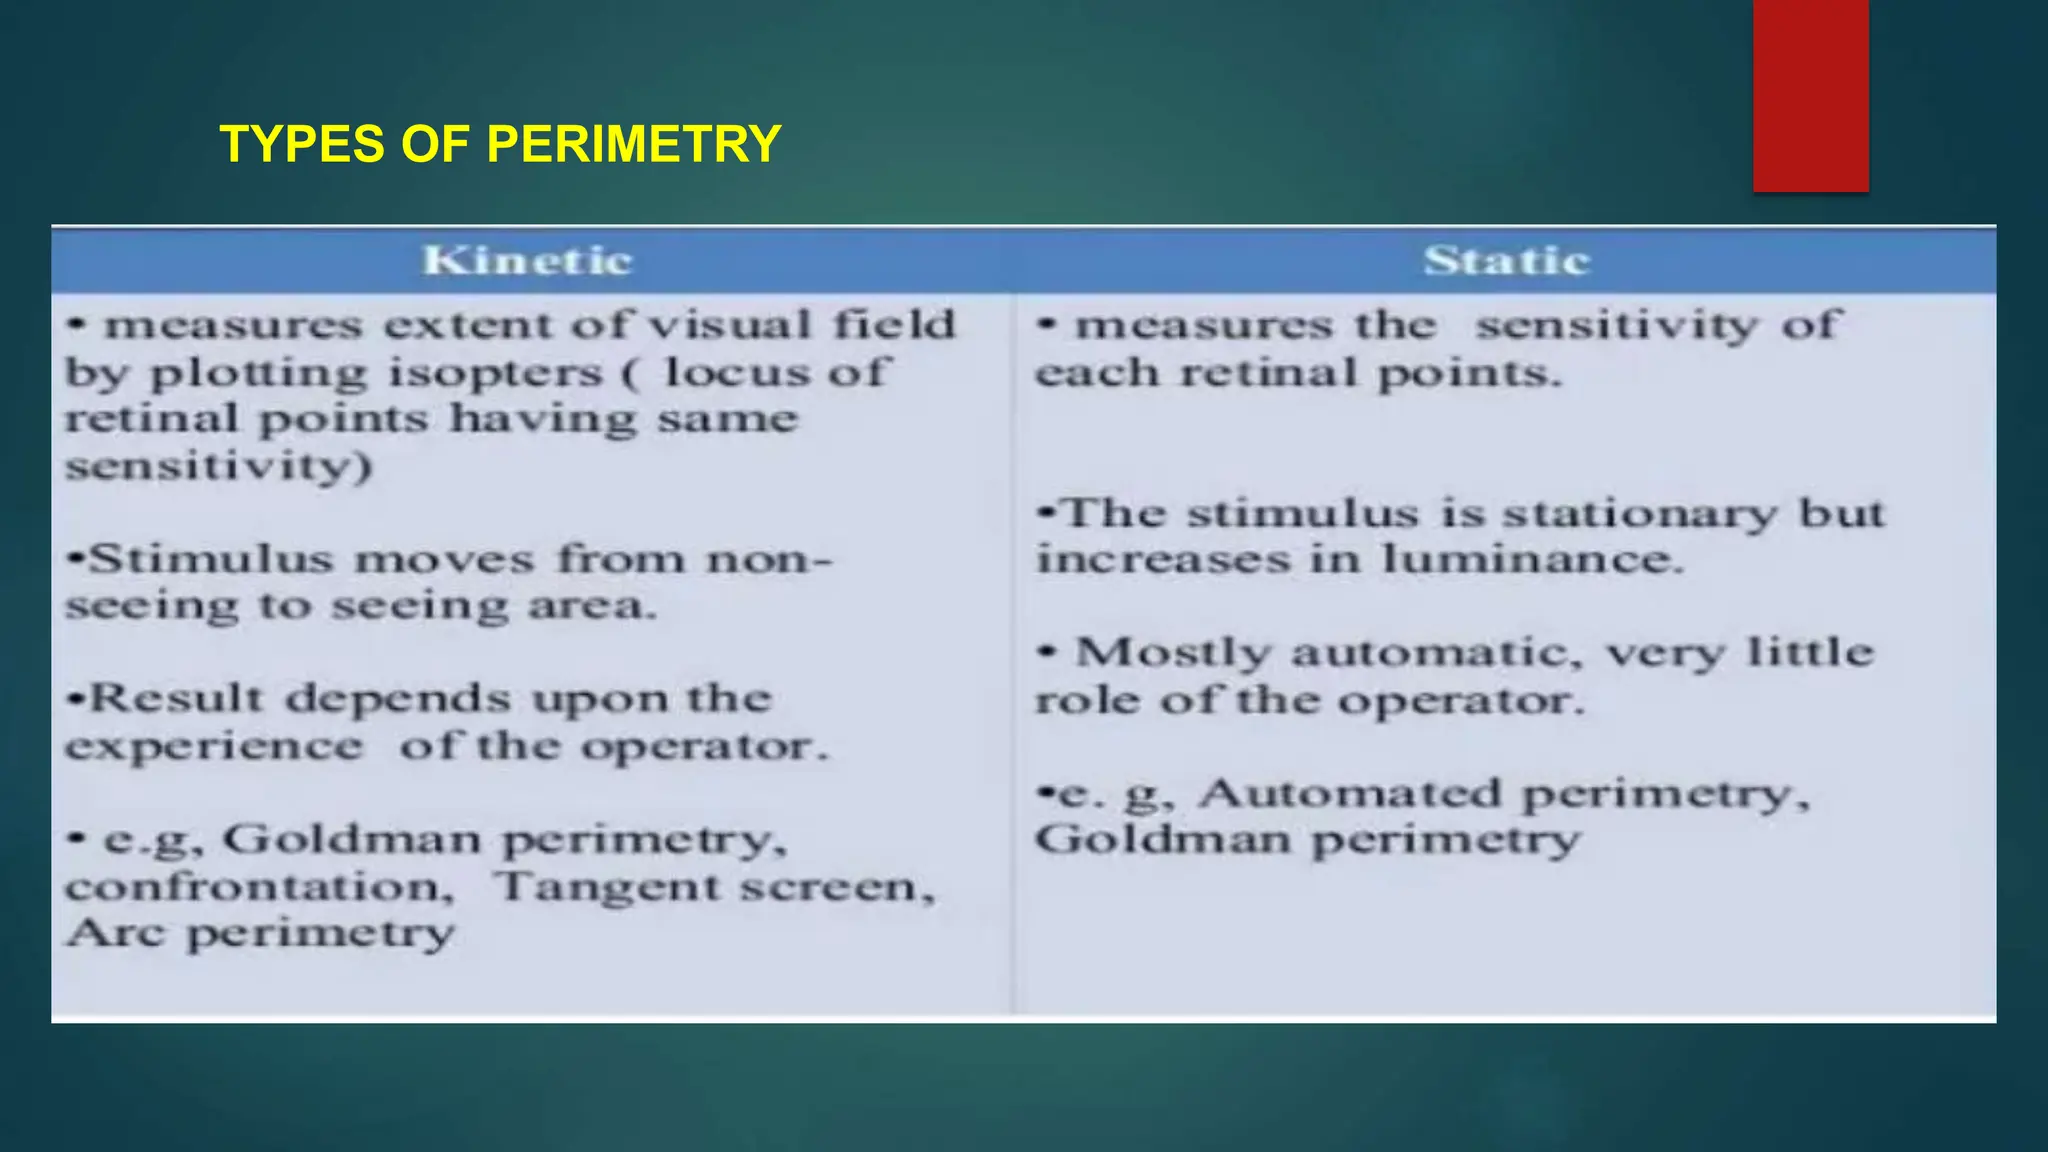
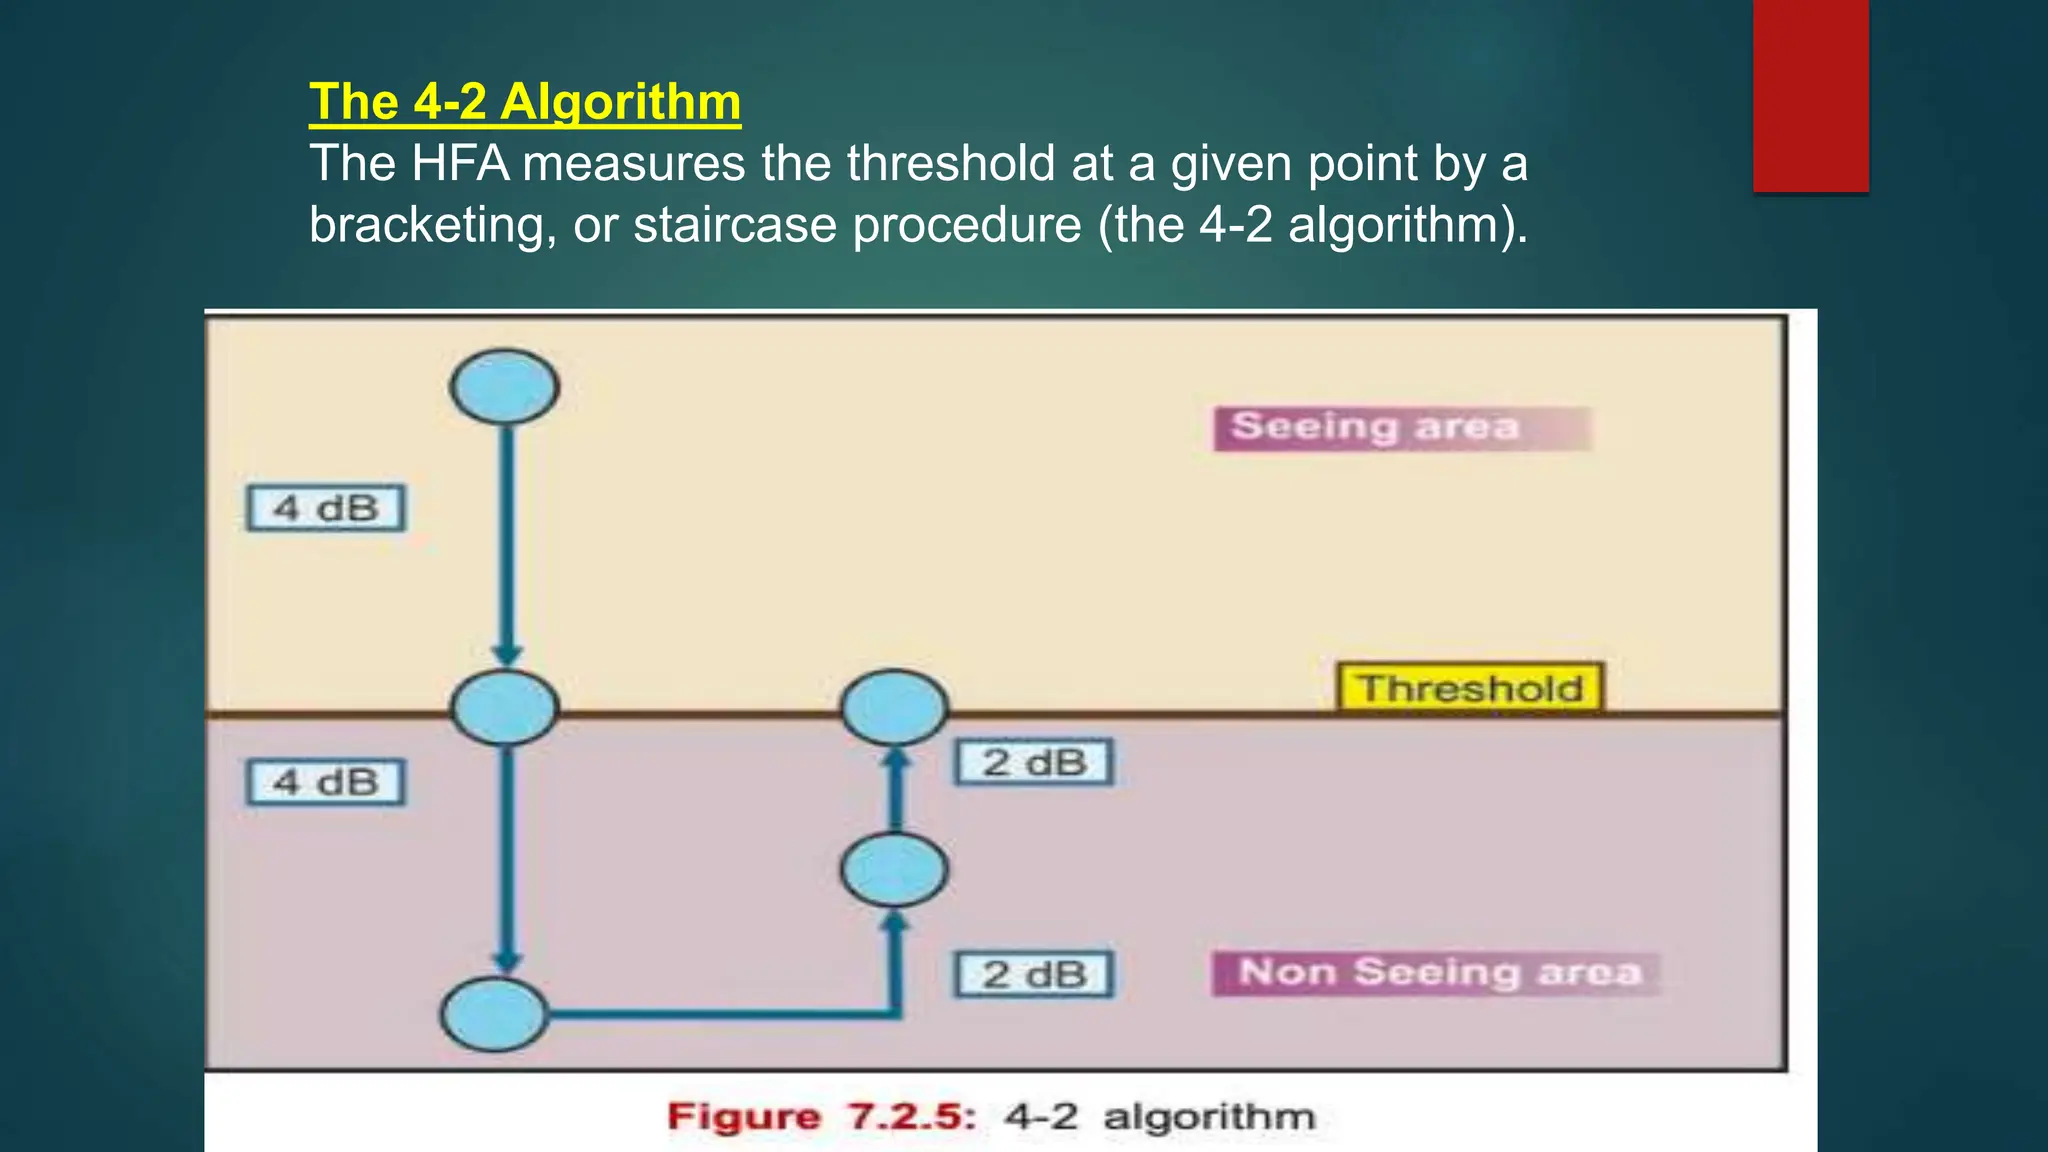
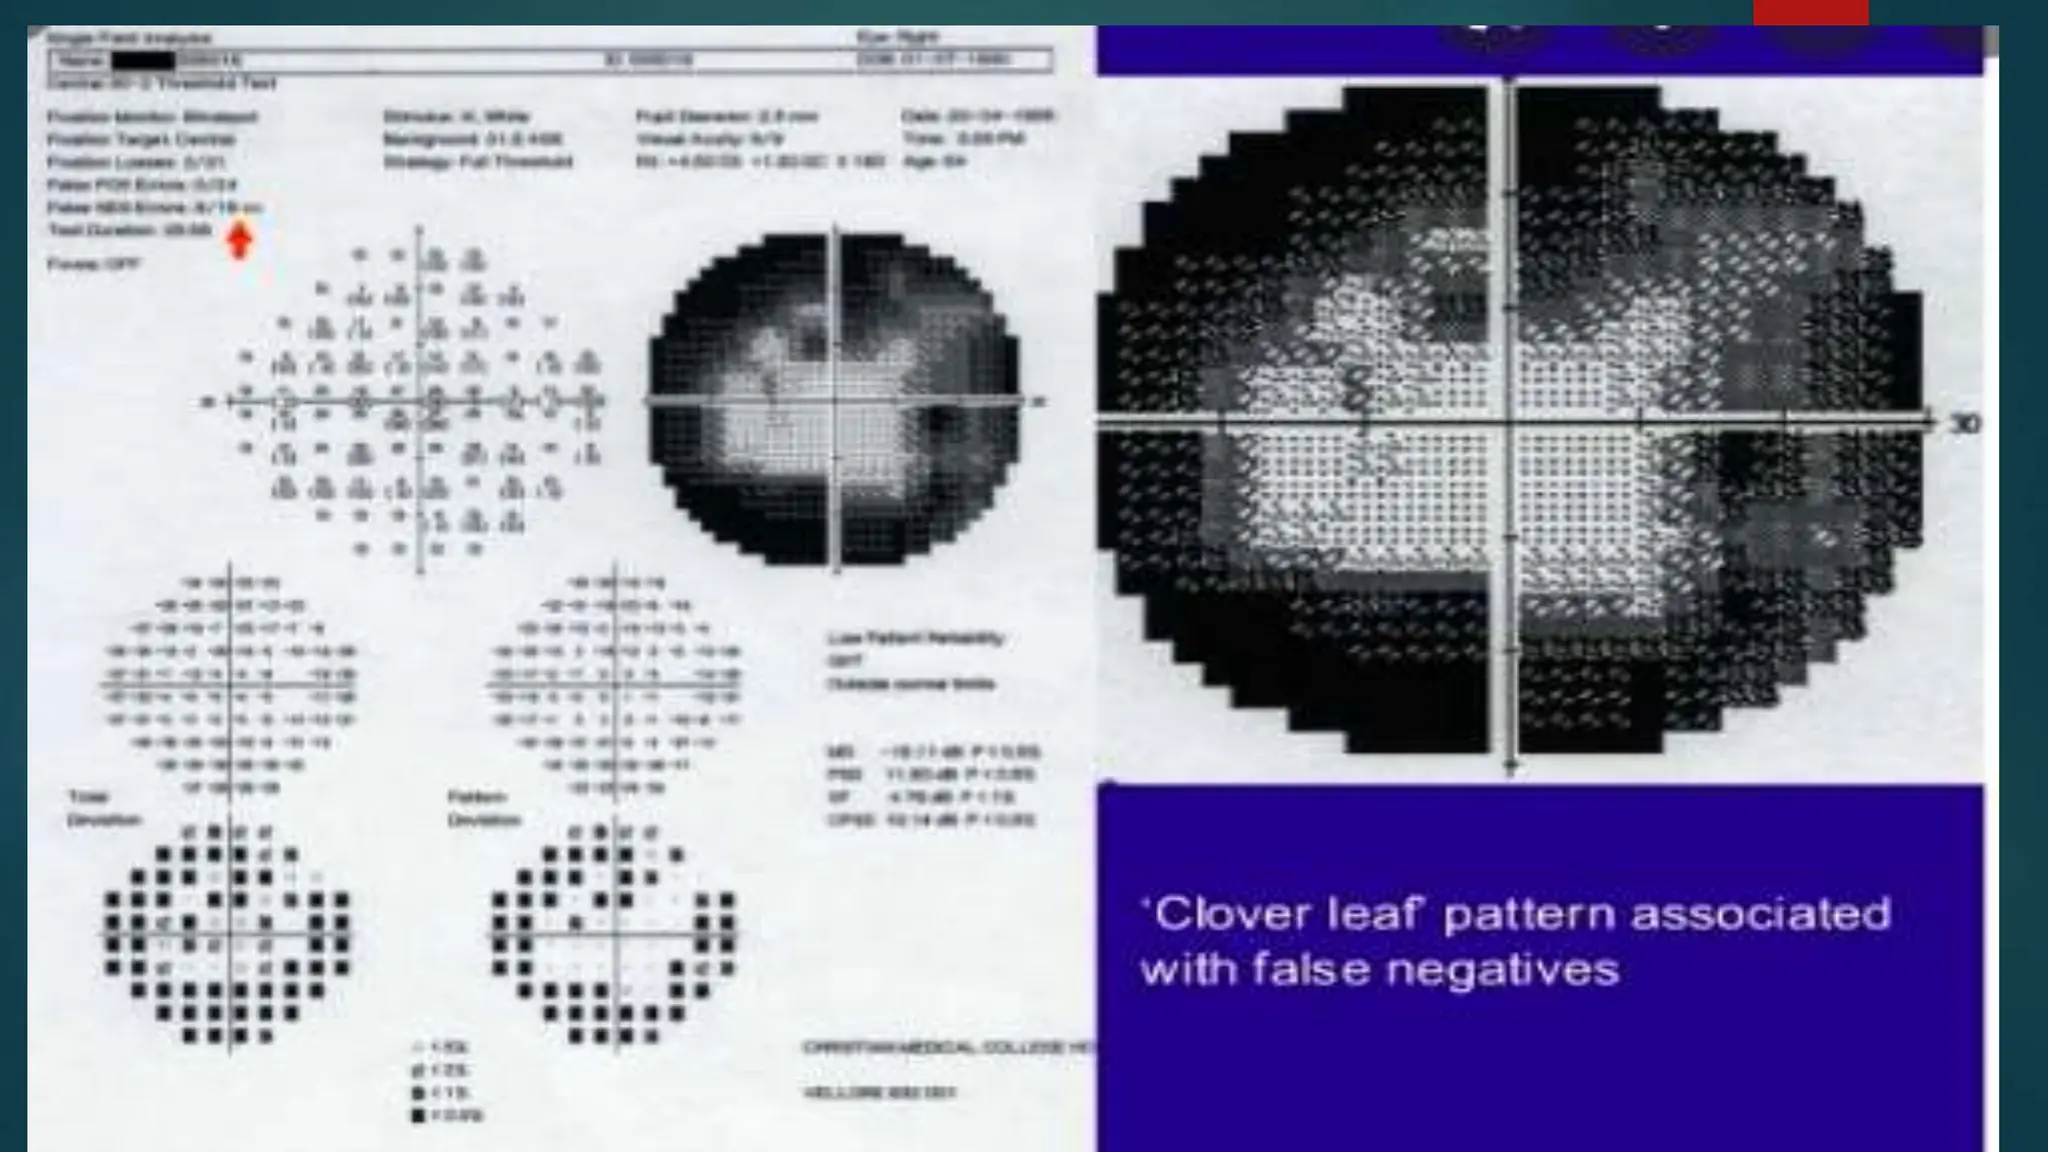
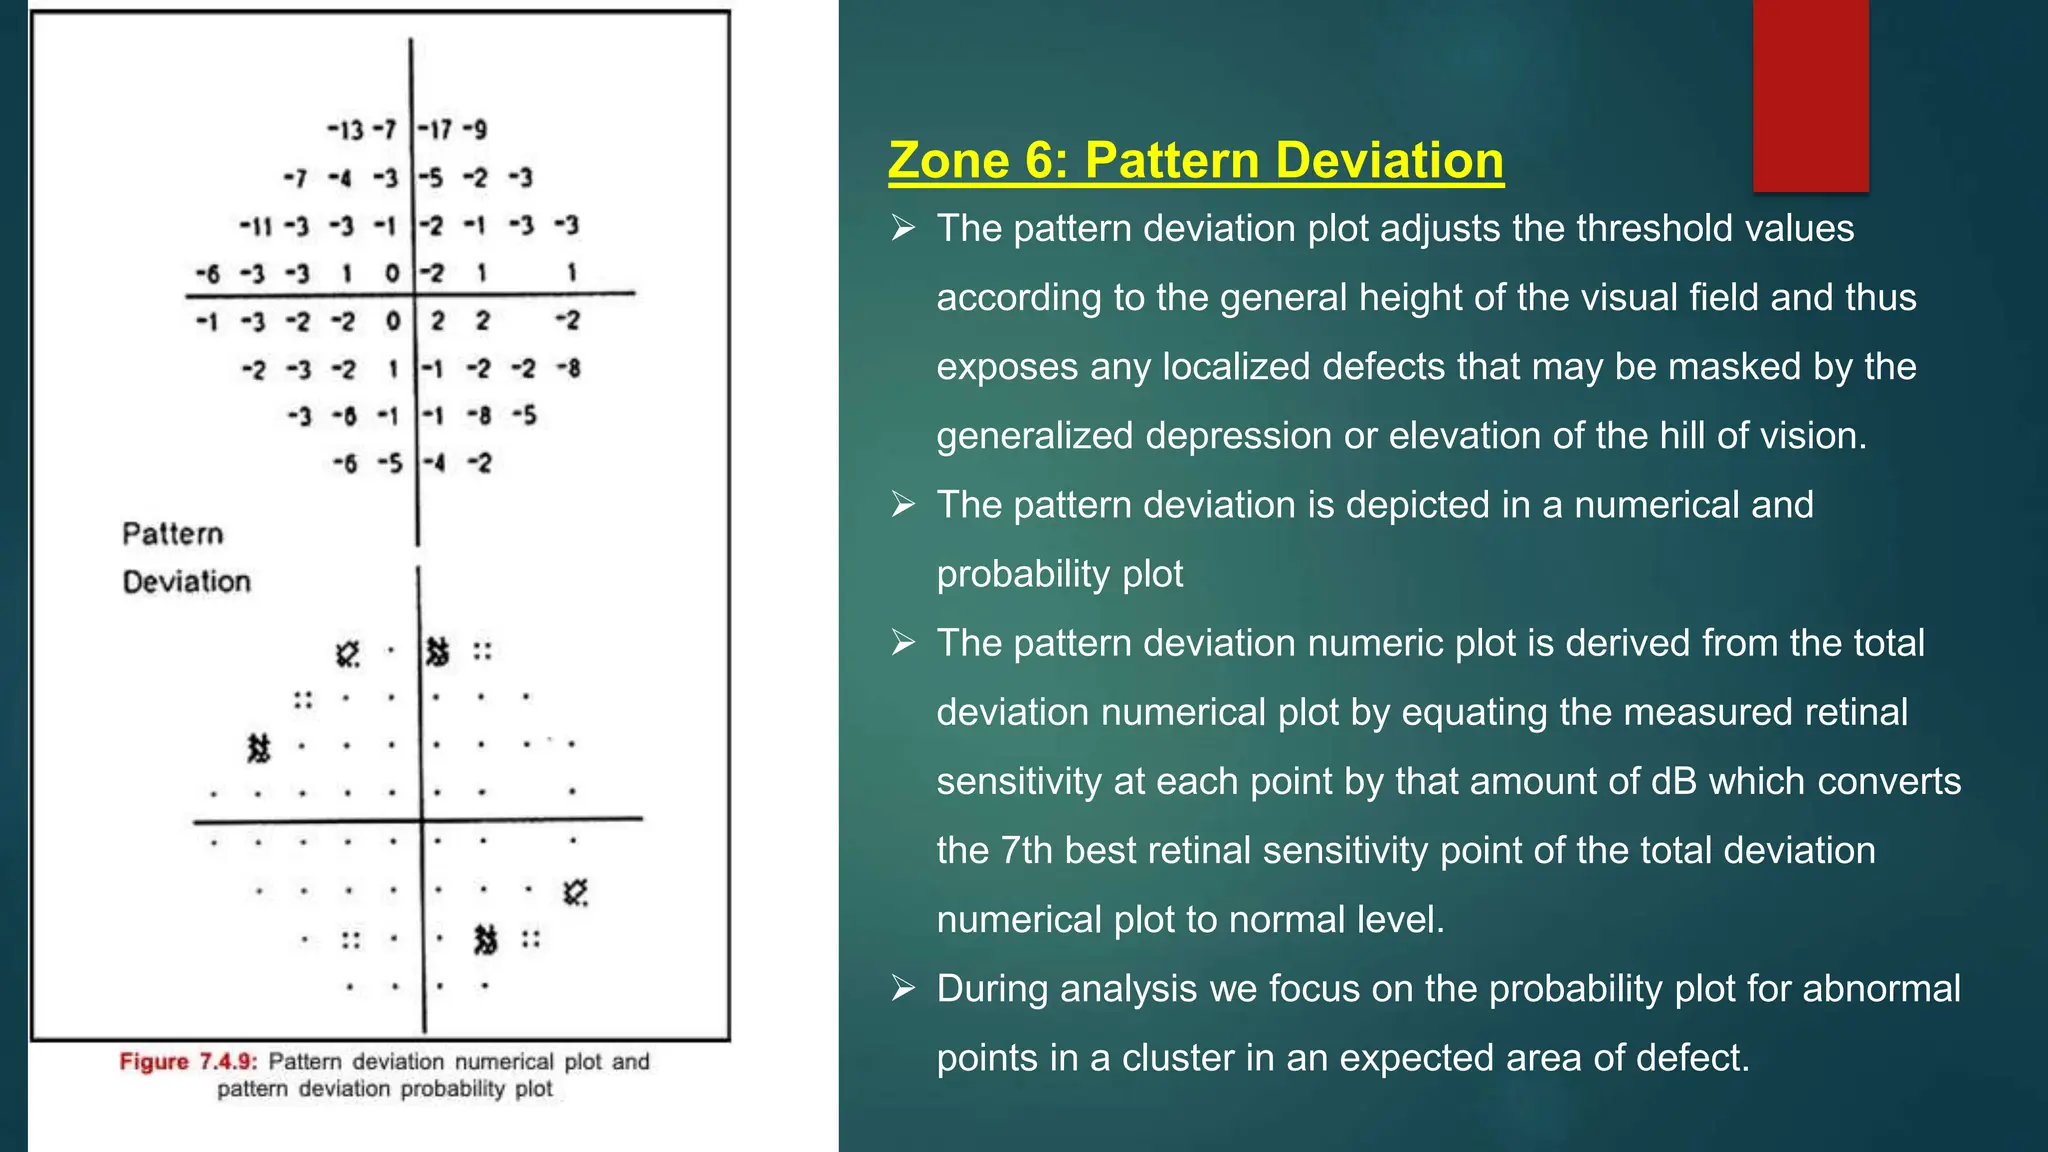
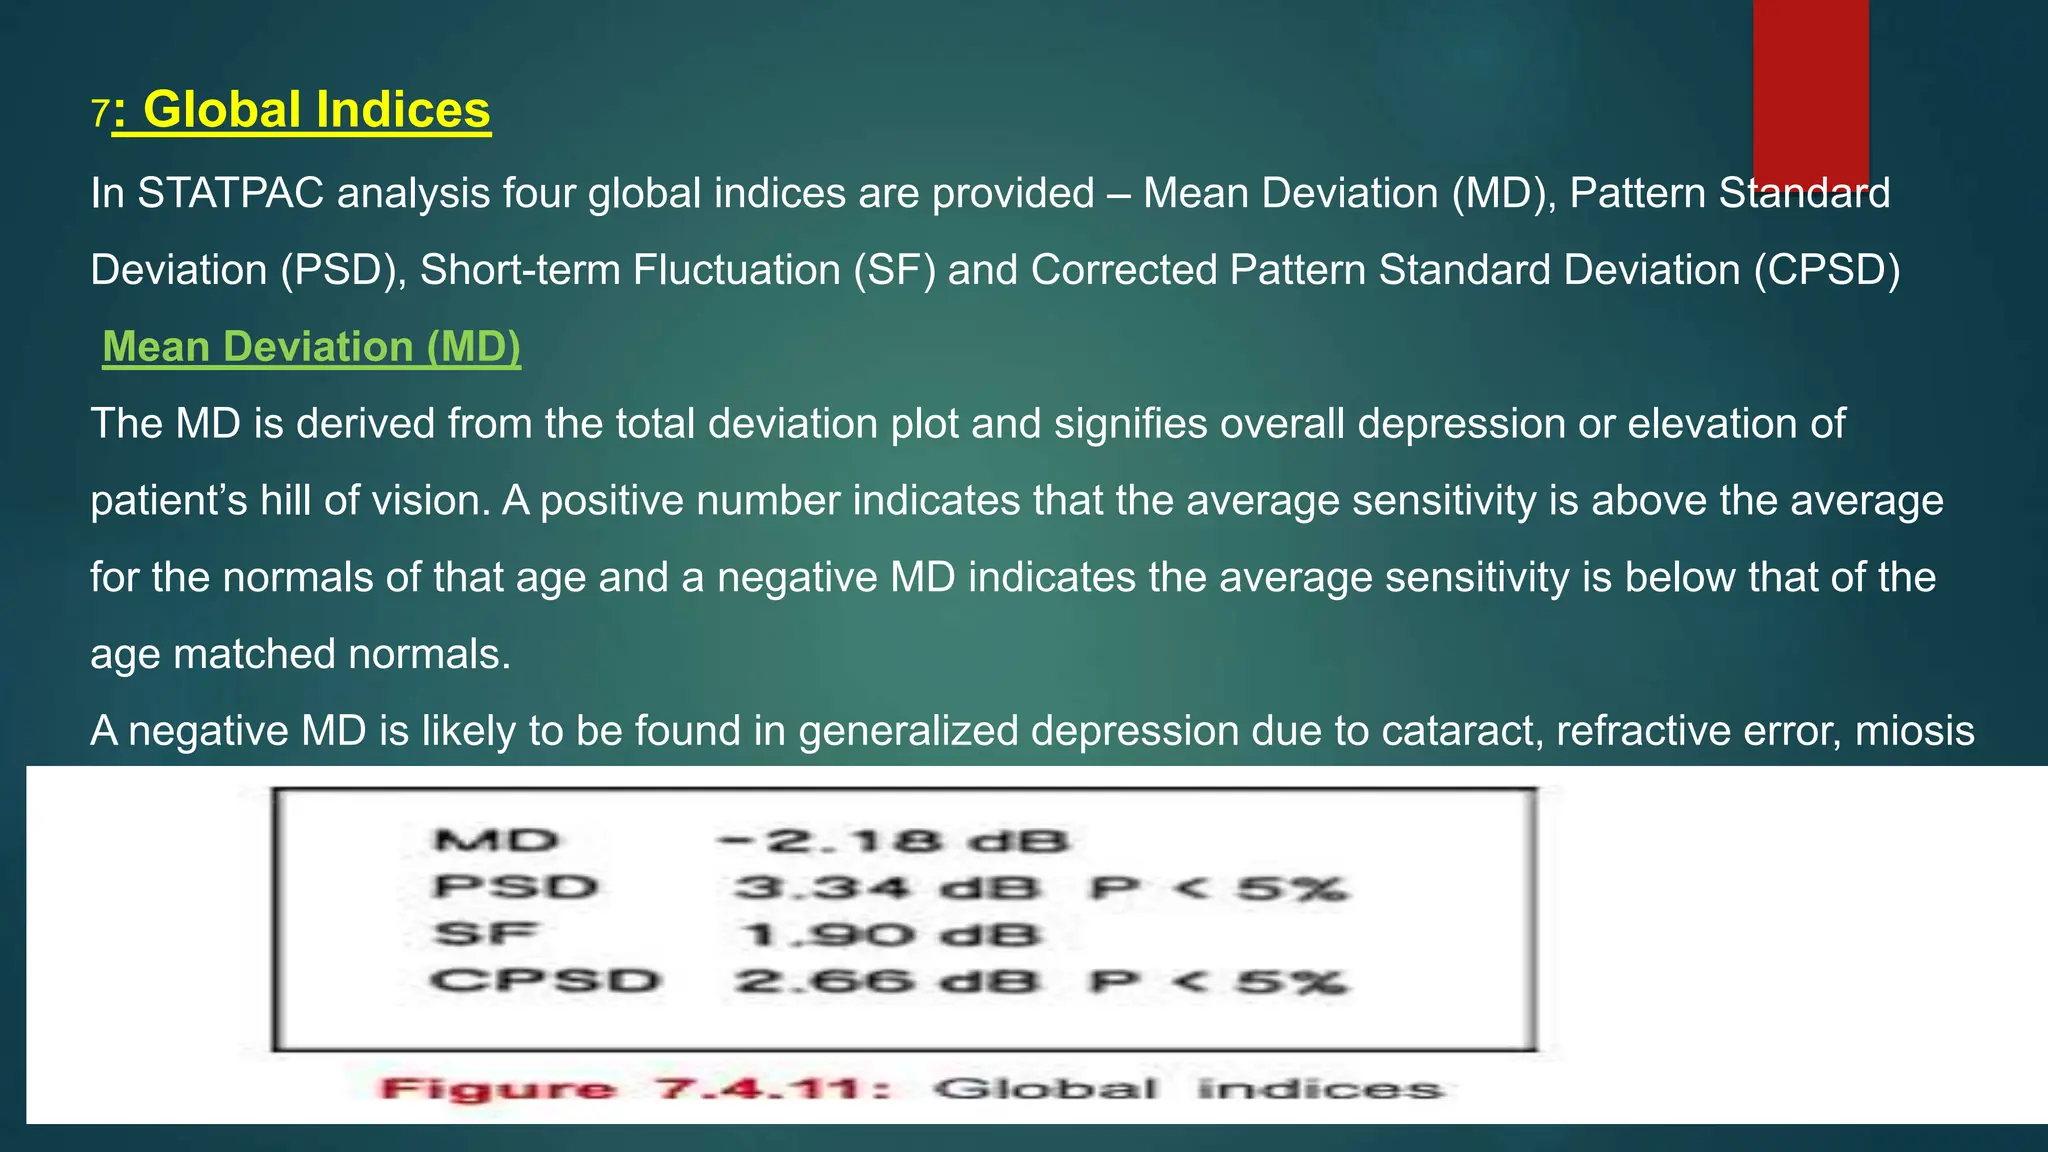
HUMPHREY
VISUAL FIELD
ANALYSIS
DR SHINE
VISUAL FIELD
 Field of vision – Def-: Part of enviornment wherein a steadily
fixating eye can detect visual stimulus.
 TRAQUAIR described the visual field as an “island of vision
surronded by a sea of blindness -- island represents the perceived
field of vision and the sea of darkness is the surronding areas that
are not seen.
TRAQUAIR’S NORMAL VISUAL FIELD
INDICATION OF VF TESTING
Find out the extend of VF
To diagnose and detect diseases as well as
extend of damage caused in VF by the disease
To locate possible lesions in neurological
disorder
To find out the progression of diseases
METHOD OF VISUAL FIELD TESTING
Confrontation
Amsler grid
Perimetry : examine and quantify VF by stimulus of various
size , intensity and colour
TYPES OF PERIMETRY
 STATIC PERIMETRY
 Performed by determining the retinal sensitivities or threshold
at a specific location by using the same size test target but
varying its brightness.
 commonly used: Octopus and Humphreys
 Static perimetry is more sensitive in detecting subtle field
changes.
TERMS
• The units of light intensity used in perimetry are apostilbs (asb).
• Decibel scale is a relative scale to used in automated perimeters to measure the
sensitivity at the tested points of the hill of vision. This attenuation of light is expressed in
10th of logarithmic units which are called decibels (dB). It is an inverted logarithmic scale.
THRESHOLD
Threshold refers to the physiological capacity of retina to detect a stimulus at a given
location under specific testing conditions.
Threshold represents the minimum intensity of stimulus which can be detected 50% of the
time that it is presented.
Supra threshold
Intensity of stimulus presented above the estimated threshold of a normal visual field
location.
BASICS OF HUMPHREY FIELD ANALYZER (HFA)
Humphrey field analyzer is a projection type automated perimeter
The Machine
• The HFA is based on static mode of stimulus presentation.
• The HFA machine has viewing distance of 33 cms
• Background luminance of 31.5 asb
• Stimulus size (Goldmann stimulus size I–V).
• The cupula —The HFA uses a cupula (bowl) with 33 cm radius for
examination. The field examination is performed with near correction for 33 cm.
• The headrest and chinrest —HFA has an adjustable chin rest and headrest.
Display and hardware—The newer models have LCD monitors with a touch
screen. The perimeter has a built in printer, a storage source and a telescope
aligned with the bowl’s center to observe patients fixation.
Background Illumination
 Background illumination is an important parameter as the retinal sensitivity depends on
the state of retinal adaptation.
 The Humphrey Field Analyzer uses 31.5 apostilbs for background illumination, which is a
constant parameter.
 The advantage of using Mesopic background conditions is that
 1.adaptation time is shorter
 2.the examination is less sensitive to aberrant light of the surroundings.
 Perimetry should be performed in dim lit room and not in a brightly lit room.
Stimulus Size and Intensity
 The Stimulus in HFA is generated by a projection system.
 This allows to control the stimulus size, intensity and its placement.
 HFA uses Goldmann stimulus sizes I to V
 Most commonly Goldmann size III stimulus (4 mm2, 0.431 degrees) is used.
 Goldmann size V is the only other commonly used stimulus size for identification
and quantification of remaining portions of the visual field in cases of advanced
field loss.
 In Short Wave Automated Perimetry (SWAP) Goldmann size V is the standard
stimulus used.
Stimulus Duration
HFA the stimulus duration is 0.2 seconds
ADVANTAGE
• The temporal summation is usually complete
• It is shorter than the latency for voluntary eye movements,
• Not giving enough time to the patient to look at the stimulus in the periphery.
Fixation Monitoring
• The accuracy of the field analysis depends on the stability of the patient’s gaze.
• The patient is usually made to fixate at a central spot of light.
• In HFA the patient’s fixation can be monitored by Heijl-Krakau blind spot technique or
gaze monitoring.
• Heijl-Krakau method of fixation monitoring:
• This method assumes that with stable fixation the blind spot remains constant, so during
a field examination the machine presents suprathreshold stimuli on a previously mapped
blind spot.
• If the fixation is stable the stimulus is not perceived but if the fixation has changed the
stimulus will be perceived.
• More that 20% fixation losses represents an unreliable field.
The limitations of this method are
1. longer test duration as this adds to the test time,
2.it cannot be used in some strategies like 10-2
3.possibility of missing the fixation loss if the blind spot falls on a scotoma.
Eye monitoring—The center of the pupil should coincide with the cross made on the video
monitor
Gaze monitors—In the newer series of HFA, gaze monitoring is done by projecting infrared
light on to the cornea and checking for the corneal reflex relative to the pupillary center .
The position of the pupil and the corneal reflex is dependent on the gaze and less
dependent on the horizontal and vertical head positions .
The advantage of using gaze monitors is that
1.It monitors fixation with every stimulus that is presented as compared to Heijl-Krakau blind
spot monitoring method, which tests only 5 percent of the total test time.
2.No extra time is required as this goes on simultaneously with stimulus presentation.

STATPAC
 STATPAC is the computerized statistical package included in all Humphrey perimeters.
 Allows comparison of patient’s test result with the age matched normal data
 Allows the comparison of patient’s own baseline test data with the follow up test to
determine any change in the retinal sensitivities.
 The STATPAC analysis is available in threshold testing only and can be printed in the
following formats: Single field analysis, Overview, Change analysis, Glaucoma change
probability analysis and Glaucoma progression analysis.
 STATPAC is not available for macular programs, nasal step test patterns and all
screening tests.
SETTING UP THE PATIENT
Patient Instructions
1.Each eye would be tested separately and takes about 10 minutes for a threshold test.
2.The importance of looking at the fixation target (yellow light in the center) through out the test.
3.The light stimuli would be projected in central and peripheral bowl.
4.The response button is given to the patient and he is told to press it in response to every visible
stimulus.
5.All projected stimuli will not be visible and the stimulus can vary in brightness from very bright to
very dim.
6.All visible stimuli however dim, should be reported.
7.In case of fatigue the patient can halt the test by pressing the trigger continuously or informing the
perimetrist.
8.The occluded eye is to be kept open under the occluder and blinking should not be inhibited.
Refractive Correction
 The patient’s refractive error must be corrected appropriately for the viewing distance
of the cupula of the perimeter.
 To determine the appropriate correcting lens the patient’s refractive error for distance
and the addition for near is taken
 Astigmatism of greater than 1 diopter should be incorporated in the correction.
 An inappropriate refractive correction during the test can produce a pseudo
generalized depression of the field or a localized scotoma due to retinal blur.
 Incorrect placement of the corrective lens can produce artefacts like rim defects.
THRESHOLD STRATEGIES
• The aim of doing perimetry is to diagnose a disease or monitor its progression.
most of the important diagnostic information is located in the central 30 degrees of the
visual field
• In glaucoma diagnosis and management the focus is on central 24 or 30 degrees.
The field is tested at locations 6 degrees apart, which is sensitive to pick up early-
localized defects in glaucoma
• The Humphrey field analyzer offers the following testing strategies:
1.Suprathreshold testing
2.Threshold testing
1.Full threshold
2. FASTPAC
3 SITA standard and SITAFAST
SUPRATHRESHOLD TESTING
 In suprathreshold testing the field is mapped with a stimulus that is about 4 to 6 dB
above the threshold level.
 Suprathreshold examination allows a very rapid evaluation of large number of points
in the field.
 It helps in the detection of the abnormality and determining its boundaries in a very
short time but it does not quantify the depth of the defect.
 The main importance of this strategy is for screening purposes especially when the
index of suspicion of a defect is low.
Three methods for setting the level of screening are available:
1. Single intensity screening—Single intensity stimulus between10 to 24 dB is selected and
presented to all points tested. This is not a very useful method and is used mainly for
screening field for driving or similar purposes.
2. Age related screening—A stimulus 8 dB more intense than the mean age corrected normal
sensitivity is presented at each test point. This is the most preferred method of screening used
as it is sensitive enough to detect the field defects and is also less time consuming.
3. Threshold related screening—it presents stimuli about 6 dB higher than the expected
threshold sensitivity at each location. This has equal sensitivity for scotomas in the center as
well as in the periphery.
THRESHOLD TESTING
In threshold testing strategy, light sensitivity (threshold) is determined at each testing
location in the field.
It gives us more accurate hill of vision and is capable of detecting early and shallow focal
loss.
There are various test point patterns available with threshold strategies.
Central 30-2
 Measures central 30 degree visual field
 Total 76 points tested with each point seperated by 6 degree Of visual
space
Central 24-2
 Covers central 24 degree (except nasally where it extend out to 30
degree)
 Total 54 points tested with 6 degree between points
 Bare area 3 degree
Central 10-2
 Central 10 degree
 68 points with 2 degree between points
 Used on patient with condition that affect central Vision – macular
degeneration, diabetic retinopathy or Only a small amount of central vision
remains as in end stage glaucoma
Macular programme
 Central 16 points tested
 Distance b/w 2 points is 2 degree
 Bare area 1 degree from fixation point
 Extension of testing area from fixation point is 5 degree
The 4-2 Algorithm
The HFA measures the threshold at a given point by a
bracketing, or staircase procedure (the 4-2 algorithm).
 In threshold strategy the threshold is determined first at 4 primary locations one in each
quadrant, symmetrically placed 9 degrees from both the horizontal and vertical
meridians. Stimulus is shown randomly at the 4 primary locations, and then the 4-2
algorithm determines the threshold at these points.
 The threshold is determined twice at these 4 primary points. Following this the threshold
of adjacent points radiating from these primary points is determined.
 The principal is that points adjacent to the normal points are expected to be normal and
the ones adjacent to abnormal ones are expected to be abnormal.
Threshold Strategies Available
1. Fullthreshold—In this strategy each point is subjected to the 4-2 algorithm for threshold
determination. The threshold of a point is taken as the starting point for the adjacent points
2. FASTPAC
 The standard full threshold strategy (4-2 algorithm) time consuming and may lead to patient fatigue
and uncooperativeness.
 FASTPAC utilizes 3 dB algorithm ,formulated to save time.
 The FASTPAC strategy changes the stimulus intensity in 3 dB steps, either increasing or decreasin
it depending on patient’s initial response, and crosses the threshold only once hence the threshold
determination is not as accurate.
 The best resolution attained is 3 dB rather than 2 dB in full threshold.
 The FASTPAC reduces the examination time by 35-40% but has not become popular due to high
intratest variability i.e. the Short-term Fluctuations (SF).
Swedish Interactive Threshold Algorithm (SITA)
The SITA has two testing strategies SITA standard and SITA Fast.
Both of them have only 4 tests available namely central 10-2, central 24-2, central 30-2 and peripheral
60-4.
All SITA tests use white size III stimulus only.
SITA standard takes about half the time of the standard full threshold testing and SITA FAST takes abou
half the time of FASTPAC.
The factors contributing to the time saving efficiency of SITA are:
1. SITA creates prior probability models for normal and glaucomatous populations. Intensity
of the initial stimulus presented is based on these models.
2.Reaction time—In SITA the interval between the stimuli presented is determined by
analyzing the patient’s response time to the stimulus.
3. Information index -The SITA strategy uses an “information index” derived from the visual
field model for each point that determines when to stop.
 SITA calculates the threshold considering all the responses and not only the end point at
each location.
 The SITA standard takes about 7 min (half of 4-2 algorithm) and the SITA Fast takes
about 4 min (half of FASTPAC).
ANALYSIS OF VISUALFIELD DATA
INTRODUCTION
To understand and interpret the single field printout it is divided in 8 zones
• Zone 1: Patient and test data
• Zone 2: Reliability indices and foveal threshold
• Zone 3: Raw data
• Zone 4: Gray scale
• Zone 5: Total deviation plot
• Zone 6: Pattern deviation plot
• Zone 7: Global indices
• Zone 8: Glaucoma hemi field test (GHT)
Zone 1: Patient and Test Data
In a single field print out of full threshold analysis the top area has the following Patient
data (Figure 7.4.2).
•Patient name and identity number: It is important to be sure that we are looking at the
field test of the right person.
•Age and date of birth: It is also important to check if the patient’s date of birth is fed
correctly as the data will be compared to the normals of his age.
•Eye tested: ensure that we are looking at the field of the eye of concern.
•Visual acuity and refractive correction used: The vision entered and the refractive error
used should be correct. In high refractive errors it might be appropriate to use contact lenses. A
wrongly corrected or uncorrected refractive error may lead to generalized depression or
localized field defects. It is also important to place the lenses in the trail frame correctly and
position the trial frame close to the eye to avoid rim defect and ensure maximal field of view.
•Pupillary size: The size of the pupil is important; it should be entered correctly and noted so
that for all follow up field tests as far as possible the pupillary size should remain the same.
•Decrease in the pupillary size results in decreased illumination of the retina, reduction
in the sensitivity of the retina and hence results in the apparent worsening of the visual
field conversely the increase in the pupillary size results in apparent improvement of
the visual fields.
The Test data has the following information
•Test pattern and Strategy performed: This varies according to our choice depending upon the clinical
condition of concern. It is important to confirm whether
•the test strategy performed is what we asked for.
•Fixation monitor (Blind spot): It is a constant parameter.
•Stimulus size: Goldmann size III is the most common target used but in cases of advanced field loss
Goldmann stimulus size V is used.
•Background illumination: It is constant at 31.5 asb.
•Color of the stimulus: White (this is also a constant parameter).
•Fixation target:
•Usually the patient is asked to fixate at the central fixation target i.e. central
yellow light
•In cases suspected central scotoma the patient is asked to fix at the small
diamond.
• Large diamond used in patients who are unable to see the central or small
diamond.
Zone 2: Reliability Indices
1. False Positive Response (FP)
 The FP represents the tendency of the patient to press the
trigger not in response to seeing a stimulus but at random,
either as a response to the audible cue or due to the
expectation of the stimulus(TRIGGER HAPPY PATIENT)
 FP rate more than 15% associated with compromissed test
result –better to repeat test
 In the printout 33 percent or more FP rate is flagged with a
double X (XX) and the machine gives “low test reliability”
message.
2. False Negative Response (FN)
 The False Negatives (FN) are failure of the patient to respond to stimuli, which are
suprathreshold to the sensitivity already measured at that point or adjacent point due to
patient inattention or fatigue.
 If the patient gets less inattentive as the test proceeds the primary points are not affected
but the adjacent points show depressed sensitivity producing a distinctive cloverleaf
pattern in the grayscale printout
 The FN rate of 33 percent or more is flagged with XX on the printout. It indicates an
unreliable field.
 high FN can also be a result of disease rather than inattentiveness of the patient.
3. Fixation Loses (FL)
 In Heijl-Krakau blind spot method the fixation losses are determined by presenting stimuli at
the location of the blind spot. If the fixation is not maintained the patient would respond to the
stimulus presented at the blind spot.
 The pseudo FL can be recorded even with well-fixated eye if the physiological blind spot is
not in the expected position due to head tilt or anatomical variations.
 FL of 20 percent or more is flagged as unreliable by the machine
 high FP would also influence a high FL as a trigger-happy patient might respond to the FL
catch trial stimulus presented at the blind spot.
 In newer series of HFA gaze monitoring is done by projecting infrared light on
to the cornea and checking for the corneal reflex relative to the pupillary
center. The gaze monitor measures gaze direction with the precision of 1
degree.
 The advantage of using gaze monitors is that
 it monitors fixation with every stimulus that is presented as
compared to Heijl-Krakau blind spot monitoring method, which
tests only 5 percent of the total test time.
Foveal Threshold
• It is useful to have foveal threshold measured in the beginning of the test
and to correlate it with the patient’s best-corrected visual acuity.
• A poor foveal sensitivity with good visual acuity may be an indicator of
wrong refractive correction used.
Zone 3: Raw Numeric Data
 The numeric data comprises of the retinal sensitivities
in decibels (dB) at retinal locations determined by the
field analyzer depending on the strategy used
 The retinal sensitivity can range from 0 to 40 dB, where
0 dB represents no response to maximum light intensity
of 10,000 asb in Humphrey field analyzer. The numeric
value of 40 dB represents response to dimmest
stimulus of 1 asb.
 The numeric data is then compared to normative data
stored in the computer.
• The retinal sensitivities recorded in the numeric
data are displayed in a map form where the value
of sensitivity is represented in 8 different shades
of grey.
• The white areas represent high sensitivity value
and the black indicates low sensitivity. The
sensitivity values are banded into 5 dB groups.
Zone 4: Gray Scale Map
Zone 5: Total Deviation
 It is the difference between the patient’s threshold
measured and value expected in the age matched
normals, at each point.
 The total deviation plot has a numerical plot and a
probability plot
 The numeric plot is the actual decibel deviation at each
point as compared to normative data.
 The probability plot indicates the statistical significance of
each measured deviation and predicts the possibility of
such an abnormality in normal population.
 The Total deviation plot highlights any overall depression of the visual field. The
overall depression of the visual field is caused by media opacities like cataract
and corneal opacities, refractive errors and miosis.
 The localized depressions (scotomas) present within this depressed field
Zone 6: Pattern Deviation
 The pattern deviation plot adjusts the threshold values
according to the general height of the visual field and thus
exposes any localized defects that may be masked by the
generalized depression or elevation of the hill of vision.
 The pattern deviation is depicted in a numerical and
probability plot
 The pattern deviation numeric plot is derived from the total
deviation numerical plot by equating the measured retinal
sensitivity at each point by that amount of dB which converts
the 7th best retinal sensitivity point of the total deviation
numerical plot to normal level.
 During analysis we focus on the probability plot for abnormal
points in a cluster in an expected area of defect.
7: Global Indices
In STATPAC analysis four global indices are provided – Mean Deviation (MD), Pattern Standard
Deviation (PSD), Short-term Fluctuation (SF) and Corrected Pattern Standard Deviation (CPSD)
Mean Deviation (MD)
The MD is derived from the total deviation plot and signifies overall depression or elevation of
patient’s hill of vision. A positive number indicates that the average sensitivity is above the average
for the normals of that age and a negative MD indicates the average sensitivity is below that of the
age matched normals.
A negative MD is likely to be found in generalized depression due to cataract, refractive error, miosis
, due to a large scotoma even in the absence of generalized depression.
Pattern Standard Deviation (PSD)
• The PSD indicates how different the retinal sensitivities are from each other.
In other words it highlights any irregularity in the visual field irrespective of
any depression or elevation in the hill of vision.
• The PSD is also derived from the total deviation plot.
• For example, in a field where all points are equally depressed the mean
deviation would be negative but the PSD would be 0 or very small. On the
other hand a single moderate to large scotoma can produce an abnormal
PSD value.
• An overall depressed field due to media opacity associated with a hidden
localized defect due to glaucoma will give a negative MD with an abnormal
PSD value.
 Short-term Fluctuations (SF)
 This is an index of intratest variation. The retinal sensitivity is tested twice at 10
predetermined points and the difference between them is calculated and expressed as root
mean square of expected values at these locations. SF of less than 3 dB is considered
acceptable. High SF can suggest an unreliable field test or pathological visual field as the SF
can also occur if the point tested is at the edge of a scotoma.
 The SF is also used to correct Pattern Standard Deviation (PSD) and evaluate the Corrected
Pattern Standard Deviation (CPSD).
 In SITA strategy the SF are not tested.
Corrected Standard Pattern Deviation (CPSD)
• CPSD is calculated as an adjustment to the PSD after adjusting for the short-term
fluctuations. The CPSD highlights any irregularities in the visual field irrespective of
any generalized depression of the hill of vision after adjusting for the short-term
fluctuations.
Zone 8: Glaucoma Hemifield Test (GHT)
 The GHT compares five zones (along the nerve
fiber bundles) in the upper field with their mirror
images in the lower field . The GHT is primarily
directed towards the diagnosis of glaucomatous
field loss as the zones are constructed in the
patterns of retinal nerve fibers.
 The GHT gives a plain language analysis of the
visual field test result.
 This is only provided for the standard full
threshold and SITA strategies and is not available
for fastpac strategy.
The GHT gives five possible interpretations:
1.Outside normal limits—If the values of atleast one sector pair in the upper zones compared to those
in the lower zone differ to an extent found in less than 1 percent of the normal population, the GHT is
considered outside normal limits. It is also considered outside normal limits if the difference between the
individual zone scores of any members of any zone pair is found in less then 0.5 percent of the normal
population.
2.Borderline—If on comparing the upper and the lower zones, at least one zone pair difference is what is
expected in less than 3 percent of the normal population the GHT reads as borderline.
3.General reduction of sensitivity is printed whenever a field is depressed to a level seen in less than
0.5 percent of normal population in the patient’s age group.
4.Abnormally high sensitivity is printed when the field shows sensitivity higher than a level seen in less
than 0.5 percent of normal population of that age.
5.Within normal limits —This message appears if none of the above-mentioned conditions apply.
The specificity of GHT is expected to be 94 percent but it depends on severity of glaucoma.
Anderson and patellas criteria
1. Pattern deviation plot of 30-2 program
3 contiguous non eded points --> p<5% , one of it with p <1% ,
Not contigous with the blind spot
in 24-2 program , no need to ignore edge points
2. CPSD (PSD in SITA) <5%
3. GHT outside normal limits
Humphreys visual field analysis powerpoint.pptx

Humphreys visual field analysis powerpoint.pptx

  • 1.
  • 2.
    VISUAL FIELD  Fieldof vision – Def-: Part of enviornment wherein a steadily fixating eye can detect visual stimulus.  TRAQUAIR described the visual field as an “island of vision surronded by a sea of blindness -- island represents the perceived field of vision and the sea of darkness is the surronding areas that are not seen.
  • 3.
  • 4.
    INDICATION OF VFTESTING Find out the extend of VF To diagnose and detect diseases as well as extend of damage caused in VF by the disease To locate possible lesions in neurological disorder To find out the progression of diseases
  • 5.
    METHOD OF VISUALFIELD TESTING Confrontation Amsler grid Perimetry : examine and quantify VF by stimulus of various size , intensity and colour
  • 6.
  • 7.
     STATIC PERIMETRY Performed by determining the retinal sensitivities or threshold at a specific location by using the same size test target but varying its brightness.  commonly used: Octopus and Humphreys  Static perimetry is more sensitive in detecting subtle field changes.
  • 8.
    TERMS • The unitsof light intensity used in perimetry are apostilbs (asb). • Decibel scale is a relative scale to used in automated perimeters to measure the sensitivity at the tested points of the hill of vision. This attenuation of light is expressed in 10th of logarithmic units which are called decibels (dB). It is an inverted logarithmic scale. THRESHOLD Threshold refers to the physiological capacity of retina to detect a stimulus at a given location under specific testing conditions. Threshold represents the minimum intensity of stimulus which can be detected 50% of the time that it is presented. Supra threshold Intensity of stimulus presented above the estimated threshold of a normal visual field location.
  • 9.
    BASICS OF HUMPHREYFIELD ANALYZER (HFA) Humphrey field analyzer is a projection type automated perimeter The Machine • The HFA is based on static mode of stimulus presentation. • The HFA machine has viewing distance of 33 cms • Background luminance of 31.5 asb • Stimulus size (Goldmann stimulus size I–V).
  • 10.
    • The cupula—The HFA uses a cupula (bowl) with 33 cm radius for examination. The field examination is performed with near correction for 33 cm. • The headrest and chinrest —HFA has an adjustable chin rest and headrest. Display and hardware—The newer models have LCD monitors with a touch screen. The perimeter has a built in printer, a storage source and a telescope aligned with the bowl’s center to observe patients fixation.
  • 12.
    Background Illumination  Backgroundillumination is an important parameter as the retinal sensitivity depends on the state of retinal adaptation.  The Humphrey Field Analyzer uses 31.5 apostilbs for background illumination, which is a constant parameter.  The advantage of using Mesopic background conditions is that  1.adaptation time is shorter  2.the examination is less sensitive to aberrant light of the surroundings.  Perimetry should be performed in dim lit room and not in a brightly lit room.
  • 13.
    Stimulus Size andIntensity  The Stimulus in HFA is generated by a projection system.  This allows to control the stimulus size, intensity and its placement.  HFA uses Goldmann stimulus sizes I to V  Most commonly Goldmann size III stimulus (4 mm2, 0.431 degrees) is used.  Goldmann size V is the only other commonly used stimulus size for identification and quantification of remaining portions of the visual field in cases of advanced field loss.  In Short Wave Automated Perimetry (SWAP) Goldmann size V is the standard stimulus used.
  • 17.
    Stimulus Duration HFA thestimulus duration is 0.2 seconds ADVANTAGE • The temporal summation is usually complete • It is shorter than the latency for voluntary eye movements, • Not giving enough time to the patient to look at the stimulus in the periphery.
  • 18.
    Fixation Monitoring • Theaccuracy of the field analysis depends on the stability of the patient’s gaze. • The patient is usually made to fixate at a central spot of light. • In HFA the patient’s fixation can be monitored by Heijl-Krakau blind spot technique or gaze monitoring.
  • 19.
    • Heijl-Krakau methodof fixation monitoring: • This method assumes that with stable fixation the blind spot remains constant, so during a field examination the machine presents suprathreshold stimuli on a previously mapped blind spot. • If the fixation is stable the stimulus is not perceived but if the fixation has changed the stimulus will be perceived. • More that 20% fixation losses represents an unreliable field. The limitations of this method are 1. longer test duration as this adds to the test time, 2.it cannot be used in some strategies like 10-2 3.possibility of missing the fixation loss if the blind spot falls on a scotoma.
  • 20.
    Eye monitoring—The centerof the pupil should coincide with the cross made on the video monitor Gaze monitors—In the newer series of HFA, gaze monitoring is done by projecting infrared light on to the cornea and checking for the corneal reflex relative to the pupillary center . The position of the pupil and the corneal reflex is dependent on the gaze and less dependent on the horizontal and vertical head positions .
  • 21.
    The advantage ofusing gaze monitors is that 1.It monitors fixation with every stimulus that is presented as compared to Heijl-Krakau blind spot monitoring method, which tests only 5 percent of the total test time. 2.No extra time is required as this goes on simultaneously with stimulus presentation. 
  • 24.
    STATPAC  STATPAC isthe computerized statistical package included in all Humphrey perimeters.  Allows comparison of patient’s test result with the age matched normal data  Allows the comparison of patient’s own baseline test data with the follow up test to determine any change in the retinal sensitivities.  The STATPAC analysis is available in threshold testing only and can be printed in the following formats: Single field analysis, Overview, Change analysis, Glaucoma change probability analysis and Glaucoma progression analysis.  STATPAC is not available for macular programs, nasal step test patterns and all screening tests.
  • 25.
    SETTING UP THEPATIENT Patient Instructions 1.Each eye would be tested separately and takes about 10 minutes for a threshold test. 2.The importance of looking at the fixation target (yellow light in the center) through out the test. 3.The light stimuli would be projected in central and peripheral bowl. 4.The response button is given to the patient and he is told to press it in response to every visible stimulus. 5.All projected stimuli will not be visible and the stimulus can vary in brightness from very bright to very dim. 6.All visible stimuli however dim, should be reported. 7.In case of fatigue the patient can halt the test by pressing the trigger continuously or informing the perimetrist. 8.The occluded eye is to be kept open under the occluder and blinking should not be inhibited.
  • 26.
    Refractive Correction  Thepatient’s refractive error must be corrected appropriately for the viewing distance of the cupula of the perimeter.  To determine the appropriate correcting lens the patient’s refractive error for distance and the addition for near is taken  Astigmatism of greater than 1 diopter should be incorporated in the correction.  An inappropriate refractive correction during the test can produce a pseudo generalized depression of the field or a localized scotoma due to retinal blur.  Incorrect placement of the corrective lens can produce artefacts like rim defects.
  • 27.
    THRESHOLD STRATEGIES • Theaim of doing perimetry is to diagnose a disease or monitor its progression. most of the important diagnostic information is located in the central 30 degrees of the visual field • In glaucoma diagnosis and management the focus is on central 24 or 30 degrees. The field is tested at locations 6 degrees apart, which is sensitive to pick up early- localized defects in glaucoma • The Humphrey field analyzer offers the following testing strategies: 1.Suprathreshold testing 2.Threshold testing 1.Full threshold 2. FASTPAC 3 SITA standard and SITAFAST
  • 28.
    SUPRATHRESHOLD TESTING  Insuprathreshold testing the field is mapped with a stimulus that is about 4 to 6 dB above the threshold level.  Suprathreshold examination allows a very rapid evaluation of large number of points in the field.  It helps in the detection of the abnormality and determining its boundaries in a very short time but it does not quantify the depth of the defect.  The main importance of this strategy is for screening purposes especially when the index of suspicion of a defect is low.
  • 29.
    Three methods forsetting the level of screening are available: 1. Single intensity screening—Single intensity stimulus between10 to 24 dB is selected and presented to all points tested. This is not a very useful method and is used mainly for screening field for driving or similar purposes. 2. Age related screening—A stimulus 8 dB more intense than the mean age corrected normal sensitivity is presented at each test point. This is the most preferred method of screening used as it is sensitive enough to detect the field defects and is also less time consuming. 3. Threshold related screening—it presents stimuli about 6 dB higher than the expected threshold sensitivity at each location. This has equal sensitivity for scotomas in the center as well as in the periphery.
  • 30.
    THRESHOLD TESTING In thresholdtesting strategy, light sensitivity (threshold) is determined at each testing location in the field. It gives us more accurate hill of vision and is capable of detecting early and shallow focal loss. There are various test point patterns available with threshold strategies.
  • 32.
    Central 30-2  Measurescentral 30 degree visual field  Total 76 points tested with each point seperated by 6 degree Of visual space Central 24-2  Covers central 24 degree (except nasally where it extend out to 30 degree)  Total 54 points tested with 6 degree between points  Bare area 3 degree
  • 33.
    Central 10-2  Central10 degree  68 points with 2 degree between points  Used on patient with condition that affect central Vision – macular degeneration, diabetic retinopathy or Only a small amount of central vision remains as in end stage glaucoma Macular programme  Central 16 points tested  Distance b/w 2 points is 2 degree  Bare area 1 degree from fixation point  Extension of testing area from fixation point is 5 degree
  • 34.
    The 4-2 Algorithm TheHFA measures the threshold at a given point by a bracketing, or staircase procedure (the 4-2 algorithm).
  • 35.
     In thresholdstrategy the threshold is determined first at 4 primary locations one in each quadrant, symmetrically placed 9 degrees from both the horizontal and vertical meridians. Stimulus is shown randomly at the 4 primary locations, and then the 4-2 algorithm determines the threshold at these points.  The threshold is determined twice at these 4 primary points. Following this the threshold of adjacent points radiating from these primary points is determined.  The principal is that points adjacent to the normal points are expected to be normal and the ones adjacent to abnormal ones are expected to be abnormal.
  • 36.
    Threshold Strategies Available 1.Fullthreshold—In this strategy each point is subjected to the 4-2 algorithm for threshold determination. The threshold of a point is taken as the starting point for the adjacent points 2. FASTPAC  The standard full threshold strategy (4-2 algorithm) time consuming and may lead to patient fatigue and uncooperativeness.  FASTPAC utilizes 3 dB algorithm ,formulated to save time.  The FASTPAC strategy changes the stimulus intensity in 3 dB steps, either increasing or decreasin it depending on patient’s initial response, and crosses the threshold only once hence the threshold determination is not as accurate.  The best resolution attained is 3 dB rather than 2 dB in full threshold.  The FASTPAC reduces the examination time by 35-40% but has not become popular due to high intratest variability i.e. the Short-term Fluctuations (SF).
  • 37.
    Swedish Interactive ThresholdAlgorithm (SITA) The SITA has two testing strategies SITA standard and SITA Fast. Both of them have only 4 tests available namely central 10-2, central 24-2, central 30-2 and peripheral 60-4. All SITA tests use white size III stimulus only. SITA standard takes about half the time of the standard full threshold testing and SITA FAST takes abou half the time of FASTPAC.
  • 38.
    The factors contributingto the time saving efficiency of SITA are: 1. SITA creates prior probability models for normal and glaucomatous populations. Intensity of the initial stimulus presented is based on these models. 2.Reaction time—In SITA the interval between the stimuli presented is determined by analyzing the patient’s response time to the stimulus. 3. Information index -The SITA strategy uses an “information index” derived from the visual field model for each point that determines when to stop.  SITA calculates the threshold considering all the responses and not only the end point at each location.  The SITA standard takes about 7 min (half of 4-2 algorithm) and the SITA Fast takes about 4 min (half of FASTPAC).
  • 39.
    ANALYSIS OF VISUALFIELDDATA INTRODUCTION To understand and interpret the single field printout it is divided in 8 zones • Zone 1: Patient and test data • Zone 2: Reliability indices and foveal threshold • Zone 3: Raw data • Zone 4: Gray scale • Zone 5: Total deviation plot • Zone 6: Pattern deviation plot • Zone 7: Global indices • Zone 8: Glaucoma hemi field test (GHT)
  • 41.
    Zone 1: Patientand Test Data In a single field print out of full threshold analysis the top area has the following Patient data (Figure 7.4.2). •Patient name and identity number: It is important to be sure that we are looking at the field test of the right person. •Age and date of birth: It is also important to check if the patient’s date of birth is fed correctly as the data will be compared to the normals of his age.
  • 42.
    •Eye tested: ensurethat we are looking at the field of the eye of concern. •Visual acuity and refractive correction used: The vision entered and the refractive error used should be correct. In high refractive errors it might be appropriate to use contact lenses. A wrongly corrected or uncorrected refractive error may lead to generalized depression or localized field defects. It is also important to place the lenses in the trail frame correctly and position the trial frame close to the eye to avoid rim defect and ensure maximal field of view. •Pupillary size: The size of the pupil is important; it should be entered correctly and noted so that for all follow up field tests as far as possible the pupillary size should remain the same. •Decrease in the pupillary size results in decreased illumination of the retina, reduction in the sensitivity of the retina and hence results in the apparent worsening of the visual field conversely the increase in the pupillary size results in apparent improvement of the visual fields.
  • 43.
    The Test datahas the following information •Test pattern and Strategy performed: This varies according to our choice depending upon the clinical condition of concern. It is important to confirm whether •the test strategy performed is what we asked for. •Fixation monitor (Blind spot): It is a constant parameter. •Stimulus size: Goldmann size III is the most common target used but in cases of advanced field loss Goldmann stimulus size V is used. •Background illumination: It is constant at 31.5 asb. •Color of the stimulus: White (this is also a constant parameter).
  • 44.
    •Fixation target: •Usually thepatient is asked to fixate at the central fixation target i.e. central yellow light •In cases suspected central scotoma the patient is asked to fix at the small diamond. • Large diamond used in patients who are unable to see the central or small diamond.
  • 45.
    Zone 2: ReliabilityIndices 1. False Positive Response (FP)  The FP represents the tendency of the patient to press the trigger not in response to seeing a stimulus but at random, either as a response to the audible cue or due to the expectation of the stimulus(TRIGGER HAPPY PATIENT)  FP rate more than 15% associated with compromissed test result –better to repeat test  In the printout 33 percent or more FP rate is flagged with a double X (XX) and the machine gives “low test reliability” message.
  • 46.
    2. False NegativeResponse (FN)  The False Negatives (FN) are failure of the patient to respond to stimuli, which are suprathreshold to the sensitivity already measured at that point or adjacent point due to patient inattention or fatigue.  If the patient gets less inattentive as the test proceeds the primary points are not affected but the adjacent points show depressed sensitivity producing a distinctive cloverleaf pattern in the grayscale printout  The FN rate of 33 percent or more is flagged with XX on the printout. It indicates an unreliable field.  high FN can also be a result of disease rather than inattentiveness of the patient.
  • 48.
    3. Fixation Loses(FL)  In Heijl-Krakau blind spot method the fixation losses are determined by presenting stimuli at the location of the blind spot. If the fixation is not maintained the patient would respond to the stimulus presented at the blind spot.  The pseudo FL can be recorded even with well-fixated eye if the physiological blind spot is not in the expected position due to head tilt or anatomical variations.  FL of 20 percent or more is flagged as unreliable by the machine  high FP would also influence a high FL as a trigger-happy patient might respond to the FL catch trial stimulus presented at the blind spot.
  • 49.
     In newerseries of HFA gaze monitoring is done by projecting infrared light on to the cornea and checking for the corneal reflex relative to the pupillary center. The gaze monitor measures gaze direction with the precision of 1 degree.  The advantage of using gaze monitors is that  it monitors fixation with every stimulus that is presented as compared to Heijl-Krakau blind spot monitoring method, which tests only 5 percent of the total test time.
  • 50.
    Foveal Threshold • Itis useful to have foveal threshold measured in the beginning of the test and to correlate it with the patient’s best-corrected visual acuity. • A poor foveal sensitivity with good visual acuity may be an indicator of wrong refractive correction used.
  • 51.
    Zone 3: RawNumeric Data  The numeric data comprises of the retinal sensitivities in decibels (dB) at retinal locations determined by the field analyzer depending on the strategy used  The retinal sensitivity can range from 0 to 40 dB, where 0 dB represents no response to maximum light intensity of 10,000 asb in Humphrey field analyzer. The numeric value of 40 dB represents response to dimmest stimulus of 1 asb.  The numeric data is then compared to normative data stored in the computer.
  • 52.
    • The retinalsensitivities recorded in the numeric data are displayed in a map form where the value of sensitivity is represented in 8 different shades of grey. • The white areas represent high sensitivity value and the black indicates low sensitivity. The sensitivity values are banded into 5 dB groups. Zone 4: Gray Scale Map
  • 53.
    Zone 5: TotalDeviation  It is the difference between the patient’s threshold measured and value expected in the age matched normals, at each point.  The total deviation plot has a numerical plot and a probability plot  The numeric plot is the actual decibel deviation at each point as compared to normative data.  The probability plot indicates the statistical significance of each measured deviation and predicts the possibility of such an abnormality in normal population.
  • 54.
     The Totaldeviation plot highlights any overall depression of the visual field. The overall depression of the visual field is caused by media opacities like cataract and corneal opacities, refractive errors and miosis.  The localized depressions (scotomas) present within this depressed field
  • 55.
    Zone 6: PatternDeviation  The pattern deviation plot adjusts the threshold values according to the general height of the visual field and thus exposes any localized defects that may be masked by the generalized depression or elevation of the hill of vision.  The pattern deviation is depicted in a numerical and probability plot  The pattern deviation numeric plot is derived from the total deviation numerical plot by equating the measured retinal sensitivity at each point by that amount of dB which converts the 7th best retinal sensitivity point of the total deviation numerical plot to normal level.  During analysis we focus on the probability plot for abnormal points in a cluster in an expected area of defect.
  • 56.
    7: Global Indices InSTATPAC analysis four global indices are provided – Mean Deviation (MD), Pattern Standard Deviation (PSD), Short-term Fluctuation (SF) and Corrected Pattern Standard Deviation (CPSD) Mean Deviation (MD) The MD is derived from the total deviation plot and signifies overall depression or elevation of patient’s hill of vision. A positive number indicates that the average sensitivity is above the average for the normals of that age and a negative MD indicates the average sensitivity is below that of the age matched normals. A negative MD is likely to be found in generalized depression due to cataract, refractive error, miosis , due to a large scotoma even in the absence of generalized depression.
  • 57.
    Pattern Standard Deviation(PSD) • The PSD indicates how different the retinal sensitivities are from each other. In other words it highlights any irregularity in the visual field irrespective of any depression or elevation in the hill of vision. • The PSD is also derived from the total deviation plot. • For example, in a field where all points are equally depressed the mean deviation would be negative but the PSD would be 0 or very small. On the other hand a single moderate to large scotoma can produce an abnormal PSD value. • An overall depressed field due to media opacity associated with a hidden localized defect due to glaucoma will give a negative MD with an abnormal PSD value.
  • 58.
     Short-term Fluctuations(SF)  This is an index of intratest variation. The retinal sensitivity is tested twice at 10 predetermined points and the difference between them is calculated and expressed as root mean square of expected values at these locations. SF of less than 3 dB is considered acceptable. High SF can suggest an unreliable field test or pathological visual field as the SF can also occur if the point tested is at the edge of a scotoma.  The SF is also used to correct Pattern Standard Deviation (PSD) and evaluate the Corrected Pattern Standard Deviation (CPSD).  In SITA strategy the SF are not tested.
  • 59.
    Corrected Standard PatternDeviation (CPSD) • CPSD is calculated as an adjustment to the PSD after adjusting for the short-term fluctuations. The CPSD highlights any irregularities in the visual field irrespective of any generalized depression of the hill of vision after adjusting for the short-term fluctuations.
  • 60.
    Zone 8: GlaucomaHemifield Test (GHT)  The GHT compares five zones (along the nerve fiber bundles) in the upper field with their mirror images in the lower field . The GHT is primarily directed towards the diagnosis of glaucomatous field loss as the zones are constructed in the patterns of retinal nerve fibers.  The GHT gives a plain language analysis of the visual field test result.  This is only provided for the standard full threshold and SITA strategies and is not available for fastpac strategy.
  • 61.
    The GHT givesfive possible interpretations: 1.Outside normal limits—If the values of atleast one sector pair in the upper zones compared to those in the lower zone differ to an extent found in less than 1 percent of the normal population, the GHT is considered outside normal limits. It is also considered outside normal limits if the difference between the individual zone scores of any members of any zone pair is found in less then 0.5 percent of the normal population. 2.Borderline—If on comparing the upper and the lower zones, at least one zone pair difference is what is expected in less than 3 percent of the normal population the GHT reads as borderline. 3.General reduction of sensitivity is printed whenever a field is depressed to a level seen in less than 0.5 percent of normal population in the patient’s age group. 4.Abnormally high sensitivity is printed when the field shows sensitivity higher than a level seen in less than 0.5 percent of normal population of that age. 5.Within normal limits —This message appears if none of the above-mentioned conditions apply. The specificity of GHT is expected to be 94 percent but it depends on severity of glaucoma.
  • 62.
    Anderson and patellascriteria 1. Pattern deviation plot of 30-2 program 3 contiguous non eded points --> p<5% , one of it with p <1% , Not contigous with the blind spot in 24-2 program , no need to ignore edge points 2. CPSD (PSD in SITA) <5% 3. GHT outside normal limits

Editor's Notes

  • #4 Hill of vision is a 3D representation of the retinal light sensitivity In the normal visual field examination, the fovea is the most sensitive point tested and represents the peak. Blind spot is 15 degree temporal to point of fixation. The island of vision extends roughly 60 degree superiorly and nasally , 75 degree inferiorly and 100 degree temporally
  • #8 The shape of the hill of vision is defined by repeating the threshold determination at various locations in the field of vision
  • #13 mesopic bacgkground means low light/ or twillight codition
  • #14 short wave automated perimetery , aka blue on yellow perimetry --- to detect early visual field loss normal perimetry detects field defects when 40 % of retinal ganglion cells lost. blue stimulus against a yellow background and a flicker stimulus are 2 stratergies to detect early field damages
  • #23 This gaze tracking generates a gaze graph at the bottom of the printout. like in this picture In the graph the upward spikes represent eye movements and downward spikes are due to blinking.
  • #25 statpac ,thus helping in detection of abnormalities in the visual field.
  • #50 In newer series of HFA gaze monitoring is done by projecting infrared light on to the cornea and checking for the corneal reflex relative to the pupillary center. The gaze monitor measures gaze direction with the precision of 1 degree. The advantage of using gaze monitors is that it monitors fixation with every stimulus that is presented as compared to Heijl-Krakau blind spot monitoring method, which tests only 5 percent of the total test time.
  • #63 glaucomatous field defect in absence of retinal/ neurological diseases affecting visual field..........and also should confiron second test include all3 --> high specificity include any one --> high sensitiviy , low specificity